HAL Id: hal-02342963
https://hal.archives-ouvertes.fr/hal-02342963
Submitted on 6 Apr 2020
HAL is a multi-disciplinary open access archive for the deposit and dissemination of sci-entific research documents, whether they are pub-lished or not. The documents may come from teaching and research institutions in France or abroad, or from public or private research centers.
L’archive ouverte pluridisciplinaire HAL, est destinée au dépôt et à la diffusion de documents scientifiques de niveau recherche, publiés ou non, émanant des établissements d’enseignement et de recherche français ou étrangers, des laboratoires publics ou privés.
Local experimental methodology for the study of
microparticles resuspension in ventilated duct during fan
acceleration
Félicie Theron, Djihad Debba, Laurence Le Coq
To cite this version:
Félicie Theron, Djihad Debba, Laurence Le Coq. Local experimental methodology for the study of microparticles resuspension in ventilated duct during fan acceleration. Journal of Aerosol Science, Elsevier, 2020, pp.105477. �10.1016/j.jaerosci.2019.105477�. �hal-02342963�
Local experimental methodology for the study of microparticles
resuspension in ventilated duct during fan acceleration
Félicie Therona,*, Djihad Debbaa, Laurence Le Coqa
a
IMT Atlantique, GEPEA, CNRS UMR 6144, CS 20722, 44307 Nantes, France *Corresponding author:
E-mail address: [email protected] (F. Theron) Tel.: +33 (0)2 51 85 82 60
Keywords: Particle resuspension; Ventilated duct; Air flow properties; Resuspension kinetics Abstract
The purpose of this study is to develop an experimental methodology with relevant space and time resolutions to track the velocity properties responsible for the resuspension of microparticles during the acceleration stage of a fan start. Microparticles release is investigated over a time period of several seconds, i.e. at short time. This methodology involves velocity signal measurements thanks to Hot Wire Anemometry, and an optical counting method to build resuspension kinetics curves. During the fan acceleration the velocity evolution is characterized by two stages: a first increase without fluctuations, and then the acceleration with fluctuations. The same behavior is observed whatever the distance to the wall at which velocity is considered. The resuspension phenomenon seems to be initiated by a threshold turbulent kinetic energy, i.e. by turbulent events powerful enough to release microparticles having the lowest adhesion forces. For the studied particles properties/wall properties/aeraulic conditions, a significant fraction of particles remains on the duct wall at the end of experiments, despite the fact that the remaining fraction is stabilized. This may reveal that the highest energy levels of flow events seen by microparticles were not powerful enough to release particles having the highest adhesion forces.
1. Introduction
Resuspension occurs when a particle initially located on a surface is detached and reentrained in air, i.e. is re-aerosolized. The ranges of particle materials, morphologies and sizes concerned are very wide as this phenomenon can involve airborne particles like sediments, bacteria, industrial pulverulent products,…The transport of aerosol in ventilation systems is responsible for particle deposition in duct walls. The exposure of those deposits to the airflow can lead to particle resuspension, especially during the acceleration of the airflow (for example in cases of fan restart after some maintenance period, or after week-end or night ventilation stop or velocity decrease). Particles reentrainment in duct portions upstream of filtration systems participates to filters clogging. If they are released in duct portions dedicated to indoor air blowing they can contaminate or damage manufactured products of various industrial sectors such as the food industry, the semiconductor industry or the cosmetic/pharmaceutical industry, and/or represent a significant risk for human health due to their inhalation. As a consequence, particle release originating from PM resuspension can be responsible for various health effect such as allergies or inflammatory symptoms (Wu et al., 2018).
A particle will be released in air if the removal forces exceed the adhesion forces exerted on it. As listed by Habchi et al. (2016) the adhesion forces consist in distance forces like gravity, electrostatic forces and Van der Walls force, as well as contact forces like surface tension forces.
Removal forces which lead to resuspension can be of various origins: aeraulic, mechanical, vibrational and centrifugal. The force balance is more complex when particles are in contact with each other due to particle/particle interactions. As described by Boor et al. (2013) it is possible to distinguish monolayer deposits which involve particles sparsely distributed on the wall surface, and multilayer deposits which can be seen as a porous structure due to the stacking of particles. The present study focuses on the resuspension phenomenon triggered by aerodynamic forces induced by the airflow in ventilation ducts, for cases of monolayer deposits of isolated particles in order to avoid particle/particle interactions. In such case the resuspension phenomenon is influenced by many parameters which can be classified into (i) particles properties (density, morphology, size, charge), (ii) wall properties (material, roughness, charge), and (iii) airflow properties close to the wall; i.e. in the viscous sublayer (where particles are initially located). For a given set of air thermodynamic properties/wall properties/particle properties without any particle/particle interaction (monolayer deposit) the adhesion forces do not change over time, but the aerodynamic forces can evolve if the airflow exhibits a transient event like temporal flow acceleration which can happen in case of fan restart after a shutdown period.
The experimental conditions of the investigations reported in the literature that focused on monolayer initial deposits are detailed in Table 1. Those experiments mostly involved spherical particles with diameters ranging from 10 to 100 µm, deposited on rather smooth wall materials, with initial deposit concentrations of 0.5 to 5 part.mm-2.
The temporal airflow patterns to which microparticle deposits were exposed depend on the one hand on the type of data sought by the authors (resuspension kinetics versus time, or threshold velocity to remove 50% of the particles), and on the other hand on the characteristics of the measurement technique employed (observed parameter, acquisition frequency,…). For all of those studies the air flow conditions indicated in the Table 1 are representative of the average air velocity pattern in the duct: Ufs and Umean are free-stream velocity and mean velocity reached
after the temporal acceleration or in the end of the experiment respectively, and α is the temporal flow acceleration.
Authors Particle properties Deposit
properties Wall properties Air flow conditions
Experimental approach and velocity properties quantified
(when reported)
Braaten et al. (1990)
Lycopodium spores
Dp=27.8±1.07µm Not reported Glass Ufs=6.0;7.5;9.0m.s -1
- Trials of 35 minutes (involving an acceleration period of approximately 1 minute) - Fraction of removed particles versus time thanks to a laser photodiode detection system (observation field: 3.1 mm²; time resolution of few milliseconds)
Braaten et al. (1994) Lycopodium (modified pyramidal) ρp=1180kg.m-3 Dp,mean=28µm Timothy pollen (spheroidal) ρp=1000kg.m -3 Dp,mean=34µm Microballoons (spherical) ρp=1140kg.m -3 Dp,mean=30µm (24-42 µm) Glass (spherical) - Concentration: ≈ 5 part.mm-² Glass U fs=5.44-19.61m.s-1
- Trials of 2 minutes after reaching the preset operating speed - Counting before and after exposition to the air flow tanks to a microscope and a hand held counter
- Determination of the threshold
free-stream velocity and the threshold friction velocity
required to initiate particle reentrainment, and of the free
stream velocity required to reentrain 50% of the particles
ρp=2500kg.m-3 Dp,mean=20µm (18-30 µm) Nickel (spherical) ρp=8910kg.m-3 Dp,mean=18µm (12-21µm) Ibrahim et al. (2003) Stainless steel (spherical) ρp=8000 kg.m-3 Dp=64-76µm Glass (spherical) ρp=2420 kg.m -3 Dp=68.2-77µm Dp=29.7-34.1µm Lycopodium spores (non-spherical) Dp=25-35µm Stainless steel (spherical) ρp=8000 kg.m-3 Dp=10-65µm Concentration: ≈ 1 part.mm-² Glass Average standard deviation of the surface roughness height = 17 A° Ufs=7;11;23m.s-1 - Typical trials of 60 or 150 seconds (airflow increasing linearly from 0 to 11 or 23 m.s-1 respectively)
- Detachment fraction versus time and corresponding free stream velocity by optical counting (observation field: 13.7x10.2 mm²; faq = 30Hz)
- Observation of particle detachment thanks to high-speed imaging (channel top view; faq = 30Hz)
- Determination of the
free-stream velocity required to reach 50% of detached particles Ibrahim et al. (2004) Stainless steel (spherical) ρp=8000 kg.m-3 Dp=64-76µm Concentration: ≈ 0.5;3 part.mm-² Glass Ufs=7.3;11.5;24.0 m.s-1 α=0.014-0.39m.s-2 - Trials of approximately 35 seconds to 13 minutes (airflow increasing linearly from 0 to the targeted velocity)
- Detachment fraction versus free stream velocity by optical counting (observation field: 13.7x10.2 mm²; faq = 30Hz) Ibrahim & Dunn (2006) Stainless steel (spherical) ρp=8000 kg.m -3 Dp=64-76µm Concentration: ≈ 0.5 part.mm-² Glass Average standard deviation of the surface roughness height = 17 A° Ufs=14.1m.s-1 α=0.01-2.0 m.s-2 (and up to 23 m.s-2 without microparticles)
- Detachment fraction versus free stream velocity by optical counting (observation field: 13.7x10.2 mm²; faq = 30Hz) - Free-stream velocity versus time - Local flow velocity (at a vertical wall distance of 80 µm) versus free-stream Reynolds
number
- Free-stream and local velocity required to reach 50% of
detached particles versus mean flow acceleration Ibrahim et al. (2008) Glass (spherical) ρp=2400 kg.m-3 Dp=30.1±2.1; 52.6±3.2; 72.6±4.4; 90.3±4.5; 111±5.5 µm Concentration: ≈ <0.5 part.mm-² Glass Ufs=5-24 m.s-1 α=0.13 m.s-2
- Detachment fraction versus free stream velocity by optical counting (observation field: 13.7x10.2 mm²; faq = 30Hz) - Determination of the
free-stream velocity required to reach 50% of detached particles Jiang et al. (2008) Glass (spherical) ρp=4200 kg.m -3 Dp,50=22±1.11; 30±1.07; 41±1.04µm PMMA (spherical) ρp=1200 kg.m-3 Dp,50=11±1.07; 16±1.06µm
Area: 25x4mm² Stainless steel Ra=0.01–1.64 µm
Umean=300m.s-1
α=0.5m.s-2
- Trials of 600 seconds (airflow increasing from 0 to 300 m.s-1) - Entrainment efficiency versus average air velocity and corresponding wall shear stress by laser dust monitoring (faq = 10Hz)
- Observation of particle entrainment thanks to high-speed imaging (channel top view; faq = 4000Hz) Kassab et al. (2013) Glass (spherical) ρp=2480-2520 kg.m-3 Concentration: ≈ 4.31±1.70 part.mm-² Hardwood Ra=0.072±0.002µm Umean=9;11;16m.s-1
- Trials of 5 seconds including 1 second of acceleration - Fraction of detached particles
Dp,mean=26.41µm (10-30 µm) Dp,mean=36.24µm (30-50 µm) Dp,mean=45.31µm (50-100 µm) ≈ 3.60±1.53 part.mm-² ≈ 1.94±0.64 part.mm-² Ceramic Ra=0.038±0.020µm Glass Ra=(0.536±0.054) .10-3µm
versus time by optical counting (faq = 2000 Hz)
- Individual particle trajectories thanks to high-speed imaging (channel side view; faq = 4000 Hz)
Barth et al. (2014) Glass (spherical) ρp=4100 kg.m-3 Dp,mean=25;35;44 µm σ<1.15µm Polypropylene (not perfectly spherical) ρp=1200 kg.m-3 Dp,mean=11.8µm σ=1.9µm > 500 part. In the field of view Smooth borosilicate glass Ra=0.025µm Steel Ra=0.089–1.538µm Umean * =1-10m.s-1
- Trials of 60 seconds including 20 seconds of acceleration
- Remaining fraction versus friction velocity by optical counting - Determination of the
friction velocity required to
reach a resuspended fraction of
50% Table 1: Experimental conditions of resuspension studies involving a monolayer deposit
*
Mean velocity re-calculated from reported Reynolds number and hydraulic diameter
Those experimental approaches mostly focused on the determination of threshold velocities (free-stream or at near wall distance) required to detach or reentrain 50% of the microparticles. For that purpose the deposits were exposed to velocity patterns consisting in linear accelerations, designed to quantify the fraction of removed particle as a function of the velocity. The aim of such procedure is to determine mean airflow parameters to be used in the estimation of the aeraulic forces, and to a larger extend in the estimation of the removal forces, to be compared to the adhesion forces. The reason for considering the resuspension of half of the initially deposited microparticles is to account for the fact that even for spherical particles, with size distribution as narrow as possible, the adhesion forces can exhibit a wide distribution (due to the heterogeneities of the topological properties, the chemical properties and the electrostatic charge of both the particles and the duct surface) making impossible to assign the resuspension start to one precise velocity value, but more to a velocity range (Ibrahim et al., 2003). Moreover the authors who studied the resuspension phenomenon through a velocity pattern representative of a fan start (Braaten et al., 1990; Braaten et al., 1994; Kassab et al., 2013, Barth et al., 2014), i.e. a temporal flow acceleration followed by steady state (at short-term or long-term), captured the temporal evolution of reentrained particles without information concerning the local airflow properties to which they were exposed.
Due to the number of parameters that influence the resuspension phenomenon, which can be very difficult to characterize at the particle scale and can evolve with time, the resuspension phenomenon is very complex, even for monolayer initial deposits. That is why many models have been developed to predict monolayer particle resuspension, and especially over the last decade. There are several reviews in the literature that deal with particle resuspension models: Ziskind et al. (1995), Stempniewicz et al. (2008), Zhang et al. (2013), and Henry & Minier (2014 a). Henry & Minier (2014 a) proposed to classify them into empirical, static and dynamic models. Among the empirical models, the recent model of Kim et al. (2010) is based on dimensional analysis. This model predicts the resuspension rate, i.e. the fraction of particles removed from the surface per time unit as a function of macroscopic parameters which have been detected as having an influence on the resuspension phenomenon on the basis of two experimental data sets. The static models are based on the disruption of the particle/surface static equilibrium through a static force or momentum balance (depending on the mechanism identified as being responsible for resuspension among rolling, sliding or lifting). One can cite the models developed by Goldasteh et al. (2013) and You & Wan (2014, 2017). Another approach of those models is to consider a kinetic probability density function (PDF) of some parameters influencing the phenomenon. The models proposed by Reeks & Hall (2001), and recently by Benito et al. (2015, 2016, 2018) are some examples of kinetic PDF models. The last type of resuspension models is the dynamic PDF approach which considers the motion of particles along the surface
before being released like the models developed by Guingo & Minier (2008) and Henry & Minier (2014 b). Most of the previously cited models predict the fraction of resuspended particles as a function of the friction velocity and validate them from the experimental data of Ibrahim et al. (2003, 2004, 2008) and Ibrahim & Dunn (2006). It would thus be interesting to enlarge the experimental ranges of particle and wall properties as well as airflow conditions covered in the literature in order to challenge or improve the resuspension models with new experimental data. The present study aims at developing an experimental methodology to address the dynamic phenomenon leading to resuspension for particle size and airflow conditions representative of those involved in ventilation systems in terms of mean acceleration and mean velocity at steady state. The objective is to record the resuspension kinetics for a known number of particles exhibiting a given adhesion force distribution. Then the resuspension kinetics is analyzed regarding the instantaneous airflow properties experienced by microparticles, i.e. at duct wall distance of the order of magnitude of the particle size. The final objective is to determine the airflow properties responsible for the first resuspension events. To a larger extent the objective is to generate experimental data that push forward the resuspension models by considering the local dynamic effects, i.e. the instantaneous airflow properties experienced by the particles. For that purpose, an experimental methodology involving both resuspension kinetics measurement and air velocity signal acquisition in the viscous sublayer, i.e. at duct wall distance relevant with particles initial position, has been developed. In Section 2 of this paper the materials and methods used to carry out those experiments are detailed. Then in Section 3.1 the aeraulic characterization of the experimental wind tunnel is presented: the properties of the vertical boundary layer at steady state are firstly described, and secondly the temporal evolution of air velocity signals at two different vertical distances to the wall during the fan acceleration are investigated. The Section 3.2 is dedicated to the description and modeling of the resuspension kinetics results. The objective of Section 3.3 is to analyze those data regarding the instantaneous wall velocity signal properties.
2. Materials and methods
In this section the materials and methods employed to carry out the resuspension experiments are presented. This experimental methodology has been developed to focus on the airflow properties responsible for the resuspension phenomenon. The experiments have thus been conducted on the basis of microparticle deposits with controlled properties. The idea is to limit the number of parameters that may broaden the adhesion forces distribution. That is why spherical particles have been used, with a size distribution as narrow as possible. The particle size range has been chosen to be representative of that concerned by the Indoor Air Quality research area, i.e. representative of particles that can be found in ventilation systems and represent some sanitary risk, while being detectable by the optical experimental method used (see section 2.3.4). This size range also enables to generate new particle resuspension kinetics data for smaller particles than those reported in the literature (see Table 1). The particle concentration of the initial deposit was also chosen to generate monolayer deposits and avoid particle/particle interactions.
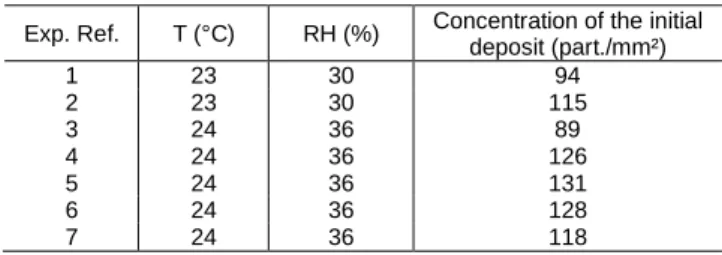
Seven experiments were conducted under similar flow conditions, representative of those typically used in ventilated ducts: a mean velocity at steady state of 7.6 m.s-1 and a mean acceleration of 2.1 m.s-2. The experimental conditions of each experiment are presented in Table 2.
Exp. Ref. T (°C) RH (%) Concentration of the initial deposit (part./mm²) 1 23 30 94 2 23 30 115 3 24 36 89 4 24 36 126 5 24 36 131 6 24 36 128 7 24 36 118
Table 2: Experimental conditions of resuspension experiments 2.1. Experimental setup
The experiments were carried out in the wind tunnel presented in Figure 1. The inlet section is followed by a contraction section in order to homogenize the flow. The test section is of 2 m length, and of 20x4 cm² rectangular cross section. This test section is made of antistatic pmma in order to avoid electrostatic interactions with particles. This material is rather smooth: a preliminary characterization of its roughness was carried out and a mean asperities height value of the order of 10 nm was obtained.
The fan is located at the tunnel outlet. It is equipped with a programmable flow controller in order to be able to set the mean flowrate at steady state as well as the mean flow acceleration. The wind tunnel is also equipped with k-type thermocouples of 1.5°C accuracy that measure the temperature every second (their response time being less than one second), and with a relative humidity sensor of 2% accuracy and time response of few seconds to measure the relative humidity during experiments. All the experiments were carried out at temperature ranging from 23 to 24 °C, and at relative humidity ranging from 30 to 36% (see Table 2).
The velocity measurements as well as resuspension monitoring were carried out at similar distance from the entrance in the test section of x = 1.3 m in order to ensure established flow conditions.
Figure 1: Diagram of the experimental rig used to carry out experiments 2.2. Acquisition of air velocity signals
Two experimental campaigns were carried out to characterize the airflow. The first one consisted in the acquisition of a vertical velocity profile (velocity versus the vertical coordinate y) at steady state in order to characterize the boundary layer and to determine the viscous sublayer thickness. The second step consisted in the simultaneous recording of the air velocity at the half duct height and in the viscous sublayer during the fan temporal acceleration, from zero velocity up two several seconds after reaching steady state. Those last measurements aimed at characterizing the velocity pattern experienced by microparticles during the fan start.
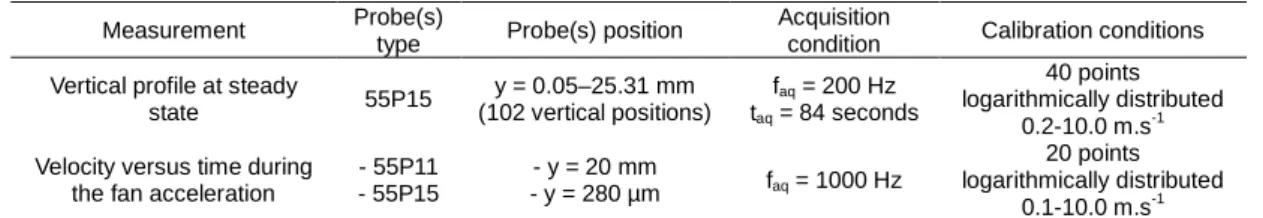
The measurements were conducted by Hot Wire Anemometry (HWA) thanks to a Dantec Constant Temperature Anemometry acquisition chain. Two probes of 5 µm diameter were used: a straight 55P11 probe mounted on a vertical straight support for measurements in the bulk flow and a 55P15 probe relevant for recordings in the boundary layer mounted on a right-angled support. The velocity range measurable by each probe is 0.05 – 500 m.s-1. The type(s), vertical position(s) and calibration conditions of probes used for both characterization steps are detailed in Table 3. For both steps the probes were located at a x distance from the entrance in the test section of 1.3 m, and a z distance from the vertical duct wall of 30 mm.
In order to measure with precision the vertical distance to the duct wall y a CCD camera equipped with an optical zoom lens was used. The vertical displacement of the probe to obtain the vertical profile at steady state was ensured by a micrometric displacement system of 6 µm precision.
Measurement Probe(s)
type Probe(s) position
Acquisition
condition Calibration conditions Vertical profile at steady
state 55P15 y = 0.05–25.31 mm (102 vertical positions) faq = 200 Hz taq = 84 seconds 40 points logarithmically distributed 0.2-10.0 m.s-1 Velocity versus time during
the fan acceleration
- 55P11 - 55P15 - y = 20 mm - y = 280 µm faq = 1000 Hz 20 points logarithmically distributed 0.1-10.0 m.s-1
Table 3: Experimental conditions of velocity signals acquisitions 2.3. Acquisition of resuspension kinetics data
This section is dedicated to the presentation of the materials and methods used to obtain the resuspension kinetics data.
2.3.1. The microparticles
The resuspension experiments involved bronze particles of 8000 kg.m-3 density and of spherical shape as shows the Scanning Electron Microscopy picture presented in Figure 2. The initial powder is sieved in order to obtain a size range of 3-30 µm, with a median diameter D50 of 16
µm, and D10 and D90 values (in terms of number size distributions) of 10 µm and 25 µm
respectively.
Figure 2: SEM observation of the bronze particles 2.3.2. Deposit generation
For each experiment a 1 cm² monolayer deposit was prepared prior to resuspension experiments with a particle concentration allowing a statistically representative counting of particles, while having as much as possible isolated particles to avoid particle/particle interactions. Deposits were generated using a Palas RBG 1000 generator. After flowing through a PALAS CD-2000 neutralizer they were drawn to a sedimentation chamber laid on the test section. The generation conditions as well as the sedimentation time were set in order to achieve the targeted particle number, i.e. several hundreds of particles in the field of view (2.0x1.5 mm²), and to guarantee monolayer deposits. This was checked thanks to the CCD camera observations (see next section).
2.3.3. Deposit characterization and resuspension kinetics monitoring
An optical method was used in order to count particles and measure their size distribution. For this purpose a Speed Sense 1020 CCD camera (Dantec Dynamics) of 2320 x 1750 pixel² equipped with a zoom lens (La vision Lens) was used in order to get images of 2.0 x 1.5 mm² with a resolution of 1.2 µm / pixel. The camera was located below the test section (see Figure 1), and the deposit was lighted from the top of the test section thanks to a 50W LED light. The picture acquisitions were carried out at 170 Hz. Each trial involved an acquisition time of 14 seconds which enabled to cover the acceleration period as well as a significant period of steady state.
For all the resuspension experiments the number of particles contained in the observation zone of the initial deposit was 340 ± 56 (see Figure 3 as an example), which corresponds to a concentration of 114 ± 17 part.mm-².
2.3.4. Image treatment procedure to build resuspension kinetics
In order to obtain the resuspension kinetics curve an image processing methodology has been developed. For each experiment this methodology was applied to one picture on ten over the whole number of recorded pictures, which resulted in a time step of 0.06 seconds between two treated pictures, and a total of 239 treated pictures.
The Image J software was used to detect, count and characterize the size distribution of particles. The first step of this procedure involved classical pre-treatments (smoothing, shaping and filtering). Then pictures were binarized. In order to count separately particles which were agglomerated a water-shedding step was applied. Finally the particle analysis tool was used to get the number of particle as well as morphological information about each of them. Due to the resolution at which the pictures were acquired (1.2 µm / pixel) particles of size lower than 9 µm were not taken into consideration in the counting step of the treatment procedure. This allows to ensure that the size of the smallest particles counted is represented at least by 10 pixels.
This procedure enabled to build the resuspension kinetics for each trial, i.e. to plot the evolution of the fraction of particles remaining on the duct wall F versus time, thanks to the following expression:
F(t) = 100. (( )) (1)
With n(t) the number of particles remaining on the duct wall at time t, and n(t=0) the initial number of particles deposited on the duct wall. In order to be more statistically representative, i.e. to get a resuspension kinetics based on a higher number of particles, a unique curve was plotted taking into account the total number of particles initially deposited on the duct wall for the 7 experiments performed. The instantaneous fraction of particles remaining on the duct wall was calculated as follows:
F = 100.∑∑ (()) (2)
This curve is named global resuspension kinetics in the rest of the document. 3. Results and discussion
3.1. The airflow properties
3.1.1. Aeraulic characterization of the duct at steady state
The vertical velocity profile measured at steady state enables to characterize the structure of the turbulent boundary layer. In order to represent the dimensionless vertical velocity profile (u+ versus y+), the friction velocity u* defined as follows was calculated from the slope at origin of the velocity profile:
u∗= ν. (3)
Where is the fluid kinematic viscosity. The value obtained is 0.36 m.s-1.
equations (4) and (5), was then derived from the u* value. The obtained profile is presented in Figure 4. y"= . ∗ # (4) u"= ∗ (5)
Figure 4: Dimensionless representation of the vertical velocity profile at steady state
This profile is consistent with the theory as the three zones characteristic of the boundary layer fit rather well with the experimental data. The logarithmic law starts at y+ values higher than 30, and the viscous sublayer is reached for y+ values lower than 8. The corresponding viscous sublayer thickness δ is 353 µm. The microparticles used for resuspension experiments, of diameter ranging from 3 to 30 µm, will thus be completely immersed in the viscous sublayer before being released.
A discrepancy between the theory and experimental data concerning the viscous sublayer law for y+ values lower than 3 (corresponding to a y value of 135 µm) can be observed in Figure 4. In this region the experimental profile exhibits an overestimation of the velocity. For the rest of this section for this y+ range (0 to 3) the experimental data are thus presented thanks to open symbols. The velocity overestimation is a well known phenomenon for wall velocity measurements close to walls by HWA (Hutchins & Choi, 2002; Zanoun et al., 2009; Orlu et al., 2010). As explained by Hutchins & Choi (2002), the hot wire sensor exhibits a conductive heat transfer to the wall in addition to the convective heat transfer. This conductive effect is combined with an increasing aerodynamic blockage effect which is explained by the proximity of the wire and prongs to the wall.
In order to characterize the properties of the velocity fluctuations, and especially in the viscous sublayer, the skewness and flatness coefficients were calculated for each point of the vertical velocity profile.
The skewness coefficient s, which is calculated through the equation (6), enables to depict the tendency of the fluctuations to be rather directed downward (s < 0) or upward (s > 0) compared to the mean velocity.
s = &&&&%
' ²&&&)%/+ (6)
The flatness coefficient, which is calculated through the equation (7), reflects the magnitude of velocity fluctuations from the mean value.
f = &&&&
-' ²&&&)+ (7)
The evolutions of the skewness and the flatness coefficients with the dimensionless vertical distance to the wall y+ are presented in Figures 5 and 6 respectively, and superimposed to the data reported by Keirsbulck et al. (2012).
Figure 5: Evolution of the skewness coefficient with the dimensionless distance to the wall (circles); and comparison to the data reported by Keirsbulck et al. (2012): LDA measurements (open symbols) and LDA measurements from De Graaff & Eaton (2000) (black symbols), HWA measurements (grey symbols) and DNS
from Schlatter et. al (2009) (solid line)
Figure 6: Evolution of the flatness coefficient with the dimensionless distance to the wall (circles); and comparison to the data reported by Keirsbulck et al. (2012): LDA measurements (open symbols) and LDA
measurements from De Graaff & Eaton (2000) (black symbols), HWA measurements (grey symbols) and DNS from Schlatter et. al (2009) (solid line)
Those skewness and flatness vertical profiles are in good agreement with those reported by Keirsbulck et al. (2012) and obtained by laser velocimetry and DNS simulations, even concerning the 0-3 range of y+, i.e. the deepest part of the viscous sublayer in which an overestimation of the velocity profile has been aforementioned. Those s and f profiles can thus be interpreted in terms of orders of magnitude for all the viscous sublayer thickness.
In the logarithmic zone (y+ > 30) the skewness coefficient is close to 0 and the flatness coefficient is close to 3. This indicates that the velocity fluctuations are almost symmetrically distributed around the average value, and of low magnitude.
In the viscous sublayer, i.e. in the zone concerned by the resuspension phenomenon, the skewness coefficient is in the order of 1.1 and the flatness coefficient reaches values up to 5.0. Such values mean that the fluctuations are mostly directed upward compared to the average value, and of higher magnitude. The properties of the velocity fluctuations at wall distances which concern the particles before being released thus appear rather suitable with the resuspension phenomenon.
3.1.2. Air velocity signals during the fan acceleration
The velocity signals recorded simultaneously at the half duct height (y = 20 mm) and in the viscous sublayer (y+ = 6.4, i.e. y = 280 µm) during the fan acceleration are superimposed in Figure 7. Those signals exhibit the same characteristic times. In fact after the fan start the time required for the velocity to start increasing is of 1.8 seconds for both signals. At that time the velocity starts increasing but without any fluctuations. Then the first fluctuations appear at 3.1 seconds, and the steady state is reached after 5.8 seconds: the mean velocity at the half duct height is 7.7 m.s-1, and is 2.3 m.s-1 at y+ = 6.4. The total recording time of 14 seconds, which is similar for resuspension experiments, thus enables to cover the transient period of acceleration (4 seconds) and a significant steady state period of 8.2 seconds.
Although the lowest distance to the wall at which data are recorded (y = 280 µm) is one order of magnitude higher than particles diameter it is still located in the viscous sublayer. Those results thus enable to get information about the characteristic times which must also be representative of the air flow properties to which particles are submitted during the fan temporal acceleration.
Figure 7: Instantaneous evolution of the velocity at the half duct height (y = 20 mm) and in the viscous sublayer (y+ = 6.4, i.e. y = 280 µm)
Having characterized airflow patterns in the duct at steady state and during the fan acceleration, the next section is dedicated to the analysis of resuspension kinetics data.
3.2. Resuspension kinetics data 3.2.1. Statistical analysis
In order to evaluate the repeatability of the measurements, the resuspension kinetics obtained for each experiments (equation (1)) are compared in Figure 8, and compared to the global resuspension kinetics established by taking into account the total number of particles initially counted for the 7 experiments (equation (2)). The temperature and relative humidity recorded for each experiment are also indicated in this figure.
(sum of the experiments)
The kinetic curves corresponding to each experiment present similar shapes. The remaining fraction first slightly fluctuates around the value of 100%, meaning that no resuspension occurs, which is confirmed by the films. The curves start to decrease sharply at a similar time of approximately 4.5 seconds. From about 6.5 seconds the slope is mitigated and the remaining fraction is almost stabilized from 10 to 12 seconds. The final remaining fractions observed for the seven trials are rather high: it is approximately 79% for the global remaining fraction that corresponds to the sum of the experiments; and the values obtained for each trial exhibit a significant deviation: they range from about 70% (trial N°1) to about 85% (trial N°3).
The high values of remaining fraction observed at the end of experiments, despite kinetics curves are almost stabilized for the last 2 to 4 seconds of trials, are in adequation with the results of Kassab et al. (2013). As an example, they reported remaining fractions ranging from 47 to 75% at the end of the 5 seconds experiments involving a duration of acceleration phase of 1 second and a steady state airflow ranging from 9 to 16 m.s-1, for glass particles (of 10-30 µm) deposited on a glass substrates. Braaten et al. (1990) stated that the particle removal phenomenon depicts the particle adhesion distribution. They assumed that particles with small adhesion forces that are firstly removed (in their case during the first few minutes of their 35 minutes experiments) reflect the mean energy level of the flow, and then particles with larger adhesion forces are removed by more energetic flow events which occur at random intervals. The distribution of the adhesion forces of the particles / surface system used for the experiments has not been characterized, but it may be influenced by one or several parameters. One can cite among them the particle size distribution, the topological properties, the chemical properties and the electrostatic charge of both the particles and the duct surface. The characterization of the adhesion force distribution could be carried out for example thanks to the Atomic Force Microscopy (AFM) colloidal probe technique like did recently Peillon et al. (2019). The flow energy level refers to the power associated to the turbulent eddies that develop intermittently on the duct surface. It is difficult to identify them directly and to quantify their power but they influence the characteristics of velocity fluctuations (intensity and frequency).
In the present case it is possible that experiments were not long enough to observe the highest energy levels of flow events, or that the highest energy levels associated with the mean airflow pattern at steady state are not powerful enough to exceed the highest adhesion forces.
The significant deviation observed between the remaining fractions obtained for the seven trials seems not to be explained by the air thermodynamic properties: the temperature was almost constant for all the experiments (23-24°C), and the relative humidity ranged between 30% (trials 1 and 2) and 36% (rest of the experiments).
But it is possible that the numbers of particles of the initial deposits involved in each trial separately (265 to 389 particles) were not important enough to depict the adhesion forces distribution related with the chosen particles/duct wall material system. That is why considering a global resuspension kinetics calculated on the basis of the total number of particles (2379) appears more statistically relevant. Secondly, despite the fact that the objective was to carry out experiments on the basis of monolayer deposits involving isolated particles, some clusters of particles were observed (see Figure 3), and led to some difficulties concerning the particles counting procedure. For some cases the water-shedding step involved in the image treatment procedure enabled to distinguish two particles involved in a cluster, but for some other cases two or more particles could have been counted as one. Such an error can be responsible for an underestimation of the initial number of particles, and thus to an overestimation of the remaining fraction. In order to estimate the error of the number of particle of the initial deposit associated with the image treatment procedure, the deviation between numbers of particle counted
manually and obtained from the image treatment procedure on the initial deposit pictures was calculated. The highest deviation is 12%, which is rather acceptable. When considering the scope of experimental investigations reported in the literature, only few authors provided uncertainty concerning the remaining fraction: Braaten et al. (1994) reported a counting error for the number of particles of 0.28%, Jiang et al. (2008) evaluated that the experimental error of their measurements was within 10%, Kassab et al. (2013) reported a particle counting error of 2±2%, and Barth et al. (2014) estimated that their remaining fraction uncertainty of approximately 10%. But those studies were conducted for initial deposits with particle concentrations lower than 5 part.mm-², whereas for the present work the concentration was 114±17 part.mm-2.
According to the aforementioned considerations the global resuspension kinetics calculated on the basis of the seven trials appears relevant to reflect the adhesion forces distribution for the wall/particles system considered, and is used for the following sections.
3.2.2. Modeling of the resuspension kinetics curve
In order to determine the time at which resuspension starts the global resuspension kinetics is modeled thanks to the following model, which consists in a decreasing exponential with a time delay: If t < t* : F./0(t) = F (8) If t ≥ t* : F./0(t) = F12+ 'F − F12). e67 8 ∗ 9 : (9)
Where F0 is the initial value of the remaining fraction (100%), Feq is the remaining fraction at the
end of the experiments (when stabilized), t* is the time at which the resuspension starts, and ; is the time constant of the decreasing exponential. The Feq value is determined by averaging the
remaining fraction from the last two seconds (35 values) and is 79%. The values of t* and ; are adjusted by minimizing the sum of the absolute deviations between experimental and modeled remaining fraction values. This parametric model has been chosen as it describes well the resuspension start while presenting the advantages to involve parameters which have a physical meaning.
The experimental global resuspension kinetics is compared to the model in Figure 9. This figure shows that the model fits well with the experimental data. The resuspension start t* and the time constant ; are of 4.7 seconds and 1.2 seconds respectively.
Figure 9: Comparison of the resuspension kinetics model to the experimental data
In the next section the resuspension kinetics is analyzed regarding the instantaneous properties of the air flow properties in the viscous sublayer.
3.3. Resuspension kinetics versus instantaneous wall velocity signal properties 3.3.1. Resuspension kinetics versus velocity evolution in the boundary layer
The resuspension kinetics is superimposed to the temporal evolution of the velocity in the viscous sublayer (wall dimensionless distance y+ of 6.4 at steady state) in Figure 10. This figure shows that the resuspension start (at 4.7 seconds) occurs during the fan acceleration. And as discussed in Section 3.2.1 the remaining fraction decrease is rather sharp for this section of the
curve. This phenomenon is in good agreement with the results of Braaten et al. (1990) and Kassab et al. (2013) who both pointed out the important fraction of particles released during the acceleration period.
Moreover, the Figure 10 shows that resuspension starts during the stage of acceleration with fluctuations of the velocity signal: it happens exactly 1.6 seconds after the emergence of the first eddies (at 3.1 seconds). The onset of turbulence itself thus does not seem to be responsible for the initiation of the phenomenon. That is why in the next section the resuspension kinetics is considered versus the temporal evolution of the turbulent kinetic energy in the viscous sublayer, in order to test the assumption that the particles with the lowest adhesion forces require a minimum threshold turbulent kinetic energy to be removed.
Figure 10: Temporal evolution of the remaining fraction and the velocity in the viscous sublayer (y = 280µm) 3.3.2. Resuspension kinetics versus turbulent kinetic energy
The temporal evolution of the turbulent kinetic energy TKE in the viscous sublayer is derived from the temporal evolution of the velocity signal presented in Figure 7. This airflow characteristic is calculated through the equation (10):
TKE =<=. ρ?@A. u&=. TI= (10)
Where TI is the Turbulent Intensity which is calculated thanks to the following equation:
TI =DEFGHDI (11)
In those last two equations J& and JKLMN are the mean velocity and the root mean square fluctuating velocity respectively. Those two velocity parameters are averaged on the basis of 500 velocity points which leads to mean TKE values representing time steps of 0.5 seconds.
Figure 11 depicts the temporal evolution of the velocity in the viscous sublayer and the associated turbulent kinetic energy. During the first stage of velocity increase, i.e. the acceleration stage without fluctuations (from 1.8 to 3.1 seconds), the TKE value is zero. It starts to increase when the first fluctuations appear, and reaches an asymptotic value of approximately 3230±270 J.m-3 at steady state for this wall distance of 280µm.
Figure 11: Temporal evolution of the velocity and the turbulent kinetic energy in the viscous sublayer (y = 280µm)
The temporal evolution of the turbulent kinetic energy in the viscous sublayer is superimposed to the resuspension kinetics in Figure 12. This figure shows that the resuspension phenomenon seems to start (at 4.7 seconds) when the TKE exceeds a given threshold value. Obviously it would be more suitable to quantify the TKE threshold value at a wall distance relevant with the particle sizes, i.e. deeper in the viscous sublayer. Nevertheless Figure 12 enables to estimate the threshold TKE range for the wall distance at which the velocity signal was recorded (280 µm) and it ranges between 1450 and 2750 J.m-3.
This threshold TKE value may depend on the adhesion force distribution of the particle/duct surface system, and especially on the lowest adhesion force value of this distribution, which depends on the particle size distribution, and on the topological properties, the chemical properties and the electrostatic charge of both the particles and the duct surface.
Figure 12: Temporal evolution of the remaining fraction and the turbulent kinetic energy in the viscous sublayer (y = 280µm)
An experimental methodology was developed to focus on the first instants of the resuspension phenomenon under airflow conditions mimicking realistic fan start conditions of ventilation systems: the acceleration stage followed by the first seconds of steady state. A special attention was paid to use relevant experimental acquisition frequencies to be able to track the velocity signal fluctuations as well as the resuspension kinetics fast evolutions. The velocity measurements were carried out simultaneously at two vertical distances to the wall: in the viscous sublayer to depict the orders of magnitudes of velocity and energy of flow events experienced by particles, and at the half duct height to be representative of the bulk airflow that is more easily accessible by classical velocimetry devices.
The experimental global particle resuspension kinetics was built on the basis of seven trials involving controlled microparticle concentrations to avoid as much as possible particle/particle interactions and to be statistically representative in terms of number of counted particles. A phenomenological relationship was fitted to this experimental resuspension kinetics in order to determine precisely the time at which resuspension starts.
The later characteristic time as well as the significant fraction of particles remaining on the duct wall in the end of experiments may reflect the adhesion forces distribution. In fact the resuspension phenomenon seems to be initiated by a threshold turbulent kinetic energy, i.e. microparticles exhibiting the lowest adhesion forces need turbulent events powerful enough to start being released. And for the considered particles properties/wall properties/aeraulic conditions, the most energetic flow events seen by microparticles during their time of exposure to the airflow were not energetic enough to remove particles having the highest adhesion forces. This study enables to broaden the conditions concerning the experimental data available in the literature of microparticles resuspension combining both resuspension kinetics and instantaneous velocity signal in the viscous sublayer. Such data could be useful to assess dynamic models dealing with resuspension under transient accelerated flows. The initiation of the resuspension phenomenon by a threshold turbulent kinetic energy should be confirmed thanks to more experimental data, i.e. on the basis of resuspension kinetics for different aeraulic conditions (mean velocity at steady state and mean acceleration), but the proposed experimental methodology enables to evaluate its order of magnitude at a wall distance representative of the viscous sublayer. The quantification of the threshold turbulent kinetic energy to be reached to initiate the resuspension phenomenon would require the recording of the temporal evolution of the velocity at wall distances relevant with particles size. It could also be interesting to compare this threshold turbulent kinetic energy to the energy associated with the adhesion forces distribution.
Acknowledgements
The authors would like to acknowledge the Ecka Granules Company for supplying the bronze particles, and the IMN Laboratory (Institut des Matériaux Jean Rouxel, Nantes, France) for the SEM analyses.
Nomenclature
Dp [m] Particle diameter
f [-] Flatness coefficient
faq [-] Acquisition frequency
F [-] Fraction of particles remaining in the duct wall
Feq [-] Fraction of particles remaining in the duct wall at
Equilibrium
Fmod [-] Modeled fraction of particles remaining in the duct wall
resuspension start
n [-] Number of particle remaining on the duct wall
RH [-] Relative humidity
Ra [m] Surface roughness
s [-] Skewness coefficient
t [s] Time
taq [s] Acquisition time
t* [s] Time at which resuspension starts
T [°C] Temperature
TI [-] Turbulent intensity
TKE [J.m-3] Turbulent kinetic energy
u [m.s-1] Velocity
u* [m.s-1] Friction velocity
u’rms [m.s-1] Root mean square of the turbulent velocity fluctuations
J& [m.s-1] Mean velocity
u+ [-] Dimensionless velocity
y [m] Vertical distance to the wall
y+ [-] Dimensionless vertical distance to the wall
Ufs [m.s
-1
] Free stream velocity
Umean [m.s-1] Mean velocity at steady state
Greek letters
O [m.s-2] Mean acceleration
δ [m] Viscous sublayer thickness
ρair [kg.m-3] Air density
ρp [kg.m
-3
] Particle density
σ [m] Standard deviation
; [s] Time constant in the resuspension kinetics
[m².s-1] Kinematic viscosity References
Barth T., Preuβ J., Müller G., Hampel U. (2014). Single particle resuspension experiments in
turbulent channel flows. J. Aerosol Sci., 71, 40-51.
https://doi.org/10.1016/j.jaerosci.2014.01.006.
Benito J.G., Valenzuela Aracena K.A., Unac R.O., Vidales A.M., Ippolito I. (2015). Monte Carlo modelling of particle resuspension on a flat surface. J. Aerosol Sci., 79, 126-139. https://doi.org/10.1016/j.jaerosci.2014.10.006.
Benito J.G., Unac R.O., Vidales A.M., Ippolito I. (2016). Validation of the Monte Carlo model for
resuspension phenomena. J. Aerosol Sci., 100, 26-37.
https://doi.org/10.1016/j.jaerosci.2016.05.008.
Benito J.G., Unac R.O., Vidales A.M., Ippolito I. (2018). Kinetic programmed resuspension – KPR technique. J. Aerosol Sci., 122, 21-31. https://doi.org/10.1016/j.jaerosci.2018.05.006. Boor B.E., Siegel J.A., Novoselac A. (2013). Monolayer and multilayer particle deposits on hard surfaces: literature review and implications for particle resuspension in the indoor environment.
Braaten D.A., Paw U K.T., Shaw R.H. (1990). Particle resuspension in a turbulent boundary layer – observed and modeled. J. Aerosol Sci., 21 (5), 613-628. https://doi.org/10.1016/0021-8502(90)90117-G.
Braaten D.A. (1994). Wind tunnel experiments of large particle reentrainment-deposition and development of large particle scaling parameters. Aerosol Sci. Technol., 21, 157-169. https://doi.org/10.1080/02786829408959705.
De Graaf D.B., Eaton J.K. (2000). Reynolds-number scaling of the flat-plate boundary layer. J.
Fluid Mech., 422, 319-346. https://doi.org/10.1017/S0022112000001713.
Guingo M., Minier J.P. (2008). A new model for the simulation of particle resuspension by turbulent flows based on a stochastic description of wall roughness and adhesion forces.
Aerosol Sci., 39, 957-973. https://doi.org/10.1016/j.jaerosci.2008.06.007.
Goldasteh I., Ahmadi G., Ferro A.R. (2013). Monte Carlo simulation of micron size spherical particle removal and resuspension from substrate under fluid flows. J. Aerosol Sci., 66, 62-71. https://doi.org/10.1016/j.jaerosci.2013.07.012.
Habchi C., Ghali K., Ghadar N. (2016). Coupling CFD and analytical modeling for investigation of monolayer particle resuspension by transient flows. Building and Env., 105, 1-12. https://doi.org/10.1016/j.buildenv.2016.05.025.
Henry C., Minier J.P. (2014a). Progress in particle resuspension from rough surfaces by
turbulent flows. Progress in Energy and Comb. Sci., 45, 1-53.
https://doi.org/10.1016/j.pecs.2014.06.001.
Henry C., Minier J.P. (2014b). A stochastic approach for the simulation of particle resuspension from rough substrates: Model and numerical implementation. J. Aerosol Sci., 77, 168-192. https://doi.org/10.1016/j.jaerosci.2014.08.005.
Hutchins N., Choi K.S. (2002). Accurate measurements of local skin friction coefficient using hot-wire anemometry. Progress in Aerospace Science, 38, 421-446. https://doi.org/10.1016/S0376-0421(02)00027-1.
Ibrahim A.H., Dunn P.F., Brach R.M. (2003). Microparticle detachment from surfaces exposed to turbulent air flow: controlled experiments and modeling. Aerosol Sci., 34, 765-782. https://doi.org/10.1016/S0021-8502(03)00031-4.
Ibrahim A.H., Dunn P.F., Brach R.M. (2004). Microparticle detachment from surfaces exposed to turbulent air flow: effects of flow and particle deposition characteristics. Aerosol Sci., 35, 805-821. https://doi.org/10.1016/j.jaerosci.2004.01.002.
Ibrahim A.H., Dunn P.F. (2006). Effects of temporal flow acceleration on the detachment of
microparticles from surfaces. Aerosol Sci., 37, 1258-1266.
https://doi.org/10.1016/j.jaerosci.2006.01.007.
Ibrahim A.H., Dunn P.F., Qazi M.F. (2008). Experiments and validation of a model for microparticle detachment from a surface by turbulent air flow. Aerosol Sci., 39, 645-656. https://doi.org/10.1016/j.jaerosci.2008.03.006.
Jiang Y., Matsusaka S., Masuda H., Qian Y. (2008). Characterizing the effect of substrate surface roughness on particle-wall interaction with the airflow method. Powder Technol., 186, 199-205. https://doi.org/10.1016/j.powtec.2007.11.041.
Kassab A.S., Ugaz V.M., King M.D., Hassan Y. (2013). High resolution study of micrometer
particle detachment of different surfaces. Sci. Technol., 47, 351-360.
https://doi.org/10.1080/02786826.2012.752789.
Keirsbulck L., Fourrié G., Labraga L., Gad-el-Hak M. (2012). Scaling of statistics in wall bounded turbulent flows. C. R. Mecanique, 340, 420-433. https://doi.org/10.1016/j.crme.2012.02.005. Kim Y., Gidwani A., Wyslouzil B.E., Sohn W.S. (2010). Source term models for fine particle
resuspension from indoor surfaces. Building and Env., 45, 1854-1865.
https://doi.org/10.1016/j.buildenv.2010.02.016
Orlu R., Fransson J.H.M., Alfredsson P.H. (2010). On near wall measurements of wall bounded flows - The necessity of an accurate determination of the wall position. Progress in Aerospace
Science, 46, 353-387. https://doi.org/10.1016/j.paerosci.2010.04.002.
Peillon S., Autricque A., Redolfi M., Stancu C., Gensdarmes F., Grisolia G., Pluchery O. (2019). Adhesion of tungsten particles on rough tungsten surfaces using Atomic Force Microscopy. J.
Aerosol Sci., 137, 105431. https://doi.org/10.1016/j.jaerosci.2019.105431.
Reeks M.W., Hall D. (2001). Kinetic models for particle resuspension in turbulent flows: theory and measurement. Aerosol Sci., 32, 1-31. https://doi.org/10.1016/S0021-8502(00)00063-X. Schlatter P., Örlü R., Li Q., Brethouwer G., Fransson J.H.M., Johansson A.V., Alfredsson P.H., Henningson D.S. (2009). Turbulent boundary layers up to Reθ = 2500 studied through simulation
and experimentation. Phys. Fluids, 21, 051702. https://doi.org/10.1063/1.3139294.
Stempniewicz M., Komen E., De With A. (2008). Model of particle resuspension in turbulent flows. Nuclear Eng. Des., 238, 2943-2959. https://doi.org/10.1016/j.nucengdes.2007.11.024. Wu W., Jin Y., Carlsten C. (2018). Inflammatory health effects of indoor and outdoor particulate matter. J. Allergy Clin. Immunol., 141 (3), 833-844. https://doi.org/10.1016/j.jaci.2017.12.981 You S., Wan M.P. (2014). A new turbulent burst-based model for particle resuspension from rough surfaces in turbulent flow. Aerosol Sci. and Technol., 48, 1031-1042. https://doi.org/10.1080/02786826.2014.955908.
You S., Wan M.P. (2017). Statistical analysis of fine particle resuspension from rough surfaces
by turbulent flows. Aerosol and Air Quality Res., 17, 843-856.
https://doi.org/10.4209/aaqr.2016.03.0106.
Zanoun E.S., Durst F., Shi J.M. (2009). The physics of heat transfer from hot wires in the proximity of walls of different materials. International Journal of Heat and Mass Transfer, 52, 3693-3705. https://doi.org/10.1016/j.ijheatmasstransfer.2009.01.048.
Zhang F., Reeks M., Kissane M. (2013). Particle resuspension in turbulent boundary layers and the influence of non-gaussian removal forces. J. Aerosol Sci., 58, 103-128.
https://doi.org/10.1016/j.jaerosci.2012.11.009.
Ziskind G., Fichman M., Gutfinger C. (1995). Resuspension of particles from surfaces to turbulent flows – review and analysis. J. Aerosol Sci., 26, 613-644. https://doi.org/10.1016/0021-8502(94)00139-P.
Vitaes
Félicie Théron is Associate Professor in Process Engineering at IMT Atlantique, GEPEA
Laboratory. Her research is focused on interactions between air flow in ventilated ducts and microparticles resuspension from duct walls or particle collection by fibrous filters. She is co-author of 9 publications in peer review journals.
Dr. Djihad Debba got his Ph.D. in Process Engineering at IMT Atlantique in 2017. He
studied the mechanisms involved in the resuspension of particles in ventilated duct by using an experimental methodology and taking into account the acceleration of the air flow which always precedes steady state.
Laurence Le Coq is Professor in Process Engineering at IMT Atlantique, GEPEA Laboratory.
Her research is focused on flow and mass transfer in porous media, with or without reactions. She also works on flow and particle transport at solid / fluid interfaces and in porous media. She is co-author of 55 publications in peer review journals, and more than 70 communications in international congress. Her H index is 16.
Experimental method developed to investigate microparticles resuspension. > Velocity signals exhibit two stages during the fan acceleration. > Global resuspension kinetics modeled by a decreasing exponential. > The resuspension phenomenon starts during the acceleration with fluctuations stage. > A threshold turbulent kinetic energy value is responsible for the resuspension start.