HAL Id: hal-02901563
https://hal.archives-ouvertes.fr/hal-02901563
Submitted on 17 Jul 2020
HAL is a multi-disciplinary open access
archive for the deposit and dissemination of
sci-entific research documents, whether they are
pub-lished or not. The documents may come from
teaching and research institutions in France or
abroad, or from public or private research centers.
L’archive ouverte pluridisciplinaire HAL, est
destinée au dépôt et à la diffusion de documents
scientifiques de niveau recherche, publiés ou non,
émanant des établissements d’enseignement et de
recherche français ou étrangers, des laboratoires
publics ou privés.
Worldwide multitemporal change detection using
Sentinel-1 images
Elise Koeniguer, Jean-Marie Nicolas, Fabrice Janez
To cite this version:
Elise Koeniguer, Jean-Marie Nicolas, Fabrice Janez. Worldwide multitemporal change detection using
Sentinel-1 images. BIDS - Conference on Big Data from Space, Feb 2019, MUNICH, Germany.
�hal-02901563�
WORLDWIDE MULTITEMPORAL CHANGE DETECTION USING SENTINEL-1 IMAGES
Elise Colin Koeniguer
(1), Jean-marie Nicolas
(2), Fabrice Janez
(1)(1) Onera, Chemin de la Huni`ere, 91123 PALAISEAU
(2) Telecom ParisTech
ABSTRACT
This paper discusses the visualization and detection of changes on Sentinel-1 images. The potentials of our change visualiza-tion algorithm REACTIV implemented on the Google Earth Engine platform are shown through many examples. A de-tection method is proposed and evaluated thanks to a Ground Truth performed in Palaiseau (France). The method demon-strates excellent performance compared to more traditional algorithms accumulating several bi-date tests.
Index Terms— multitemporal change detection, SAR, Google Earth Engine, visualization
1. INTRODUCTION
Since the launch of Copernicus data in open source, the plat-form services based on Earth observation are multiplying. Among the opportunities offered, the exploitation of time series enables monitoring of the entire globe, whether for en-vironmental, civil, industrial, defense or surveillance needs. While optical images are in widespread use, SAR images are less often exploited because of the inherent speckle noise and the difficulty of interpretation. However, for the temporal monitoring, SAR images provides clear benefits: availability whatever the weather conditions, and temporal stability due to the use of an active sensor.
For these reasons, this article considers Sentinel-1 images to visualize and detect changes or activities. In section 1, we present the visualization method REACTIV (Rapid and EAsy Change detection in radar TIme-series by Variation coeffi-cient). Several examples of applications are shown in Section 2. Then, we propose a detection scheme in section 3. Be-cause the temporal behaviors describing events are varied, we will also propose to go towards the classification of different generic changes. The validation of this algorithm is ensured on a local study site for which a precise ground truth has been established. Finally, we will consider in section 4 the detec-tion of a new event occurring in the last available acquired image, before concluding. To demonstrate our approaches, the Google Earth Engine (GEE) platform was chosen for its ease of use and its capability to test at a global scale [2].
This study is part of the Research Project MEDUSA, founded by Onera (w3.onera.fr/medusa)
2. VISUALIZATION AT A GLANCE 2.1. General Principle
It is now easy to obtain a hundred Sentinel-1 images over time for any location on the globe. Though we can visualize them as a video movie, this analysis is long and tedious. For this reason, we have developed a visualization method called RE-ACTIV which gives a colorful visualization at a glance of all areas that have undergone changes [1]. In this representation, a bright color indicates a change, and the assigned color cor-responds to a particular date.
In practice, some areas belongs to different orbits. The variations of incidence, of the order of a dozen degrees, can generate variations of radiometry or projections. To avoid confusion with any change, we restrict to images from a sin-gle orbit.
2.2. Theoretical key points
REACTIV visualization goes through the use of the Hue Sat-uration Value(HSV) color space. The value is encoded by the maximum intensity signal. Saturation, is encoded by the tem-poral variation coefficient, the key parameter. Finally, the hue is given by the date for which signal intensity is maximum.
The behaviour is the following one. A change in images will induce a high saturation value and so a bright color in the visualization product. On the contrary, a lack of change will result in a totally reduced color and therefore in just a gray value.
The properties of the speckle coefficient of variation [4] largely explain the success of this visualization . These prop-erties have been justified and described in detail in [3]. They were used in particular to automatically set the algorithm.
We synthesize them now. Among the behaviors of all ar-eas that can be described as stable or unchanged, there are either decorrelated areas of speckle that follow a Nakagami law, or areas with a deterministic component, which follow a Rice law.
In the first case (Nakagami Distribution), for a stable decorrelated speckle area, the average amplitude value does not undergo a variation over time. The temporal amplitude distribution is the same as the spatial distribution; it is pa-rameterized by a scale parameter µ, which depends on the
Fig. 1. Maritime roads are clearly visible on this REACTIV visualization
average backscattering of the zone, and a shape parameter L, which corresponds to the Equivalent Number of Looks. These speckle realizations are decorrelated over time. In practice, all areas of forest or bare soil encountered most often satisfy this assumption, even if they are in interferometric conditions, because any small centimetric displacement cause decorrela-tion.
The second case (Rice distribution) corresponds either to a Permanent Scatterer, for which a very strong backscat-tering return dominates the signal in the resolution cell, or to natural areas that can be considered as stable correlated speckle area, with exceptional immobility, for example the Atacama desert in Chile, a non sandy desert.
For stable decorrelated speckle areas, the theoretical av-erage coefficient of variation can be expressed only in terms of L, and its variance in terms of L and N , the number of images in the stack. It is proportional to 1/N : the larger the image number, the more precisely the coefficient of variation is estimated.
For stable correlated speckle areas, the theoretical average coefficient of variation is lower than in the previous case. It depends only on µc/µ, the ratio between the deterministic
component amplitude µc, and the speckle shape parameter µ.
For both these reference stable cases, the inclusion of a deterministic target immediately introduces an increase of the theoretical value of the coefficient of variation. If the rupture occurs in a stable decorrelated speckle area, the gap depends only on µr/µ, the ratio between the amplitude µrof a
point-event, and the speckle shape parameter µ.
Although literal expressions can not be derived in all change cases, simulations of several scenarios have been un-dertaken: mixture of two speckles, inclusion of a persistent event, etc. All these scenarios result in a coefficient of varia-tion higher than that of an uncorrelated speckle law, and thus allow to consider it for a successful detection.
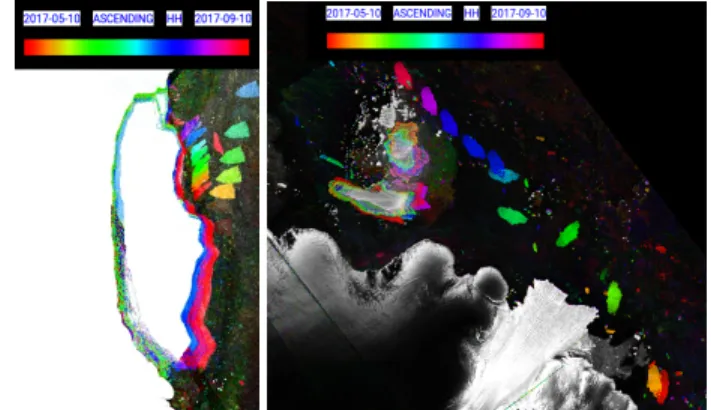
Fig. 2. REACTIV confirms calving from the Larsen C ice shelf and reveals displacements of smaller icebergs
Fig. 3. REACTIV highlights Oktoberfest, held annually in Munich, Bavaria, Germany
2.3. Applications
The implementation of REACTIV on Google Earth Engine platform has made it possible to highlight a large number of opportunities offered by the proposed visualization. For ex-ample on Fig.1, it allows the immediate visualization of the boats. Furthermore, these results are obtained very quickly because of a purely temporal processing and not a spatial one. On GEE, it is near real time. On a large scale, we can also see the waiting areas as well as the maritime roads.
Fig.2shows the fracture in July 2017 of an iceberg of the Larsen glacier in Antarctica and its progression. The acceler-ation and rotacceler-ation of the glacier appears from summer 2018.
Another application is in urban areas. In general, visual-ization can give an idea of the frequency of changes. In the ex-ample of Fig.3, some changes in Munich are particularly vis-ible. In particular, near the Congress Center indicated by the red mark, there is Theresenwiese, an open space of 420,000 square metres in the Munich borough of Ludwigsvorstadt-Isarvorstadt. It serves as the official ground of the Munich Oktoberfest. In our REACTIV product, the event is clearly visible with the yellow color associated to October month.
However, any visualization tool has its limits, and one may wish to have an automatic detection tool.
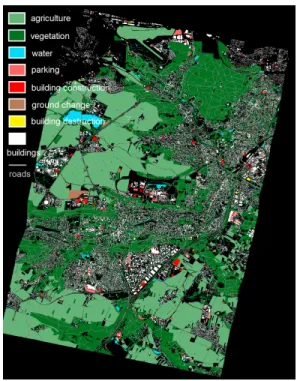
Fig. 4. Ground truth established on a test site around Palaiseau, France
3. CHANGE DETECTION IN TIME-SERIES The properties of the coefficient of variation led us to propose a change detection algorithm based on the simple threshold-ing of this one. A qualitative analysis showed us that some changes sign in VH polarization while others only sign in VV polarization. For this reason, we use the maximum criterion between VH and VV coefficient of variation as a decision cri-terion. An averaging of the criterion map is done prior the thresholding, using a NL-mean filtering method. This is the only inclusion of the spatial dimension.
Quantitative performances were evaluated on the Saclay region (near Paris), for which a precise Ground Truth Database has been established. This latter was first generated by mak-ing the difference between two vector databases (a BDTOPO base of the IGN, an OSM database) at dates before and after the observed time range, between june 2015 and june 2017.
The considered area is about 15 km x 12 km and it is a particularly interesting site because it includes high density urban areas.
Then, all the changes found were manually validated or rebutted using optical archival images. The resulted ground truth in the Fig.4shows in red all the constructions / destruc-tions. It also shows the parking areas, agricultural plots, water surfaces.
The ROC detection curve thus obtained on this test site is presented in the Fig. 5. It is compared to a more classical method where the intensity ratio is accumulated with respect to a reference date and where the criterion map is filtered by
Fig. 5. Receiver Operating Characteristic curve for com-paring ability of our method compared to a conventional ap-proach to detect construction sites.
NL mean like our method. This comparison shows that RE-ACTIV method has a huge gain in terms of detection. More-over, the method seems to be robust to a variety of different changes: some of them illustrated in Fig.6are different from VV and VH, and difficult to distinguish from natural changes over agricultural crops.
Fig. 6. Different types of time-profiles over changes This detection method has been implemented under Google Earth Engine. One example of result is illustrated in the figure7for Paris in 2018. We have made the layer of pixels detected in red overlay on the optical image layer. Boat activity on the Seine can be seen, as well as the Invalides and Champ de Mars area, regularly subject to temporary
installa-Fig. 7. Change detection in Paris over an optical map
tions. In practice, most detection failures are due to two main reasons:
• High sensitivity of the response of an agricultural area. Depending on weather conditions, it is likely that the electromagnetic mechanisms and therefore the backscatter levels vary greatly from one date to another. • So-called ”point” events, which appear only on one date, and which do not appear in our Ground Truth. In practice, we have been able to verify that they actually correspond to zones of only a few pixels, for which we do not know exactly the origin of the rupture in the temporal profile.
4. DETECTION OF A NEW EVENT
For these latter behaviors, we propose to calculate the ratio of the coefficients of variation calculated with and without the maximal amplitude:
Risolated=
CV (A(k)k∈{1...N }\{k
Amax})
CV (A(k)k∈1...N)
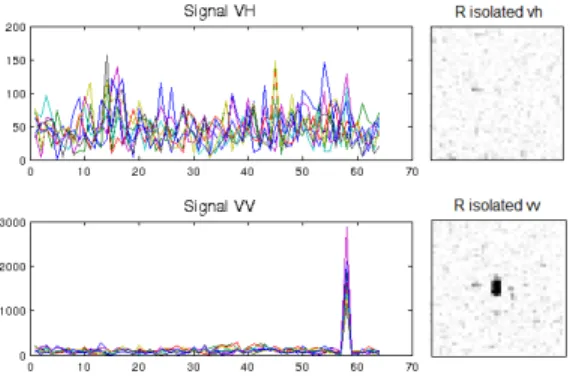
A threshold on this criterion detects in a very robust man-ner a certain number temporal profiles containing a rupture on a single date. Results are most often different for VV or VH polarization, and spatially isolated. As an example, Fig.
8shows an event detected in the area of Palaiseau (France), as well as the profile of amplitude associated, which reveals a sharp increase of the signal, without any associated explana-tion.
Detecting an event arriving on the last image of a stack, is a special case of isolated event detection. It can be performed by a threshold on:
Ralert=
CV (A(k)k∈{1...N }) CV (A(k)k∈1...N −1)
This parameter has been implemented on the GEE platform. The set of plots detected and whose profiles have been man-ually checked, correspond to an event of this type, except for certain points that can be considered as artifacts: they are points for which the amplitude profile is saturated. This is
Fig. 8. A point-event detected in South of Paris.
one of the drawback of the platform GEE that discards ex-treme values in images. In the future, using the data without changing the dynamics should avoid these artifacts.
5. CONCLUSION
In this paper, change visualization and detection methods have been proposed, using Sentinel-1 time series. The de-tected activities are varied: building construction/destruction, festive events, agriculture, vehicles, movements of icebergs, etc. The methods are based on the temporal coefficient of variation. Statistics properties of this criterion have made it a key parameter for deploying robust and extremely fast change detection strategies. The proposed methods have been demonstrated globally through the use of the Google Earth Engine platform. In perspective, we have proposed a method to detect a new break in any new acquired image.
REFERENCES
[1] E. Colin-Koeniguer, A. Boulch, P. Trouve-Peloux, and F. Janez. Colored visualization of multitemporal sar data for change de-tection: issues and methods. In EUSAR 2018; 12th Euro-pean Conference on Synthetic Aperture Radar, pages 1–4. VDE, 2018.
[2] N. Gorelick, M. Hancher, M. Dixon, S. Ilyushchenko, D. Thau, and R. Moore. Google Earth Engine: Planetary-scale geospatial analysis for everyone. Remote Sensing of Environment, 202:18– 27, 2017.
[3] E Koeniguer, JM Nicolas, B Pinel-Puyssegur, JM Lagrange, and F Janez. Visualisation des changements sur s´eries temporelles radar: m´ethode REACTIV ´evalu´ee `a l´echelle mondiale sous Google Earth Engine.
[4] JM Nicolas. Application de la transform´ee de Mellin: ´etude des lois statistiques de l’imagerie coh´erente. Rapport de recherche, 2006D010, 2006.