Urban Change Detection for Multispectral Earth Observation Using Convolutional Neural Networks
Texte intégral
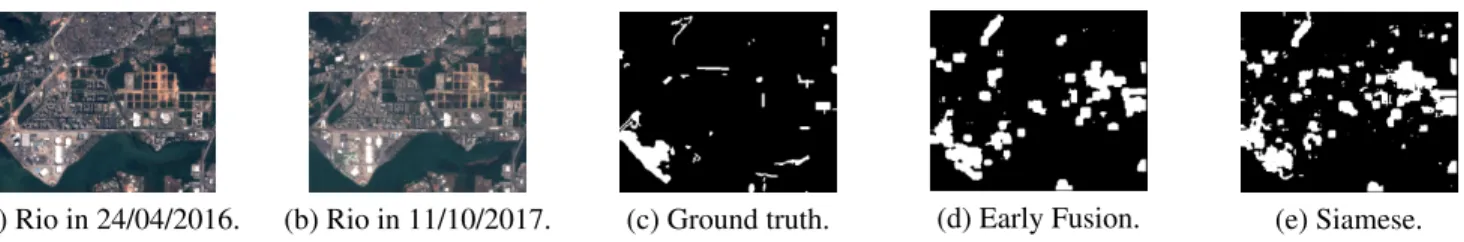
Figure

Documents relatifs
Abdelmalek Amine, GeCoDe Laboratory, Department of Computer Science, Tahar Moulay University of Saida, Algeria Zakaria Elberrichi, Djllali Liabes University of SidiBelAbbes,
This article presents a method to easily train a deep convolutional neural network architecture using transfer learning, with application to the insect image recog- nition problem..
Modern signal processing techniques previously used in the field of speech recognition have also made significant progress in the field of automatic detection of abnormal voice..
This paper represents the model for image captioning based on adversarial training process using hybrid convolutional fuzzy neural networks.. Adversarial training for automatic
This work presents the use of convolutional neural networks for the task of classifying hemorrhage vs non-hemorrhage, 491 studies of computed tomography of the head without
We pro- pose cross training method in which a CNN for each in- dependent modality (Intensity, Depth, Flow) is trained and validated on different modalities, in contrast to
In 2012, we introduced the changedetection.net (CDnet) benchmark, a video dataset devoted to the evalaution of change and motion detection approaches.. Here, we present the
This article presents a method to easily train a deep convolutional neural network architecture using transfer learning, with application to the insect image recog- nition problem..
