DISTRIBUTION OF TEMPERATURE AND SALINITY IN THE CANADIAN ARCTIC ARCHIPELAGO DURING THE 2005 ARCTICNET SAMPLING
EXPEDITION
(FROM AUGUST 5TH TO OCTOBER 27TH 2005)
By
Annie Simard1, Marie-Emmanuelle Rail1 and Yves Gratton1
1
INRS-Eau, Terre et Environnement 490, de la Couronne
Québec, Qc Canada, G1K 9A9
2010, INRS-Eau, terre et environnement
CORRECT CITATION FOR THIS PUBLICATION :
Simard, A., M.E. Rail and Y. Gratton. 2010. Distribution of temperature and salinity in the Canadian Arctic Archipelago during the 2005 ARCTICNET sampling expedition (from August 5th to October 27th 2005). Report No R1126,
ABSTRACT
This report presents the CTD (Conductivity, Temperature and Depth) data obtained during the 2005 ArcticNet expedition held between August 5th and October 27th in the Canadian High Arctic. The report also contains information about data obtained by the Moving Vessel Profiler (MVP), Self Contained Autonomous Micro Profiler (SCAMP), moorings and ship mounted Acoustic Doppler Current Profiler (SM-ADCP) which were recorded during the same expedition. Detailed maps of sampling sites for each arctic region are included. CTD’s temperature and salinity data are presented as contour plots following West-East or South-North sections. Examples of ADCP and SCAMP data are also included.
RÉSUMÉ
Ce rapport présente les données de CTD (conductivité, température et profondeur) recueillies au cours de la mission ArcticNet 2005 qui s’est déroulée dans l’Arctique canadien du 5 août au 27 octobre 2005. Il présente également de l’information sur les données de Moving Vessel Profiler (MVP), Self Contained Autonomous Micro Profiler (SCAMP), Acoustic Doppler Current Profiler (ADCP) de coque et des données de mouillage enregistrées au cours de la même mission. Des cartes détaillées montrant les sites d’échantillonnage pour chacune des régions arctiques y sont incluses. Les données de température et de salinité du CTD y sont illustrées sous forme de contours effectués le long de sections ouest-est ou sud-nord. Deux exemples des données enregistrées par le SCAMP et un ADCP sont présentés.
ABSTRACT………...…... iii TABLE OF CONTENTS………..…… iv LIST OF FIGURES………..… v LIST OF TABLES………...…. v LIST OF APPENDICES………... v FOREWORD……….... vi 1. INTRODUCTION………..… 1 2. SAMPLING PROGRAM………... 3 ROSETTE………. 3
MOVING VESSEL PROFILER (mvp) ………... 4
SELF CONTAINED AUTONOMOUS MICRO PROFILER (scamp)……... 4
MOORINGS………. 5
SHIP MOUNTED ACOUSTIC DOPPLER CURRENT PROFILER (adcp).. 6
3. DATA PROCESSING AND QUALITY CONTROL……… 8
ROSETTE-CTD DATA……… 8
MOORINGS DATA………. 8
MOORED ADCP DATA………. 8
4. DISCUSSION………...……….. 9
5. ACKNOWLEDGMENTS……….. 10
6. REFERENCES………... 10
TABLES...……… 12
LIST OF FIGURES
FIGURE 1 ArcticNet study area in 2005………. 1
FIGURE 2 Rosette sampling sites……… 3
FIGURE 3 SCAMP sampling sites..……… 5
FIGURE 4 Moorings locations (2004-2005) …………..……… 6
FIGURE 5 Moorings locations (2005-2006) ………..…… 6
FIGURE 6 Moored-ADCP and ship-mounted ADCP sampling sites ………… 7
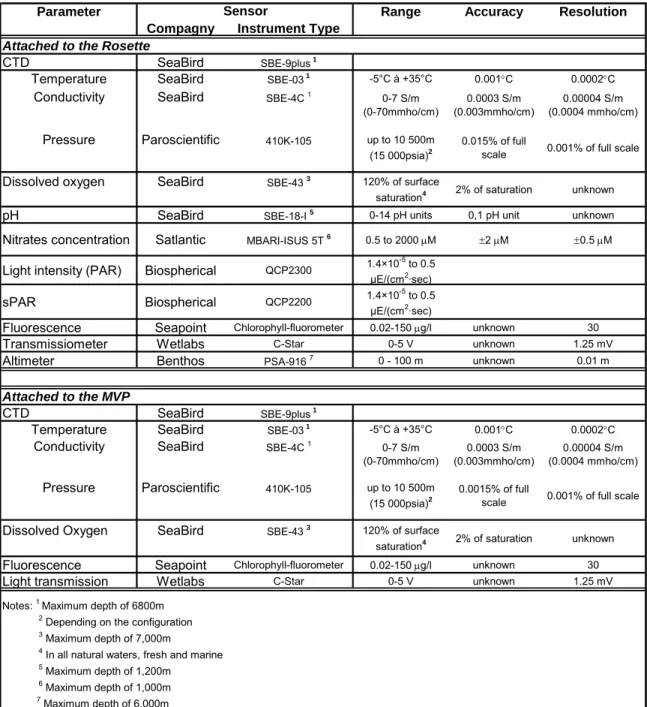
LIST OF TABLES TABLE 1 Rosette and MVP sensor specifications……….………... 12
TABLE 2 Summary of Rosette sampling………... 12
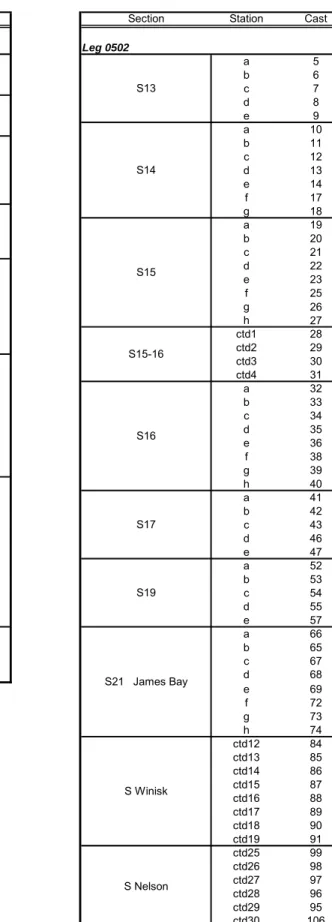
TABLE 3 List of Rosette sections and casts……….. 13
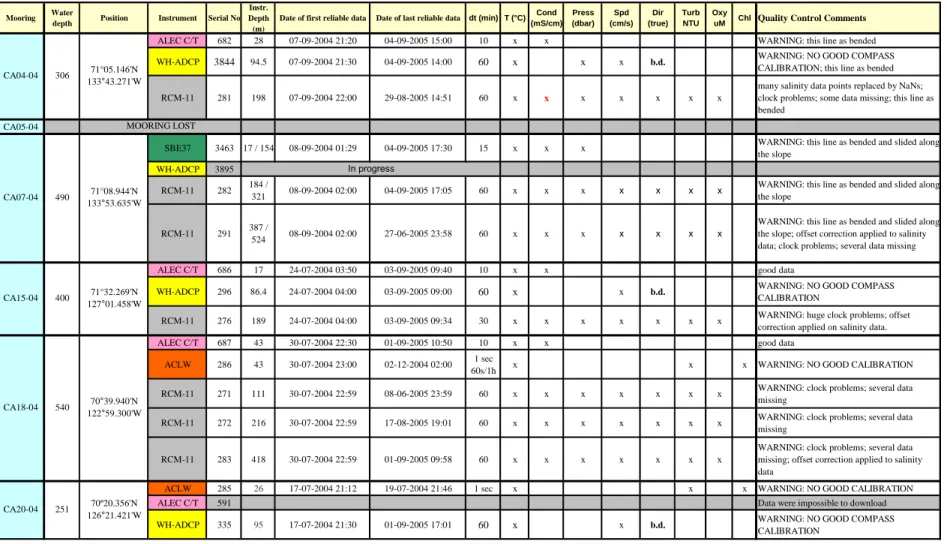
TABLE 4 Summary of moored instruments 2004-2005……… 14
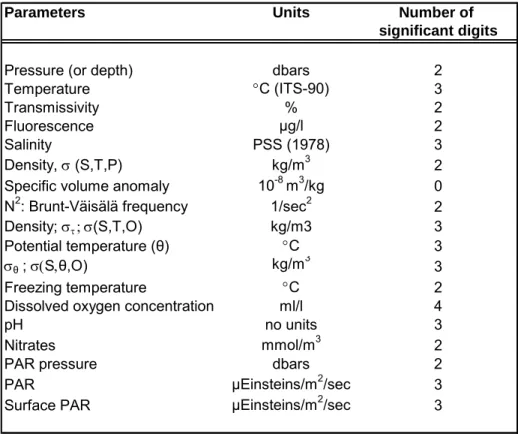
TABLE 5 Content of the ASCII Rosette-CTD data files………... 15
LIST OF APPENDICES APPENDIX 1 Higher resolution maps of Arctic areas where Rosette-CTD, SCAMP and moorings data were collected………...… 16
APPENDIX 2 Rosette-CTD data logbook………..….. 23
APPENDIX 3 SCAMP data logbook……… 31
APPENDIX 4 SCAMP data example………... 36
APPENDIX 5 Plots of salinity and potential temperature, Leg 1……….… 39
APPENDIX 6 Plots of salinity and potential temperature, Leg 2……….…… 57
The Canadian Network of Centres of Excellence (NCE) is a unique joint program that brings together several universities, government agencies, industrial companies and non-profit organizations. Their mission is to increase Canada’s economy and social benefits through research and entrepreneurial programs. Three Canadian federal granting agencies the Canadian Institutes for Health Research (CIHR), the Natural Sciences and Engineering Research Council of Canada (NSERC) and the Social Sciences and Humanities Research Council of Canada (SSHRC) and Industry Canada, have combined their efforts to financially support and oversee the initiatives of the NCE. (NCE web site at http://www.nce.gc.ca)
ArcticNet is one of the NCE networks and brings together scientists and managers in the natural, environmental, social sciences and human health. Several Inuit organizations, northern communities, as well as government and industrial agencies have joined ArcticNet in their mission. More than 100 ArcticNet researchers and students from 28 Canadian universities and 5 Federal departments collaborate on 27 research projects with teams from U.S.A., Japan, Denmark, Norway, Poland, the U.K., Spain, Russia, Greenland and France.
The ArcticNet Network investigators study the impacts of climate change in Canadian Arctic to assess the effect of ongoing warming and modernization on Canadian Arctic ecosystems, economies and societies, and help Canadians face the impacts and opportunities that may occur due to climate change in the Arctic. ArcticNet’s structure is set to translate the growing understanding of the changing Arctic ecosystem into national policies, adaptation strategies and impact assessment studies conducted on societies and marine / terrestrial coastal ecosystems in the Canadian High Arctic, the Eastern Arctic, Hudson Bay and Eastern Sub Arctic. (Please see the ArcticNet Annual Report 2004-2005 for more information). (ArcticNet web site at http://www.arcticnet.ulaval.ca)
1. INTRODUCTION
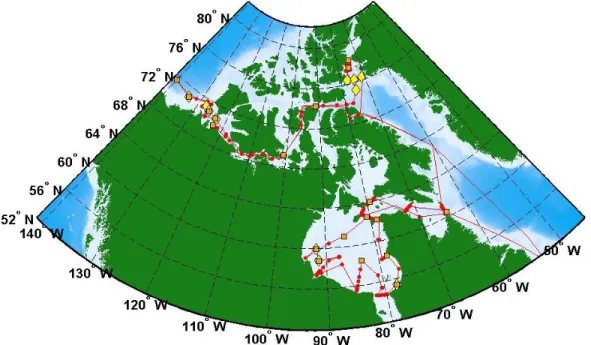
ArcticNet’s 2005 expedition was carried out from August 5th to October 27th. During the first six weeks (leg 1 or 0501), the ship covered the coastal Canadian Arctic (Fig. 1) from Beaufort Sea in the West to the coast of Greenland in the East. On September 15th, it sailed to Hudson Bay where the second sampling part (leg 2 or 0502) took place.
FIGURE 1. ArcticNet 2005 study area. Ship track is illustrated as a red line, Rosette-CTD sampling locations are represented by red dots. Yellow diamond-shaped dots show mooring sites while SCAMP sampling stations are represented by orange squares.
This report provides the ArcticNet community with a synthesis of the available data recorded during this 3-month expedition. The data set includes 263 Rosette-CTD (Conductivity Temperature Depth profiler), 91 MVP (Moving Vessel Profiler) and 86 SCAMP (Self Contained Autonomous Profiler) profiles. Also included are information about the 2004-2005 data recorded by 18 different instruments attached to five (recuperated) mooring lines, and current data recorded along the ship track by a ship mounted ADCP (Acoustic Doppler Current Profiler).
Related Studies
Several published studies and scientific papers have reported on the physical oceanographic processes in the Canadian Arctic. Extensive CTD profiles were collected in the polynyas of the North Water (NOW) in northern Baffin Bay. Gratton et al. (2006) presents the NOW program data in their report and two special issues have been
(2005) have recently carried out an extensive study on the Hudson Bay region. The oceanography of the Northwest Passage was the subject of a chapter in a special issue of «The Sea» (volume 14, part B, 2005). In this paper, McLaughlin et al. presented their comprehensive study of all the oceanographic aspects and processes encountered in the Northwest Passage and explain in details the physical and chemical oceanography of this area. The Beaufort Sea and Amundsen Gulf are the Canadian Arctic regions that have been studied the most extensively over the years, especially during the Canadian Arctic Shelf Exchange Study (CASES) program and subsequently during ArcticNet expeditions and later on this year during various projects involved with the Circumpolar Flaw Lead System Study (CFL) and the International Polar Year (IPY) programs. All the publications regarding the CASES projects can be found on the CASES website (at
http://www.cases.quebec-ocean.ulacal.ca). In 2008, the Journal of Geophysical Research
published eleven papers from the CASES program in a special issue, volume 113, number C3. The same year, a book containing a synthesis of the work performed in every main research subject of the program was edited by L. Fortier, D. Barber and J. Michaud. It was titled : On thin Ice. Simard et al. (2008) have also prepared a synthesis report regarding the CTD profiles and other physics data generated during the CASES 2002-2004 expeditions. The oceanography of the Beaufort Sea was also discussed by Ingram et
2. SAMPLING PROGRAM
Rosette
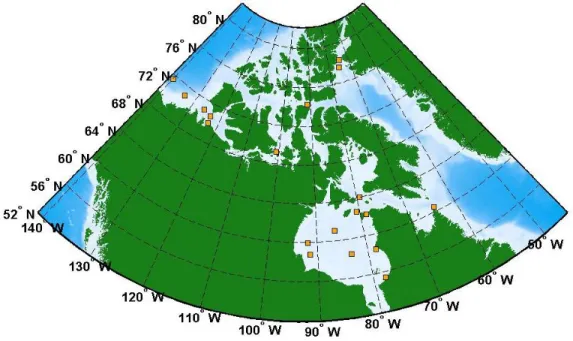
During the 2005 expedition, the rosette was equipped with 24 «Niskin» 12 L bottles, a CTD SeaBird 911+ and eight independent sensors (see Table 1 for sensors specifications). It was deployed from the ship and lowered into the water column at a rate of 1 m s-1. CTD profiles were carried out in the Canadian Arctic and Hudson Bay (see Fig. 2 and Appendix 1A) along 8 sections, 80 stations and 137 casts during Leg 0501 and 10 sections, 90 stations and 126 casts during Leg 0502 (see Table 2 and Table 3). A summary and the «Logbook» of the CTD profiles available for all stations are presented in Appendix 2 and in Rail (2005a and 2005b) sampling reports. Appendix 2 also presents the «Logbook» of the 29 CTD profiles performed in 2004 during the first ArcticNet mooring deployment expedition (Leg 0408) on the CCGS Laurier.
FIGURE 2. 2005 Rosette sampling sites
The processing and quality control of CTD data are presented in section 3 of this report. As a general «rule of thumb» CTD data are reserved for the ArcticNet Network Investigators for a period of 3 years. After this period, data will be hosted on the Integrated Service Data Management (ISDM) website (
http://www.meds-sdmm.dfo-mpo.gc.ca/) and will be available to the international community. All the meta-data may
The Moving Vehicle Profiler (MVP) is a towed CTD (with fluorescence and dissolved oxygen sensors). It is usually used in automatic mode. The “fish” (right) freefalls at ~ 5 m s-1 and is automatically winched back to 10 m under the surface after each cast. We lose the first 10 and last 10 meters of the water column. It is a MVP300-1700 model, meaning that it is equipped with 1700 m of cable and can profile down to 300 m at 12 knots. The slower the cruising speed the deeper the MVP can reach.
Few 2005 MVP profiles could be reported because the instrument was lost in Labrador Sea during Leg 0501 (August 9 to August 11). Ninety-one casts of 300 m were performed in the eastern part of the Hudson Strait around 60oN and 60oW at a rate of one cast every 30 minutes. See Table 1 for sensors specifications. Raw data are available upon request.
Self Contained Autonomous Micro Profiler (SCAMP)
The SCAMP is a CTD-type profiler. It samples at a frequency of 100 Hz (i.e. 100 times per second). It free falls at approximately 10 cm s-1, resulting in a vertical resolution of approximately one (1) millimetre, down to a maximum depth of 100 m. The instrument measures the temperature and salinity fluctuations at the micro-scale in order to estimate the turbulent mixing occurring in the water column. To properly measure (as opposed to “estimate”) turbulence we should also be measuring the velocity fluctuations. Unfortunately, we do not have velocity sensors (due to budget limitations). The current sensors on the SCAMP include temperature (three sensors), salinity (i.e. conductivity; two sensors), a PAR (Photosynthetically Active Radiation) and fluorescence.
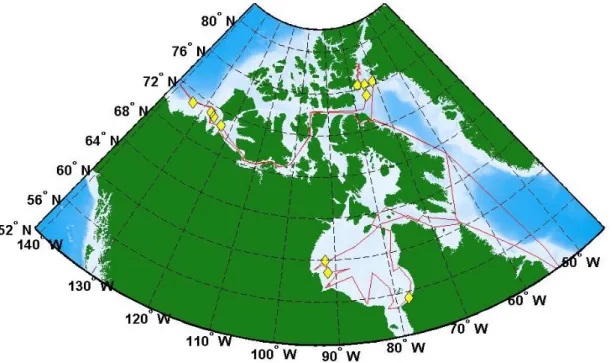
SCAMP profiles were carried out in Baffin Bay, Victoria Strait, Beaufort Sea and Amundsen Gulf, Foxe Basin, Hudson Strait and Hudson Bay (see Fig. 3 and Appendix 1B). Measurements were taken at 10 stations (46 casts) during leg 0501 and 11 stations (40 casts) during leg 0502 for a total of 86 different profiles. The logbook of SCAMP
profiles is presented in Appendix 3. An example of data profile is presented in Appendix 4. Scamp data are not available yet. When available, processing and quality control protocols will be provided at the same time as the scamp data.
FIGURE 3. SCAMP sampling sites
Moorings
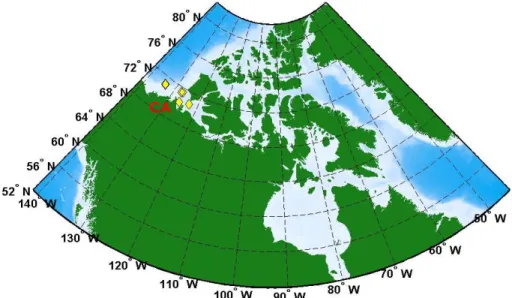
Five moorings deployed in the Beaufort Sea in 2004 were successfully retrieved in August and September of the 2005 expedition (see Fig. 4 and Appendix 1C). A summary of the 18 instruments, the sensors, and the validated data is shown in Table 4. The instruments included four RDI 300 kHz Workhorse ADCPs, seven Aanderaa RCM-11 (Recording Current Meters), one Sea-Bird SBE-37 conductivity-temperature sensor, four Alec conductivity-temperature sensors and two Alec chlorophyll sensors. The data recovery was only partly successful due to instrument malfunctions and one mooring was never recovered (CA05-04). Michaud et al. (2005) and Rail et al. (2010) have summarized all the problems encountered in their technical report. The recovered moorings were processed and redeployed for another year of measurements. Additional moorings were added to cover the Beaufort Sea, Baffin Bay and Hudson Bay (see Fig. 5 and Appendix 1C). ArcticNet moorings are identified according to the following guidelines: the letters and the first two digits represented the location (CA: Beaufort Sea; BA: Baffin Bay and AN: Hudson Bay); the last two digits are the deployment year.
CA
FIGURE 4. Moorings deployed in 2004 and recovered in 2005
BA
CA
AN
FIGURE 5. Moorings deployed in 2005
Ship mounted Acoustic Doppler Current Profiler (ADCP)
In July 2003, the CCGS Amundsen was equipped with a RDI Ocean Surveyor (ship-mounted) 150 kHz ADCP. Unfortunately, the instrument had a defect and although the flaw was quickly detected, there was nothing we could do to correct the problem until the next dry dock scheduled for April 2006. Regardless, we continue to collect data with the ADCP throughout the 2005 expedition (see ship track on Fig 6). The data set was saved as it may be possible to correct them at a later time. Note that the raw data is available upon request.
FIGURE 6. Moored-ADCP deployed in 2005 and ship-mounted ADCP sampling sites. The moored-ADCP stations are illustrated by yellow diamond markers and the ship-mounted ADCP is illustrated by the ship track.
Rosette-CTD data
Rosette-CTD data processing and quality control are described in detail by Guillot (2003, 2005a and 2005b). The «READ ME » file attached to each yearly CTD data set also presents the most important processing steps and changes made to the data files. All users should read these files so they can be aware of data limitations.
Processing included the following steps: calibration of coefficients, conversion of data to physical units, alignment correction and extraction of useless data. Oxygen sensor calibration was done using Winkler titrations and salinity data were compared with water samples analysed with a Guildline 8400B autosal. The CTD data were passed through a quality control test based on UNESCO’s algorithm standards (1990). The recorded data were averaged every 1 db. The computed oceanographic parameters (see Table 5) were calculated using the averaged recorded data. Missing data were linearly interpolated. Finally, there is one ASCII file for every CTD cast. The content of a typical ASCII file is shown in Table 5.
CTD profiles cover the water column down to 10 meters from the sea-bed. To reduce the amount of information presented in this report, temperature and salinity contours are only provided for each section shown on Fig. 2 and Appendix 1A. The contours are presented in Appendices 5 and 6. All the profiles along the same section were used in the interpolation process. The temperature and salinity data were interpolated on a 5 km by 5 m grid with a triangle-based cubic interpolation method and contoured in Matlab®. The origin of each section is the westernmost or southernmost cast. For the West-East sections, Canada is on the left and Greenland on the right; for the South-North sections, South is on the left and North on the right.
Mooring data
Processing steps for mooring data are described in Rail et al. (2010). It consisted of meta-data and calibration coefficients validation, control of the instrument depth and clock, and comparison of mooring data with Rosette-CTD data recorded at the same location. Instrument depths and salinity data were corrected by adding an offset when needed. Erroneous time tags were corrected. Missing data and questionable data are mentioned in the quality control report, and they were replaced by NaNs. Users should consult the Quality Control Report (Rail et al. 2010). ASCII files were created for every instrument (Table 4).
Moored ADCP data
The processing and quality control of ArcticNet ADCP data are still ongoing. The quality control procedures on ADCP data were adapted from the «ADCPtools» box of the U.S. Geological Survey’s «Sediment Transport Instrumentation Group». The «ADCPtools» functions used by the USGS were adapted to the peculiarities of
ArcticNet’s data. The tests include the validation of the calibration, data and meta-data. The modified tests used are based on comparisons between data and defined «thresholds». If a data point does not meet the thresholds it is rejected and all its associated data points are then considered as «questionable». A document presenting in detail the finalized procedures of processing and quality control of ADCP data is available (Guillot 2007). An example of a stick diagram produced with the 2003-2004 ADCP data is shown in Appendix 7.
4. DISCUSSION
The sampling area covered by the ArcticNet 2005 expedition was huge: Hudson Bay and Strait, northern Baffin Bay, Canadian Arctic Archipelago, Amundsen Gulf and southern Beaufort Sea. The associated data base is enormous and will take a few years to process. In a twelve-week (two six-week legs) yearly expedition we can barely obtain a snapshot of the four sub-regions. The CAA is especially under-sampled. Because of the North Water project, we know where to sample in northern Baffin Bay and we are building a long-term time series of temperature and salinity contours along 75°N. This will enable us to monitor freshwater fluxes through Smith Sound, for example. An indication of possible coastal upwelling may be found in the section L4 contours (Appendix 5).
Three on-going studies are also worth mentioning. Romain Lanos has completed his study of southern Beaufort Sea and Amundsen Gulf using the CASES (Canadian Shelf Exchange Study) and ArcticNet 2004-2006 CTD data. In his Ph.D. thesis (Lanos 2009), he describes the regional and seasonal variability in the Beaufort Sea – Amundsen Gulf region. An on-going study of the SCAMP turbulent profiles (C. Sévigny, Ph.D. thesis in progress) show, for example, that the turbulence is dominated by double-diffusive processes in Smith Sound. More SCAMP profiles are needed in CAA and Beaufort Sea. Current pulses were observed in the 2003-2004 and 2004-2005 mooring data at CA04. The pulses have been related to storms in Bering Strait by C. Bélanger (Bélanger et al., submitted). Once the 2007-2008 data has been processed we will have a six year time series of the general conditions in Beaufort Sea and Smith Sound.
We thank Captains Julien and Gariépy and their crew aboard the CCGS Amundsen for their outstanding collaboration. We also thank the «Rosette team», Véronique Lago, Pascal Guillot, and all the «Rosette monkeys» for their outstanding sampling effort cast after cast after cast. Thanks to the mooring team, Luc Michaud, Pascal Massot, Sylvain Blondeau and Alexandre Forest. Thanks to Sophie Caplanne for her zodiac outings in order to obtain the SCAMP profiles. And last but not least, many thanks to Pascal Guillot and Maryam Kamali Nezhad for their data processing efforts.
6. REFERENCES
Bélanger, C., Y. Gratton, D. Dumont, A. Forest and L. Fortier. Observations of remote- wind-induced pulses of current under ice cover in the Canadian Beaufort Shelf Region. Submitted to Geophys. Res. Letters.
Fortier, L. D. Barber and J. Michaud [Eds], 2008. On thin Ice. Aboriginal Issues Press, Winnipeg, 215 p.
Blondeau, S., P. Massot, L. Létourneau, and C.J. Mundy. 2005. ArcticNet 2005 Cruise Report Leg 2 Mooring Operations. Internal report, Laval University, Québec (Qc): 1 p.
Gratton, Y., M. Ouellet, M.E. Rail, and R.G. Ingram. 2006. Distribution of temperature and salinity in Northern Baffin Bay during the International North Water program (August 1997, April to July 1998, and September 1999). Internal Report No R897, INRS-ETE, Québec (Qc): x + 124 p.
Guillot, P. 2003. Sea-Bird CTD Processing and Quality Control Procedure. Technical report, draft version, Québec-Océan, Université du Québec à Rimouski: 42 p.
Guillot, P. 2005a. Processing notes about the ArcticNet 0501 data. Technical report, Québec-Océan, Université du Québec à Rimouski: 33 p.
Guillot, P. 2005b. Processing notes about the ArcticNet 0502 data. Technical report, Québec-Océan, Université du Québec à Rimouski: 58 p.
Guillot, P. 2007. Rapport de traitement de données Workhorse ADCP (Acoustic Doppler Current Profiler). Technical report, draft version, Québec-Océan, Université du Québec à Rimouski, 99 p.
Hardenberg, B.V. 2004. Cruise Report for the joint DFO/CASES/ArcticNet Science Program aboard the CCGS “Sir Wilfrid Laurier”, 3 - 22 September 2004. Internal report, Institute of Ocean Sciences, Sydney, B.C: 27 p.
Ingram, R.G., E.C. Carmack, F.A. McLaughlin, and S. Nicol. 2005. Polar Ocean Coastal Boundaries, chapter 3 in: The SeaIdeas and Observations on Progress in the Study of the Seas, Volume 14 part A, A.R. Robinson and K.H. Brink (eds), Harvard
University Press, Cambridge: pp. 61-81.
Lanos, R., 2009. Circulation générale, mases d’eau, cycles d’évolution et transports entre la mer de Beaufort et le Golfe d’Amundsen. Ph.D. Thesis, INRS-ETE, September 2009.
McLaughlin, F.A., E.C. Carmack, R.G. Ingram, W.J. Williams, and C. Michel. 2005. Oceanography of the Northwest Passage, chapter 31 in: The SeaIdeas and Observations on Progress in the Study of Seas, Volume 14 part B, A.R. Robinson
and K.H. Brink (eds), Harvard University Press, Cambridge: pp. 1213-1244. Melling, H. (1999). Observations by moored instruments in Northern Baffin Bay
1997-1998. Unpub. Rep., Institute of Ocean Sciences, Sydney, B.C.: 37 p.
Michaud, L., S. Blondeau, P. Massot, M. Sampei, and A. Forest. 2005. ArcticNet 2005 Cruise Report Leg 1 Mooring operations. Internal Report, Laval University, Québec (Qc): 3 p.
Rail, M.E. 2005a. Physical Team Sampling Report ArcticNet 0501, from August 5 to September 15 onboard the CCGS Amundsen. Internal report, INRS-ETE, Québec (Qc): 6 p.
Rail, M.E. 2005b. Physical Team Sampling Report ArcticNet 0502, from September 15 to October 27 onboard the CCGS Amundsen. Internal Report, INRS-ETE, Québec (Qc): 4 p.
Rail, M.E., D. Boisvert, C. Bélanger and Y. Gratton. 2010. ArcticNet 2004-2005 mooring data - quality control report. Internal report (Unpublished), INRS-ETE, Québec (Qc): v + 19 p.
Simard, A., M.E. Rail, and Y. Gratton. 2008. Distribution of temperature and salinity in the southern Beaufort Sea during the CASES program. Internal Report, draft version, INRS-ETE, Québec (Qc): ix + 132 p.
Stewart, D.B., and Lockhart, W.L. 2005. An overview of the Hudson Bay marine ecosystem. Can. Tech. Rep. Fish. Aquat. Sci. 2586: vi + 487 p.
Compagny Instrument Type
CTD SeaBird SBE-9plus 1
Temperature SeaBird SBE-03 1 -5°C à +35°C 0.001C 0.0002C Conductivity SeaBird SBE-4C 1 0-7 S/m
(0-70mmho/cm) 0.0003 S/m (0.003mmho/cm) 0.00004 S/m (0.0004 mmho/cm) Pressure Paroscientific 410K-105 up to 10 500m (15 000psia)2 0.015% of full
scale 0.001% of full scale
Dissolved oxygen SeaBird SBE-43 3 120% of surface
saturation4 2% of saturation unknown
pH SeaBird SBE-18-I 5 0-14 pH units 0,1 pH unit unknown
Nitrates concentration Satlantic MBARI-ISUS 5T 6 0.5 to 2000 M 2 M 0.5 M
Light intensity (PAR) Biospherical QCP2300 1.4×10
-5 to 0.5
μE/(cm2·sec) sPAR Biospherical QCP2200 1.4×10
-5 to 0.5
μE/(cm2·sec)
Fluorescence Seapoint Chlorophyll-fluorometer 0.02-150 g/l unknown 30
Transmissiometer Wetlabs C-Star 0-5 V unknown 1.25 mV
Altimeter Benthos PSA-916 7 0 - 100 m unknown 0.01 m
CTD SeaBird SBE-9plus 1
Temperature SeaBird SBE-03 1 -5°C à +35°C 0.001C 0.0002C Conductivity SeaBird SBE-4C 1 0-7 S/m
(0-70mmho/cm) 0.0003 S/m (0.003mmho/cm) 0.00004 S/m (0.0004 mmho/cm) Pressure Paroscientific 410K-105 up to 10 500m (15 000psia)2 0.0015% of full
scale 0.001% of full scale
Dissolved Oxygen SeaBird SBE-43 3 120% of surface
saturation4 2% of saturation unknown
Fluorescence Seapoint Chlorophyll-fluorometer 0.02-150 g/l unknown 30
Light transmission Wetlabs C-Star 0-5 V unknown 1.25 mV Notes: 1 Maximum depth of 6800m
2 Depending on the configuration
7 Maximum depth of 6,000m Attached to the MVP Attached to the Rosette
3 Maximum depth of 7,000m
4 In all natural waters, fresh and marine 5 Maximum depth of 1,200m
6 Maximum depth of 1,000m
TABLE 2. Summary of the Rosette sampling, ArcticNet scientific expedition 2005
Start End 0501 1 August 5 September 15 137 80 8 0502 2 September 15 October 27 126 90 10 Number of stations Number of sections Expedition
number Leg number
Date Number of
TABLE 3. List of Rosette sections and their corresponding stations and casts numbers
Section Station Cast Section Station Cast
Leg 0501 Leg 0502 L1 24 a 5 L2 26 b 6 L3 28 c 7 L4 23 d 8 L5 22 e 9 L6 29 a 10 L7 35 b 11 L8 34 c 12 L9 33 d 13 L10 32 e 14 L11 31 f 17 L14 37 g 18 L15 36 a 19 L16 38 b 20 L17 39 c 21 L18 46 d 22 L19 45 e 23 L20 44 f 25 L21 43 g 26 L22 42 h 27 L23 41 ctd1 28 L24 40 ctd2 29 100 7 ctd3 30 102 8 ctd4 31 104 9 a 32 106 10 b 33 108 11 c 34 110 14 d 35 112 15 e 36 114 16 f 38 116 17 g 39 201 88 h 40 202 87 a 41 203 86 b 42 204 84 c 43 205 83 d 46 206 82 e 47 207 81 a 52 208 80 b 53 209 79 c 54 210 78 d 55 211 77 e 57 221 107 a 66 222 106 b 65 223 105 c 67 224 104 d 68 e 69 f 72 g 73 h 74 ctd12 84 ctd13 85 ctd14 86 ctd15 87 ctd16 88 ctd17 89 ctd18 90 ctd19 91 ctd25 99 ctd26 98 ctd27 97 ctd28 96 ctd29 95 ctd30 106 S Winisk S Nelson S16 S17 S19 S21 James Bay S13 S14 S15 S15-16 L5 NOW S5 Beaufort S400-South Beaufort S400-North L1 L2 L3 L4
TABLE 4. Summary of moored instruments, ArcticNet 2004-2005
Mooring Water
depth Position Instrument Serial No Instr. Depth (m)
Date of first reliable data Date of last reliable data dt (min) T (°C) Cond (mS/cm) Press (dbar) Spd (cm/s) Dir (true) Turb NTU Oxy
uM Chl Quality Control Comments
ALEC C/T 682 28 07-09-2004 21:20 04-09-2005 15:00 10 x x WARNING: this line as bended WH-ADCP 3844 94.5 07-09-2004 21:30 04-09-2005 14:00 60 x x x b.d. WARNING: NO GOOD COMPASS
CALIBRATION; this line as bended
RCM-11 281 198 07-09-2004 22:00 29-08-2005 14:51 60 x x x x x x x
many salinity data points replaced by NaNs; clock problems; some data missing; this line as bended
CA05-04
SBE37 3463 17 / 154 08-09-2004 01:29 04-09-2005 17:30 15 x x x WARNING: this line as bended and slided along the slope
WH-ADCP 3895 RCM-11 282 184 /
321 08-09-2004 02:00 04-09-2005 17:05 60 x x x x x x x
WARNING: this line as bended and slided along the slope
RCM-11 291 387 /
524 08-09-2004 02:00 27-06-2005 23:58 60 x x x x x x x
WARNING: this line as bended and slided along the slope; offset correction applied to salinity data; clock problems; several data missing
ALEC C/T 686 17 24-07-2004 03:50 03-09-2005 09:40 10 x x good data
WH-ADCP 296 86.4 24-07-2004 04:00 03-09-2005 09:00 60 x x b.d. WARNING: NO GOOD COMPASS CALIBRATION
RCM-11 276 189 24-07-2004 04:00 03-09-2005 09:34 30 x x x x x x x WARNING: huge clock problems; offset correction applied on salinity data.
ALEC C/T 687 43 30-07-2004 22:30 01-09-2005 10:50 10 x x good data
ACLW 286 43 30-07-2004 23:00 02-12-2004 02:00 1 sec
60s/1h x x x WARNING: NO GOOD CALIBRATION
RCM-11 271 111 30-07-2004 22:59 08-06-2005 23:59 60 x x x x x x x WARNING: clock problems; several data missing
RCM-11 272 216 30-07-2004 22:59 17-08-2005 19:01 60 x x x x x x x WARNING: clock problems; several data missing
RCM-11 283 418 30-07-2004 22:59 01-09-2005 09:58 60 x x x x x x x
WARNING: clock problems; several data missing; offset correction applied to salinity data
ACLW 285 26 17-07-2004 21:12 19-07-2004 21:46 1 sec x x x WARNING: NO GOOD CALIBRATION
ALEC C/T 591 Data were impossible to download
WH-ADCP 335 95 17-07-2004 21:30 01-09-2005 17:01 60 x x b.d. WARNING: NO GOOD COMPASS
CALIBRATION CA07-04 490 71°08.944'N 133°53.635'W In progress CA04-04 306 71°05.146'N 133°43.271'W MOORING LOST CA15-04 400 71°32.269'N 127°01.458'W 540 70°39.940'N 122°59.300'W CA20-04 251 70º20.356'N 126°21.421'W CA18-04
TABLE 5. Content of the ASCII Rosette-CTD data files.
Parameters Units Number of
significant digits
Pressure (or depth) dbars 2
Temperature C (ITS-90) 3
Transmissivity % 2
Fluorescence μg/l 2
Salinity PSS (1978) 3
Density, (S,T,P) kg/m3 2
Specific volume anomaly 10-8 m3/kg 0 N2: Brunt-Väisälä frequency 1/sec2 2 Density; (S,T,O) kg/m3 3 Potential temperature (θ) C 3 θ; Sθ,O) kg/m 3 3 Freezing temperature C 2
Dissolved oxygen concentration ml/l 4
pH no units 3
Nitrates mmol/m3 2
PAR pressure dbars 2
PAR μEinsteins/m2/sec 3
APPENDIX 1. Higher resolution maps of Arctic areas where Rosette-CTD, SCAMP and moorings data were collected.
1A. Rosette-CTD sampling sites in Baffin Bay, Labrador, Hudson Bay and Hudson Strait, Northwest Passage and Beaufort Sea (Legs 1 and 2).
1B. SCAMP sampling sites in Baffin Bay, Labrador Sea, Hudson Bay and Hudson Strait, Northwest Passage and Beaufort Sea (Legs 1 and 2).
1C. Moorings recovered and deployed in Beaufort Sea; and deployed in Baffin Bay and Hudson Bay (Legs 1 and 2).
Baffin Bay Labrador Sea
Hudson Bay and Hudson Strait
APPENDIX 1A. Rosette-CTD sampling sites in Baffin Bay, Labrador and Hudson Bay. (Legs 1 and 2)
Northwest Passage
Beaufort Sea
APPENDIX 1A. Rosette-CTD sampling sites in Northwest Passage and Beaufort Sea. (Legs 1 and 2)
DNA-02 DNA-15
13d
Baffin Bay Labrador Sea
15e 16e 17c 27 AN01 AN02 19e 22 Kuuj. 21e
Hudson Bay and Hudson Strait
APPENDIX 1B. SCAMP sampling sites in Baffin Bay, Labrador Sea and Hudson Bay. (Legs 1 and 2)
4 6 Northwest Passage 12 10 CA05 CA18 CA08 CA04 Beaufort Sea
APPENDIX 1B. SCAMP sampling sites in Northwest Passage and Beaufort Sea. (Legs 1 and 2)
CA15 CA07
CA04 CA05CA20
CA18
APPENDIX 1C. Moorings recovered in Beaufort Sea (Legs 1 and 2).
CA08 CA18 CA04
CA05
BA02 BA01 BA04 BA03 Baffin Bay AN03 AN02 AN01 Hudson Bay
APPENDIX 2. Rosette-CTD cast locations, sampling times, water depths and corresponding stations or mooring numbers during the 2004 and 2005 ArcticNet
scientific expeditions.
2A. Rosette logbook for the mooring deployment expedition of 2004 (0408) 2B. Rosette logbook for Leg 1 (expedition 0501)
Cast number Station or mooring Start date UTC Start time UTC Latitude (North) Longitude (West) Cast depth (m) Sea bottom depth (m) 1 CA-6 2004-09-05 20:15 70° 35.29 127° 44.07 249 256 2 CA-19 2004-09-06 02:36 70° 50.08 128° 59.03 63 73 3 CA-4 2004-09-07 12:32 71° 05.28 133° 16.97 304 315 4 Ca-07 2004-09-07 14:14 71° 09.04 133° 06.47 478 502 5 HM-S1 2004-09-07 16:29 71° 02.52 133° 34.86 128 139 6 CA-07 2004-09-08 01:28 71° 08.80 133° 06.29 470 X 7 CA-10 2004-09-08 14:38 69° 57.26 138° 20.95 246 256 8 CA-11 2004-09-09 13:14 70° 34.68 138° 21.54 1068 1114 9 CA-11B 2004-09-09 17:30 70° 34.61 138° 20.88 594 1114 11 CA09 2004-09-09 20:52 70° 12.62 137° 29.29 58 66 12 12 2004-09-09 20:52 70° 12.62 137° 29.29 58 66 13 HM-S1B 2004-09-10 07:46 70° 19.68 133° 15.64 50 51 14 MH-S10 2004-09-10 21:26 70° 53.52 129° 14.41 27 34 15 15 2004-09-10 21:22 70° 53.52 129° 14.41 27 34 16 C-203 2004-09-11 20:44 70° 08.32 125° 57.00 107 113 17 C-205 2004-09-11 23:08 70° 15.12 124° 01.56 56 60 18 C-205 2004-09-12 00:38 70° 19.35 124° 09.67 91 85 19 C-208 2004-09-12 02:37 70° 19.35 124° 31.43 239 250 20 C-209 2004-09-12 05:27 70° 31.50 124° 36.60 224 X 21 C-210 2004-09-12 14:16 70° 36.72 124° 48.01 422 425 22 C-212 2004-09-12 16:12 70° 45.26 123° 06.26 422 428 23 C-109 2004-09-12 19:29 70° 39.72 123° 32.70 564 592 24 CA18-04 2004-09-12 21:12 70° 40.04 122° 01.88 563 576 25 C107 2004-09-12 22:10 70° 36.26 122° 07.53 568 593 26 C107 2004-09-13 00:35 70° 36.13 122° 23.33 536 558 27 C104 2004-09-13 02:42 70° 35.99 122° 54.71 483 505 28 C103 2004-09-13 13:03 70° 35.96 121° 10.94 520 537 29 C100 2004-09-13 16:27 70° 35.95 121° 59.12 366 320
APPENDIX 2B. Rosette casts locations, sampling times, water depths and corresponding stations or mooring numbers during Leg 1 of 2005 ArcticNet scientific expedition (page
1:3). Cast number Station or mooring Start date UTC Start time UTC Latitude (North) Longitude (West) Cast depth (m) Sea bottom depth (m) 1 Pond Inlet 2005-08-14 14:07 72° 47.10 076° 59.05 975 989 3 100 2005-08-16 07:07 76° 17.98 071° 24.64 656 666 4 100 2005-08-16 11:00 76° 18.14 071° 24.58 663 685 5 100 2005-08-16 16:36 76° 17.93 071° 25.81 652 678 6 100 2005-08-16 18:55 76° 17.66 071° 26.30 656 672 7 100 2005-08-17 06:39 76° 17.98 071° 24.41 660 678 8 102 2005-08-17 08:31 76° 17.98 072° 06.21 540 557 9 104 2005-08-17 09:58 76° 16.97 072° 47.42 569 577 10 106 2005-08-17 11:52 76° 16.96 073° 28.67 538 547 11 108 2005-08-17 13:56 76° 15.98 074° 35.25 443 460 12 108 2005-08-17 17:06 76° 16.01 074° 34.72 442 450 13 108 2005-08-17 20:30 76° 15.32 074° 35.61 439 448 14 110 2005-08-18 02:57 76° 17.35 075° 00.58 433 443 15 112 2005-08-18 04:36 76° 19.42 075° 47.02 332 342 16 114 2005-08-18 08:03 76° 21.24 076° 35.38 137 151 17 116 2005-08-18 09:05 76° 22.92 077° 23.30 344 352 18 116 2005-08-18 11:58 76° 22.94 077° 23.85 345 360 19 116 2005-08-18 15:05 76° 23.00 077° 22.94 347 355 20 116 2005-08-18 23:38 76° 24.84 077° 20.94 268 280 21 L 9 2005-08-19 09:03 77° 49.96 075° 20.77 604 607 22 L 5 2005-08-19 13:49 78° 04.70 074° 39.70 661 671 23 L 4 2005-08-19 15:25 78° 04.96 075° 00.22 607 614 24 L 1 2005-08-19 18:05 78° 20.32 074° 39.48 636 645 25 L 2 2005-08-19 19:13 78° 19.68 074° 21.33 487 493 26 L 2 2005-08-19 21:39 78° 18.13 074° 28.79 517 530 28 L 3 2005-08-20 01:24 78° 19.15 074° 00.58 626 643 29 L 6 2005-08-20 03:56 78° 05.10 074° 19.55 700 709 30 L 11 2005-08-20 06:22 77° 49.98 074° 39.70 695 705 31 L 11 2005-08-20 07:54 77° 49.98 074° 39.25 695 704 32 L 10 2005-08-20 10:05 77° 49.78 075° 01.03 661 671 33 L 9 2005-08-20 11:08 77° 50.08 075° 20.72 597 608 34 L 8 2005-08-20 12:19 77° 49.83 075° 40.13 536 550 35 L 7 2005-08-20 14:24 77° 49.50 075° 59.24 562 572 36 L 15 2005-08-20 17:10 77° 34.57 075° 39.60 653 663 37 L 14 2005-08-20 18:12 77° 34.94 075° 54.01 600 609 38 L 16 2005-08-20 19:41 77° 35.03 075° 19.83 632 636 39 L 17 2005-08-20 20:54 77° 34.57 074° 58.96 655 663 40 L 24 2005-08-20 22:43 77° 20.11 075° 01.78 644 648 41 L 23 2005-08-21 01:10 77° 19.99 075° 22.69 540 561 42 L 22 2005-08-21 02:38 77° 19.97 075° 43.01 548 564 43 L 21 2005-08-21 03:39 77° 20.08 076° 01.24 522 540 44 L 20 2005-08-21 06:52 77° 19.97 076° 20.28 448 456 45 L 19 2005-08-21 07:48 77° 22.00 076° 39.33 422 430 46 L 18 2005-08-21 08:50 77° 19.21 077° 00.23 436 445 47 K 2005-08-21 16:07 77° 19.82 077° 00.63 384 384 48 BA04-05 2005-08-21 23:45 75° 14.40 074° 58.92 470 477 49 BA04-05 2005-08-22 04:17 75° 14.42 074° 59.53 470 479 50 BA04-05 2005-08-22 06:05 75° 14.45 075° 00.27 467 478
2:3). Cast number Station or mooring Start date UTC Start time UTC Latitude (North) Longitude (West) Cast depth (m) Sea bottom depth (m) 51 L 2005-08-22 15:21 74° 03.65 077° 13.22 819 838 52 3 2005-08-22 23:53 74° 03.05 079° 55.24 808 912 53 3 2005-08-23 04:12 74° 03.38 079° 54.09 788 804 54 3 2005-08-23 12:40 74° 02.81 079° 53.66 780 814 55 3a 2005-08-23 18:44 74° 11.79 083° 20.76 680 700 56 4a 2005-08-24 02:25 74° 18.15 088° 29.43 333 346 57 4 2005-08-24 07:43 74° 15.99 091° 11.80 322 334 58 4 2005-08-24 12:39 74° 15.75 091° 11.53 324 335 59 4 2005-08-24 15:00 74° 16.38 091° 09.72 325 333 60 4 2005-08-24 16:26 74° 16.63 091° 07.59 329 339 61 O 2005-08-25 22:45 73° 19.05 096° 20.57 211 222 62 P 2005-08-26 04:47 72° 19.85 096° 17.96 442 458 63 6 2005-08-27 10:19 69° 10.03 100° 41.97 54 65 64 6 2005-08-27 12:36 69° 10.46 100° 41.88 57 68 65 6 2005-08-27 15:41 69° 11.05 100° 42.62 63 72 66 R 2005-08-28 04:31 69° 02.06 101° 13.90 58 68 67 S 2005-08-28 10:49 68° 41.18 103° 59.57 93 105 68 7 2005-08-30 04:43 68° 59.86 106° 33.99 108 118 69 7 2005-08-30 08:31 69° 00.05 106° 34.33 100 111 70 7 2005-08-30 10:40 68° 59.88 106° 34.81 104 117 71 T 2005-08-31 05:44 68° 35.55 109° 28.10 137 151 72 U 2005-08-31 10:42 68° 25.18 112° 08.26 190 206 73 V 2005-09-01 00:12 69° 42.20 118° 23.63 479 489 74 CA18-05 2005-09-01 10:15 70° 39.97 122° 58.43 537 548 75 CA20-04 2005-09-01 17:40 70° 20.41 126° 20.55 242 254 76 CA05-04 2005-09-02 01:43 71° 24.84 127° 23.48 292 301 77 211 2005-09-02 02:45 71° 22.64 127° 29.70 253 263 78 210 2005-09-02 03:48 71° 20.57 127° 32.48 226 233 79 209 2005-09-02 05:00 71° 18.42 127° 41.95 165 175 80 208 2005-09-02 06:07 71° 16.45 127° 48.48 134 140 81 207 2005-09-02 07:07 71° 14.94 127° 54.56 98 103 82 206 2005-09-02 09:10 71° 12.85 128° 00.46 70 82 83 205 2005-09-02 09:51 71° 10.81 128° 06.24 62 70 84 204 2005-09-02 10:52 71° 08.85 128° 12.22 53 64 85 204 2005-09-02 12:51 71° 08.86 128° 12.04 54 64 86 203 2005-09-02 14:25 71° 06.79 128° 18.37 47 58 87 202 2005-09-02 15:03 71° 04.90 128° 24.63 44 54 88 201 2005-09-02 15:41 71° 02.95 128° 30.51 32 43 89 CA05-05 2005-09-02 22:37 71° 16.66 127° 31.41 195 201 90 CA05-05 2005-09-03 01:57 71° 16.80 127° 30.29 202 209 91 CA05-05 2005-09-03 04:54 71° 17.19 127° 30.13 201 210 92 CA15-04 2005-09-03 08:53 71° 32.02 126° 58.36 396 407 93 CA14-03 2005-09-03 15:19 71° 47.75 127° 59.87 389 409 94 CA13-03 2005-09-04 02:40 71° 21.78 131° 20.91 341 348 95 CA04-04 2005-09-04 12:21 71° 05.62 133° 42.53 324 331 96 CA07-04 2005-09-04 19:07 71° 10.44 133° 59.76 617 625 97 10 2005-09-05 14:20 71° 35.02 139° 59.00 976 2481 98 10 2005-09-05 16:59 71° 33.85 139° 59.50 975 2478 99 10 2005-09-05 20:49 71° 33.65 140° 06.71 975 2503 100 CA04-05 2005-09-06 21:46 71° 05.22 133° 37.01 326 334
APPENDIX 2B. Rosette casts locations, sampling times, water depths and corresponding stations or mooring numbers during Leg 1 of 2005 ArcticNet scientific expedition (page
3:3). Cast number Station or mooring Start date UTC Start time UTC Latitude (North) Longitude (West) Cast depth (m) Sea bottom depth (m) 101 CA04-05 2005-09-07 01:40 71° 03.75 133° 36.07 257 265 102 CA04-05 2005-09-07 04:35 71° 04.94 133° 34.48 196 331 103 CA07-04 2005-09-07 08:10 71° 10.75 134° 01.83 628 634 104 224 2005-09-08 07:57 71° 42.26 126° 28.96 385 397 105 223 2005-09-08 10:02 71° 38.31 126° 40.97 430 442 106 222 2005-09-08 11:02 71° 34.42 126° 52.99 412 428 107 221 2005-09-08 12:03 71° 30.47 127° 05.14 370 384 108 CA05-05 2005-09-09 05:31 71° 17.13 127° 32.74 190 198 109 CA08-05 2005-09-09 12:17 71° 00.90 125° 56.13 393 404 110 CA08-05 2005-09-09 14:05 71° 00.28 125° 55.93 394 402 111 CA08-05 2005-09-09 15:56 71° 00.24 125° 55.49 394 415 112 CA08-05 2005-09-10 02:46 71° 00.51 126° 03.23 386 395 113 11 2005-09-10 23:43 70° 20.37 126° 21.47 246 255 114 11 2005-09-11 02:59 70° 20.49 126° 21.74 246 263 115 11 2005-09-11 04:00 70° 20.76 126° 21.86 247 254 116 11 2005-09-11 05:00 70° 20.49 126° 21.74 246 252 117 11 2005-09-11 05:58 70° 20.53 126° 21.53 246 253 118 11 2005-09-11 06:56 70° 20.36 126° 21.43 247 256 119 11 2005-09-11 07:56 70° 20.36 126° 21.46 245 255 120 11 2005-09-11 08:56 70° 20.37 126° 21.45 245 255 121 11 2005-09-11 10:02 70° 20.36 126° 21.46 244 256 122 11 2005-09-11 10:59 70° 20.36 126° 21.46 244 256 123 11 2005-09-11 11:58 70° 20.36 126° 21.42 247 256 125 11 2005-09-11 13:02 70° 20.36 126° 21.44 245 256 126 11 2005-09-11 14:18 70° 20.37 126° 21.34 248 255 127 11 2005-09-11 16:49 70° 20.34 126° 21.69 246 254 128 11 2005-09-11 22:22 70° 20.36 126° 21.49 244 252 129 CA18-05 2005-09-12 15:49 70° 39.99 122° 59.37 537 544 130 CA18-05 2005-09-12 19:14 70° 39.98 122° 59.58 535 542 131 CA18-05 2005-09-13 03:39 70° 39.07 122° 59.69 598 608 132 12 2005-09-13 18:04 69° 54.80 122° 57.39 196 205 133 12 2005-09-13 21:18 69° 54.87 122° 56.98 186 193 134 12 2005-09-14 01:52 69° 54.86 122° 57.28 197 199 135 X 2005-09-14 04:48 69° 54.27 121° 30.21 261 266 136 Y 2005-09-14 10:35 69° 27.40 118° 11.33 454 465 137 Z 2005-09-14 14:12 69° 16.24 116° 50.76 186 192
1:3). Cast number Station or mooring Start date UTC Start time UTC Latitude (North) Longitude (West) Cast depth (m) Sea bottom depth (m) 1 T2 2005-09-16 12:43 68° 23.62 110° 05.87 236 246 2 S2 2005-09-17 02:06 68° 40.65 103° 52.15 102 108 3 O2 2005-09-18 16:39 73° 39.21 096° 17.01 240 252 4 Pond Inlet 2 2005-09-19 22:28 72° 38.15 079° 45.18 535 545 5 13a 2005-09-22 13:05 61° 16.38 064° 49.03 245 262 6 13 b 2005-09-22 15:25 61° 09.20 064° 49.49 435 450 7 13c 2005-09-22 18:23 61° 00.23 064° 44.63 502 518 8 13d 2005-09-22 22:04 60° 50.91 064° 42.47 377 387 9 13e 2005-09-23 00:44 60° 44.87 064° 41.71 291 303 10 14a 2005-09-23 16:22 62° 31.47 070° 52.08 330 344 11 14b 2005-09-23 17:53 62° 29.30 071° 02.42 330 342 12 14c 2005-09-23 19:21 62° 25.74 071° 17.84 324 331 13 14d 2005-09-23 20:48 62° 21.40 071° 39.38 334 343 14 14e 2005-09-23 23:17 62° 16.47 071° 58.70 330 338 15 14e 2005-09-24 01:46 62° 16.11 071° 56.92 330 343 16 14e 2005-09-24 04:15 62° 15.08 071° 52.53 340 342 17 14f 2005-09-24 10:07 62° 13.23 072° 14.98 225 233 18 14g 2005-09-24 11:13 62° 10.90 072° 24.94 179 200 19 15a 2005-09-25 07:54 64° 19.69 078° 05.02 108 115 20 15b 2005-09-25 08:46 64° 16.98 078° 15.09 202 209 21 15c 2005-09-25 09:53 64° 12.91 078° 31.01 261 271 22 15d 2005-09-25 11:24 64° 07.23 078° 52.26 237 245 23 15e 2005-09-25 14:44 64° 01.75 079° 12.88 304 311 24 15e 2005-09-25 16:39 64° 01.42 079° 16.30 303 312 25 15f 2005-09-25 21:54 63° 56.30 079° 33.70 310 325 26 15g 2005-09-25 23:09 63° 51.90 079° 49.16 290 292 27 15h 2005-09-26 00:08 63° 49.25 079° 59.27 211 216 28 CTD1 2005-09-26 04:15 63° 24.18 081° 06.25 61 69 29 CTD2 2005-09-26 05:15 63° 18.73 081° 15.11 112 120 30 CTD3 2005-09-26 06:22 63° 11.27 081° 27.08 173 182 31 CTD4 2005-09-26 07:33 63° 03.64 081° 39.02 216 230 32 16a 2005-09-26 08:27 62° 58.30 081° 47.59 206 220 33 16b 2005-09-26 09:22 62° 55.24 081° 37.94 209 218 34 16c 2005-09-26 10:28 62° 51.15 081° 23.29 198 205 35 16d 2005-09-26 11:59 62° 45.46 081° 03.44 189 198 36 16e 2005-09-26 14:26 62° 38.56 080° 44.78 197 205 37 16e 2005-09-26 17:10 62° 39.41 080° 47.26 209 220 38 16f 2005-09-26 23:48 62° 33.36 080° 24.86 195 205 39 16g 2005-09-27 00:58 62° 28.98 080° 10.42 179 187 40 16h 2005-09-27 01:58 62° 25.86 080° 01.34 160 174 41 17a 2005-09-27 10:49 62° 13.85 079° 08.55 129 140 42 17b 2005-09-27 11:44 62° 11.63 078° 58.11 175 186 43 17c 2005-09-27 13:00 62° 08.07 078° 42.87 147 156 44 17c 2005-09-27 16:38 62° 07.32 078° 47.09 164 176 45 17c 2005-09-27 18:23 62° 08.27 078° 42.86 141 153 46 17d 2005-09-27 19:45 62° 04.86 078° 27.25 60 71 47 17e 2005-09-27 20:53 62° 02.62 078° 17.24 37 47 48 18 2005-09-28 07:12 60° 07.51 079° 09.95 128 140 49 18 2005-09-28 10:27 60° 07.76 079° 07.70 123 136 50 18 2005-09-28 12:25 60° 09.44 079° 07.46 126 140
APPENDIX 2C. Rosette cast locations, sampling times, water depths and corresponding stations or mooring numbers during Leg 2 of 2005 ArcticNet scientific expedition (page
2:3). Cast number Station or mooring Start date UTC Start time UTC Latitude (North) Longitude (West) Cast depth (m) Sea bottom depth (m) 51 18 2005-09-28 15:49 60° 10.96 079° 20.78 145 155 52 19a 2005-09-29 05:38 58° 11.08 079° 30.23 95 107 53 19b 2005-09-29 06:58 58° 15.85 079° 06.82 66 75 54 19c 2005-09-29 08:15 58° 20.53 078° 43.39 91 106 55 19d 2005-09-29 09:12 58° 22.78 078° 31.56 93 103 56 19e 2005-09-29 10:16 58° 25.20 078° 19.89 96 106 57 19e 2005-09-29 11:55 58° 25.16 078° 19.94 104 116 58 19e 2005-09-29 18:42 58° 25.14 078° 20.35 102 114 59 20 2005-09-30 06:11 56° 50.40 076° 50.06 112 118 60 AN-03-05 2005-09-30 20:20 55° 17.08 077° 53.93 82 92 61 AN-03-05 2005-10-01 02:04 55° 17.70 077° 54.72 76 86 62 AN-03-05 2005-10-01 03:21 55° 17.72 077° 53.45 75 89 63 AN-03-05 2005-10-01 11:49 55° 17.07 077° 53.75 77 87 64 AN-03-05 2005-10-01 13:57 55° 22.48 078° 06.37 87 98 65 21b 2005-10-02 11:19 54° 41.11 079° 58.84 57 67 66 21a 2005-10-02 12:07 54° 37.93 079° 51.61 39 49 67 21c 2005-10-02 13:34 54° 41.32 080° 07.79 52 60 68 21d 2005-10-02 14:58 54° 42.20 080° 21.10 102 112 69 21e 2005-10-02 22:02 54° 42.94 080° 43.77 91 99 70 21e 2005-10-02 23:52 54° 43.02 080° 43.78 89 100 71 21e 2005-10-03 01:49 54° 43.20 080° 45.12 87 98 72 21f 2005-10-03 04:04 54° 44.80 081° 06.45 58 68 73 21g 2005-10-03 05:28 54° 45.77 081° 28.43 33 43 74 21h 2005-10-03 06:25 54° 46.37 081° 42.85 22 32 75 BI-1 2005-10-04 23:04 55° 25.79 080° 30.43 82 99 76 BI-1 2005-10-05 00:14 55° 25.75 080° 29.24 84 97 77 BI-1 2005-10-05 01:29 55° 25.81 080° 32.18 87 103 78 BI-2 2005-10-06 01:18 56° 45.07 080° 49.75 163 178 79 BI-2 2005-10-06 03:01 56° 43.68 080° 48.56 128 141 80 BI-2 2005-10-06 04:28 56° 43.05 080° 48.44 170 185 81 22 2005-10-06 20:51 58° 23.89 083° 17.49 168 181 82 22 2005-10-06 22:43 58° 23.25 083° 17.35 169 181 83 22 2005-10-07 00:34 58° 22.81 083° 18.53 165 178 84 CTD12 2005-10-07 06:35 57° 33.58 083° 49.16 170 181 85 CTD13 2005-10-07 10:21 56° 51.89 084° 13.23 165 178 86 CTD14 2005-10-07 12:44 56° 27.07 084° 27.12 128 146 87 CTD15 2005-10-07 15:19 56° 01.93 084° 40.99 90 100 88 CTD16 2005-10-07 16:39 55° 52.02 084° 46.29 80 91 89 CTD17 2005-10-07 17:43 55° 44.49 084° 50.40 53 64 90 CTD18 2005-10-07 18:43 55° 37.06 084° 54.34 31 41 91 CTD19 2005-10-07 19:37 55° 31.73 084° 57.04 22 30 92 CTD21 2005-10-08 14:06 58° 18.13 087° 04.22 170 180 93 24 2005-10-09 22:03 57° 21.86 091° 57.29 23 33 94 CTD29 2005-10-10 00:31 57° 26.83 091° 53.43 25 35 95 CTD29 2005-10-10 00:49 57° 26.92 091° 53.34 25 35 96 CTD28 2005-10-10 01:34 57° 30.66 091° 46.93 31 41 97 CTD27 2005-10-10 02:24 57° 34.68 091° 40.35 42 52 98 CTD26 2005-10-10 03:24 57° 40.45 091° 30.40 50 56 99 CTD25 2005-10-10 04:37 57° 48.12 091° 16.73 55 64 100 CTD24 2005-10-10 05:19 57° 43.29 091° 13.51 38 48
3:3). Cast number Station or mooring Start date UTC Start time UTC Latitude (North) Longitude (West) Cast depth (m) Sea bottom depth (m) 101 CTD23 2005-10-10 05:58 57° 38.39 091° 09.93 30 40 102 CTD22 2005-10-10 06:45 57° 33.44 091° 05.97 20 29 103 MH01-05 2005-10-10 12:00 57° 34.41 091° 37.18 50 60 104 MH01-05 2005-10-10 13:09 57° 34.43 091° 36.72 60 74 105 MH01-05 2005-10-10 16:18 57° 33.65 091° 37.97 52 59 106 CTD30 2005-10-11 02:06 57° 22.86 092° 00.02 11 21 107 CTD31 2005-10-11 06:55 58° 07.50 090° 43.20 70 81 108 CTD32 2005-10-11 11:09 58° 45.23 089° 32.93 85 95 109 23 2005-10-11 16:48 59° 00.68 087° 36.68 40 192 110 23 2005-10-11 17:04 59° 01.20 087° 36.71 179 194 111 23 2005-10-11 19:33 59° 01.70 087° 34.45 185 199 112 23 2005-10-11 21:36 59° 03.00 087° 30.96 188 200 113 23 2005-10-11 23:10 59° 03.57 087° 28.94 188 200 114 AN02-05 2005-10-12 13:37 58° 46.90 091° 31.25 70 80 115 AN02-05 2005-10-12 15:45 58° 46.58 091° 30.77 73 83 116 AN02-05 2005-10-12 17:56 58° 45.64 091° 30.06 73 85 117 AN01-05 2005-10-13 03:52 59° 58.64 091° 57.36 91 104 118 AN01-05 2005-10-13 06:31 59° 59.38 091° 58.13 103 115 119 25 2005-10-13 18:58 59° 02.46 094° 02.46 45 55 120 26 2005-10-16 02:24 60° 26.79 089° 22.29 133 141 121 26 2005-10-16 04:00 60° 26.67 089° 22.00 129 141 122 27 2005-10-16 14:08 61° 03.96 086° 10.89 229 242 123 27 2005-10-16 16:43 61° 02.58 086° 11.24 229 242 124 27 2005-10-16 18:50 61° 02.82 086° 12.39 229 244 125 HS-17 2005-10-18 19:20 61° 06.58 069° 54.33 150 165 126 HS-18 2005-10-21 21:06 60° 23.59 064° 54.55 55 65
APPENDIX 3. SCAMP cast locations, sampling times, water depths and corresponding station numbers during the 2005 ArcticNet scientific expedition
3A. SCAMP logbook for Leg 1 (expedition 0501) 3B. SCAMP logbook for Leg 2 (expedition 0502)
APPENDIX 4. SCAMP data profile. The data set is from profile #142739 recorded on station 4 during leg 0501. The blue line represented the temperature (oC), the green one is
fluorescence (volts), the red one is density (kg m-3), and finally the black one is the turbulent kinetic energy dissipation (m2 s-3).
APPENDIX 5. Sections of salinity and potential temperature for ArcticNet expedition 0501 (Leg 1).
The same color scale is used for all sections. For the West to East sections, Canada is on the left and Greenland is on the right.
5.1. Section L1 in northern Baffin Bay 5.2. Section L2 in northern Baffin Bay 5.3. Section L3 in northern Baffin Bay 5.4. Section L4 in northern Baffin Bay 5.5. Section L5 in northern Baffin Bay 5.6. Section NOW S5 in northern Baffin Bay 5.7. Section Beaufort S400 south in Beaufort Sea 5.8. Section Beaufort S400 north in Beaufort Sea
APPENDIX 5.1.A. The yellow arrow identifies the location of section L1 in northern Baffin Bay. This section is contoured on the next page.
APPENDIX 5.1.B. Salinity and potential temperature along section L1. The western sites are on the left and the eastern sites are on the right.
APPENDIX 5.2.A. The yellow arrow identifies the location of section L2 in northern Baffin Bay. This section is contoured on the next page.
APPENDIX 5.2.B. Salinity and potential temperature along section L2. The western sites are on the left and the eastern sites are on the right.
APPENDIX 5.3.A. The yellow arrow identifies the location of section L3 in northern Baffin Bay. This section is contoured on the next page.
APPENDIX 5.3.B. Salinity and potential temperature along section L3. The western sites are on the left and the eastern sites are on the right.
APPENDIX 5.4.A. Location of section L4 in northern Baffin Bay. The yellow arrow identifies the section contoured on the next page.
APPENDIX 5.4.B. Salinity and potential temperature along section L4. The western sites are on the left and the eastern sites are on the right.
APPENDIX 5.5.A. The yellow arrow identifies the location of section L5 in northern Baffin Bay. This section is contoured on the next page.
APPENDIX 5.5.B. Salinity and potential temperature along section L5. The western sites are on the left and the eastern sites are on the right.
APPENDIX 5.6.A. The yellow arrow identifies the location of section NOW S5 in northern Baffin Bay. This section is contoured on the next page.
APPENDIX 5.6.B. Salinity and potential temperature along section NOW S5. The western sites are on the left and the eastern sites are on the right.
APPENDIX 5.7.A. The yellow line identifies the location of section Beaufort S400 south in Beaufort Sea. This section is contoured on the next page.
APPENDIX 5.7.B. Salinity and potential temperature along section Beaufort S400 south. The south-western sites are on the left and the north-eastern sites are on the right.
APPENDIX 5.8.A. The yellow line identifies the location of section Beaufort S400 north in Beaufort Sea. This section is contoured on the next page.
APPENDIX 5.8.B. Salinity and potential temperature along section Beaufort S400 north. The south-western sites are on the left and the north-eastern sites are on the right.
APPENDIX 6. Contours of salinity and potential temperature for the different sections of ArcticNet expedition 0502 (Leg 2).
The same color scale is used for all sections. For West to East sections, West is on the left and East is on the right. For South to North sections, South is on the left and North is on
the right.
6.1. Section 13 in Hudson Strait 6.2. Section 14 in Hudson Strait 6.3. Section 15 across Foxe Channel 6.4. Section 15-16 across Evans Strait 6.5. Section 16 in Hudson Bay
6.6. Section 17 in Hudson Bay 6.7. Section 19 in Hudson Bay
6.8. Section 21 at the mouth of James Bay 6.9. Section Winisk River in Hudson Bay 6.10. Section Nelson River in Hudson Bay
APPENDIX 6.1.A. The yellow arrow identifies the location of section 13 in Hudson Strait. This section is contoured on the next page.
APPENDIX 6.1.B. Salinity and potential temperature along section 13. The southern sites are on the left and the northern sites are on the right.
APPENDIX 6.2.A. The yellow arrow identifies the location of section 14 in Hudson Strait. This section is contoured on the next page.
APPENDIX 6.2.B. Salinity and potential temperature along section 14. The south-western sites are on the left and the north-eastern sites are on the right.
APPENDIX 6.3.A. The yellow arrow identifies the location of section 15 across Foxe Channel. This section is contoured on the next page.
APPENDIX 6.3.B. Salinity and potential temperature along section 15. The south-western sites are on the left and the north-eastern sites are on the right.
APPENDIX 6.4.A. The yellow arrow identifies the location of section 15-16 across Evans Strait. This section is contoured on the next page.
APPENDIX 6.4.B. Salinity and potential temperature along section 15-16. The southern
APPENDIX 6.5.A. The yellow arrow identifies the location of section 16 in Hudson Bay. This section is contoured on the next page.
APPENDIX 6.5.B. Salinity and potential temperature along section 16. The north-western sites are on the left and the south-eastern sites are on the right.
APPENDIX 6.6.A. The yellow arrow identifies the location of section 17 in Hudson Bay. This section is contoured on the next page.
APPENDIX 6.6.B. Salinity and potential temperature along section 17. The western sites are on the left and the eastern sites are on the right.
APPENDIX 6.7.A. The yellow arrow identifies the location of section 19 in Hudson Bay. This section is contoured on the next page.
APPENDIX 6.7.B. Salinity and potential temperature along section 19. The western sites are on the left and the eastern sites are on the right.
APPENDIX 6.8.A. The yellow arrow identifies the location of section 21 at the mouth of James Bay. This section is contoured on the next page.
APPENDIX 6.8.B. Salinity and potential temperature along section 21 James Bay. The western sites are on the left and the eastern sites are on the right.
APPENDIX 6.9.A. The yellow arrow identifies the location of section Winisk River in Hudson Bay. This section is contoured on the next page.
APPENDIX 6.9.B. Salinity and potential temperature along section Winisk River. The southern sites are on the left and the northern sites are on the right.
APPENDIX 6.10.A. The yellow arrow identifies the location of section Nelson River in Hudson Bay. This section is contoured on the next page.
APPENDIX 6.10.B. Salinity and potential temperature along section Nelson River. The
APPENDIX 7. Example of 2003-2004 ADCP data from the mooring CA08 showing the ADCP velocity between 16 and 80 meters.