Numerical modeling of gas flow to select a radon emission
control method in waste rock dump 38neu, Germany
René Lefebvre1, Belkacem Lahmira1,2 and Walfried Löbner3
1
Institut national de la recherche scientifique, Centre Eau Terre Environnement (INRS-ETE), Québec, Québec, Canada
2
Now with the University of Saskatchewan, Saskatoon, Canada 3
Wismut GmbH, Chemnitz, Germany
ABSTRACT
Uranium mining waste rock was placed in dump 38neu, which was built along a slope on the edge of an inhabited valley. Despite its remediation involving surface resloping and a 1 m soil cover, there are still high radon fluxes at the dump toe in summer. Numerical modeling was done to identify mechanisms controlling gas flow and potential radon mitigation approaches. Dump gas buoyancy relative to atmospheric air was found to control gas flow. Passive gas venting wells could reduce radon fluxes at the dump toe.
RÉSUMÉ
Des stériles de l’exploitation d’uranium ont été placés dans la halde 38neu qui a été construite le long d’une pente à proximité d’une vallée habitée. Malgré sa réhabilitation impliquant un resurfaçage et un recouvrement de 1 m de sol, il y a encore des flux élevés de radon au pied de la halde en été. Un modèle.numérique a été développé pour identifier les mécanismes contrôlant l’écoulement des gaz et des approches de mitigation du radon. La densité relative du gaz de la halde par rapport à l’atmosphère contrôle l’écoulement de gaz. Des puits de ventilation passive du gaz pourraient réduire les flux de radon au pied de la halde.
1 INTRODUCTION
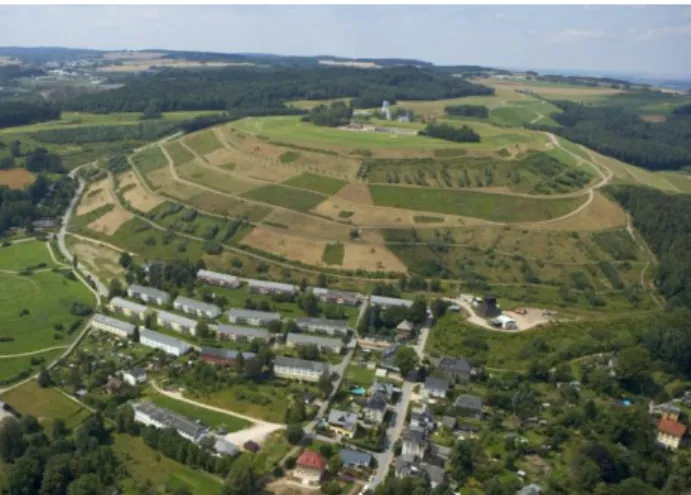
Since 1991, Wismut GmbH has been remediating uranium mining legacies in Eastern Germany. At the former Schlema-Alberoda mining site, 23 mine dumps are located near residential areas. In one example, waste rock dump 38neu was built along a natural slope on the edge of an inhabited valley (Figure 1). Dump 38neu contains 4.7 Mm3 of waste rock over a width of 750 m, with a maximum thickness of more than 30 m (Figure 2) and a total height of nearly 100 m between its top surface and toe.
Investigations of radon exhalation from uncovered mine dump surfaces revealed convective gas flow within the mine dump. The remediation of dump 38neu involved surface resloping with benches and adding a 1 m thick soil cover consisting of 0.2 m of organic soil over a 0.8 m radon barrier layer made up of fine soil.
Following remediation and surface vegetation, the radon situation was monitored in dump 38neu. Under summer conditions, it was found that relatively high radon concentrations and radon fluxes occurred across the cover in the lower slope areas near the toe of the dump.
The objectives of this study were to carry out numerical simulations representing gas flow in covered waste rock dump 38neu to develop an appropriate conceptual gas flow model and identify potential options to influence gas transport processes in order to mitigate radon liberation.
The study involved data from field measurements and monitoring in order to improve the conceptual model of gas flow in dump 38neu, provide estimates of physical properties and serve as model calibration criteria.
Figure 1. Waste rock dump 38neu of uranium mining in Bad Schlema, Wismut GmbH, Germany. Note proximity of housing developments near the dump toe
The study involved the following steps:
Field measurements and monitoring data were analyzed to develop a gas flow conceptual model;
A numerical grid was made to represent the dump geometry and material properties were estimated;
Base case numerical models of gas flow under present-day conditions were developed and validated against the monitoring data;
Simulations were made of potential radon mitigation approaches to identify those which could be potentially effective.
2 FIELD CHARACTERIZATION
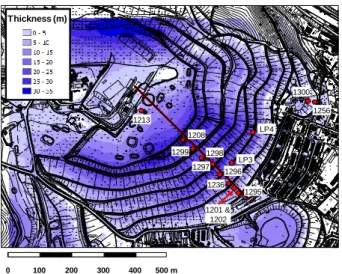
Differential pressure measurements across the soil cover at different elevations on the dump slope are powerful means to characterize the driving forces of air flow inside the dump. Figure 2 shows measurement points (MPs) on the surface of dump 38neu. These measurement points were concentrated along a line passing through the thickest part of the dump. The numerical model was also based on a vertical cross-section along this line (Figure 5) to facilitate the comparison of model results with field measurements. The thickness of waste rock was derived from the present topography of the dump surface and the former natural surface topography prior to the placement of the dump.
The continuous monitoring of differential pressure across the soil cover was carried out by Wismut GmbH during July and August 2010. Also, a weather station continuously monitors air temperature and atmospheric pressure.
Measurements had already been made by Wismut GmbH on radon concentrations under the cover and radon fluxes at the cover surface from 2006 to 2008 at MPs 1201 and 1202, which are located near the base of the dump. The air permeability of the soil cover was also measured in the field. Grain size distributions are also available on the soil cover material. Wismut GmbH also carried out gas tracer tests under winter conditions, which provided an estimate of gas flow velocity inside the dump.
Thickness (m) 1208 1299 1298 1297 1296 1236 1295 1300 1256 1213 1201 & 1202 0 100 200 300 400 500 m LP4 LP3
Figure 2. Map of waste rock dump 38neu, showing its thickness (levels of blue) and monitoring points (MP) (red circles with MP numbers). The red line indicates the location of the cross-section shown on Figure 5
Differential pressures were correlated to atmospheric temperature at each MP. Figure 3 illustrates two of these correlations for MPs located in the upper (1299) and lower (1295) parts of the dump slope, which exhibit inverse trends. A time lag of 70 minutes between differential pressure responses to changes in temperature was removed prior to making the correlations.
For all MPs, there is zero differential pressure at a temperature of 9.5 ºC (Fig. 3). This is the mean annual atmospheric temperature at the site and it is presumed to
also be the mean internal temperature of the dump. Differential pressures can thus be inferred to be driven by differences between the internal dump temperature (assumed to be quite constant) and variable atmospheric temperatures. y = -0.5345x + 5.1 R² = 0.4597 -20 -15 -10 -5 0 5 10 15 0 5 10 15 20 25 30 35 40 D if fe re n ti a l p re s s u re ( P a ) Atmospheric temperature (C)
Differential pressure vs temperature at MP1299 (weather station Schlema2_SCT208)
y = 1.3034x - 12.4 R² = 0.8535 -10 -5 0 5 10 15 20 25 30 0 5 10 15 20 25 30 35 40 D if fe re n ti a l p re s s u re ( P a ) Atmospheric temperature (C)
Differential pressure vs temperature at MP1295 (weather station Schlema2_SCT208)
Figure 3. Correlation of differential pressures across the soil cover with atmospheric temperature for MPs in the upper (1299 at 454 m) and lower (1295 at 413 m) slope (periods with reliable data were used for the correlation)
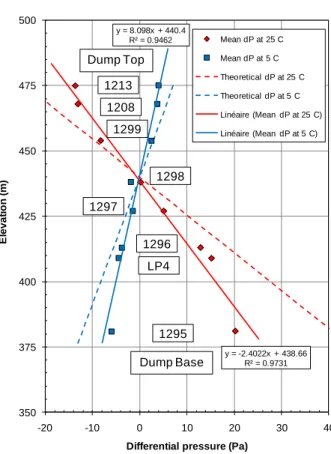
The correlations illustrated in Figure 3 provided mean values of differential pressure at 5 and 25 ºC at the elevations of each MP. These values of temperature were used because they represent winter and summer (min. and max.) conditions at the site. Figure 4 shows these mean differential pressures at the elevations of the MPs. There is a linear trend in differential pressures with depth, which is opposite at 5 and 25 ºC. There is a crossover at which there is no differential pressure at 440 m (close to the elevation of MP 1298, which has low differential pressures poorly correlated with temperature). At a given elevation, the magnitudes of differential pressures at 5 ºC are lower than at 25 ºC because 25 ºC departs more from the mean dump temperature of 9.5 ºC.
y = -2.4022x + 438.66 R² = 0.9731 y = 8.098x + 440.4 R² = 0.9462 350 375 400 425 450 475 500 -20 -10 0 10 20 30 40 E le v a ti o n ( m )
Differential pressure (Pa)
Differential pressures at 5 and 25 oC (without 1236 & 1300; with LP4)
Mean dP at 25 C Mean dP at 5 C Theoretical dP at 25 C Theoretical dP at 5 C Linéaire (Mean dP at 25 C) Linéaire (Mean dP at 5 C) Dump Base Dump Top 1295 LP4 1296 1297 1298 1299 1208 1213
Figure 4. Mean differential pressures at 5 and 25 ºC at MPs located at different elevations on the dump (negative values indicate a lower pressure in the dump than in the atmosphere)
The dashed lines on Figure 4 represent the theoretical differential pressure that would be present in a static gas column of the dump at 9.5 ºC isolated from the atmosphere by a perfectly sealing soil cover. The actual differential pressures in the dump are lower than these theoretical values, which indicate that there is gas flow in the dump leading to potential (or pressure) losses.
At 25 ºC, differential pressures indicate that the dump gas pressure is lower than the atmosphere in the upper slope of the dump, but higher than the atmosphere in the lower slope. There will thus be a tendency for air to enter in the dump through the soil cover in the upper part of the slope, whereas dump gas will tend to exit through the cover in the lower part of the slope. This implies that gas flows downward through waste rock within the dump. The gas flow behavior is the reverse at 5 ºC. Higher differential pressures in the upper and lower parts of the dump imply that higher gas fluxes will occur through the soil cover at these locations.
This gas flow behavior can be explained by the buoyancy of dump gas relative to the atmosphere. At relatively low atmospheric temperature (below 9.5 ºC), the dump gas phase has a lower density than atmospheric air, so dump gas tends to flow upward, whereas high atmospheric temperature leads to an atmospheric air density lower than dump gas, thus leading to the downward flow of dump gas. The later situation leads to radon gas fluxes at the base of dump 38neu.
Gas concentrations and fluxes at measurement points 1201 and 1202, close to the base of the dump, were also used to estimate a representative radon concentration in the dump of about 1000 kBq/m3 at these locations. The radon fluxes of 5 and 25 Bq/m2s at these points allowed estimates of dump gas volumetric and mass fluxes as well as of the effective air permeability of the soil cover (between 10-12 and 10-11 m2), which is consistent with field measurements of air permeability.
3 MATERIAL PROPERTIES AND GEOMETRY The numerical model is a 2D vertical section representing the surface and base topography of dump 38neu (Figure 5). The grid was designed to represent atmospheric boundary elements as well as the following materials (from top to base): soil cover, waste rock, basal waste rock boulder layer and materials underlying the dump.
350 375 400 425 450 475 500 0 100 200 300 400 500 Elev atio n (m ) Horizontal Distance (m) Atmospheric boundary Soil Cover
Regular waste rock Boulder layer Underlying material Vertical exaggeration of 2 Dump Top Lower Slope Upper Slope Dump Base Dump Toe
Figure 5. Cross section through dump 38neu (location shown in Fig. 1) showing materials and geometry
Table1 summarizes the main properties of materials that were derived on the basis of available information and analog sites (Lefebvre et al., 2002; Lahmira et al., 2009). Two base case models were developed: 1) a simplified base case considering only waste rock and a soil cover, and 2) a final base case considering two types of waste rock, including a coarse boulder layer at the base of the dump, and natural soil underlying the dump. Table 1. Material properties used in the simulations
Materials Porosity Water saturation Air permeability Range of air permeability n (-) Sw (-) k (m2) k (m2)
Simplified Global Base Case
Soil cover 0.45 0.80 5x10-12 5x10-12 and 5x10-11 Waste rock 0.34 0.44 1x10⁻⁸ 1x10⁻⁹ to
5x10⁻⁸ Final Base Case
Soil cover 0.45 0.80 1x10-11 8x10-12 and 1x10-11 “Regular” waste rock 0.34 0.44 8x10 -10 8x10⁻¹⁰ to 2x10⁻⁹ Boulder layer 0.34 0.44 3.5x10⁻⁸ 3x10⁻⁸ to 3.5x10⁻⁸ Underlying materials 0.34 0.44 1x10 -10 1x10⁻¹⁰ to 5x10⁻¹⁰
4 BASE CASE NUMERICAL MODELING
Two numerical models, called “base cases”, were developed to represent steady state gas flow in dump 38neu under present-day conditions at atmospheric temperatures of 5 and 25 ºC. These temperatures are in the lower and upper range of values recorded at the site. Therefore, modeling at these temperatures can represent end-members of gas flow patterns occurring in dump 38neu. The internal dump temperature in the models was set at 9.5 ºC, which corresponds to the mean atmospheric temperature as confirmed by differential pressures (Fig. 3). Atmospheric temperature was applied on boundary elements at the top surface of the dump. The base of the dump was assumed to be impermeable to gas flow.
Based on a previous simulation study representing a similar gas flow behavior (Lahmira et al., 2009), some simplifying conditions were used: 1) heat transfer by conduction was not represented in the model, but the model considers different temperatures for the dump and atmosphere, 2) only gas flow was considered and water was set as immobile in the waste rock dump, and 3) the same constant gas composition was used for atmospheric air and dump gas since the waste rock is not acid-generating and thus does not consume oxygen.
The two base case models represent different materials in the dump (Table 1). A simplified base case simulation represented only the 1-m soil cover and underlying bulk waste rock. This model was developed to achieve an initial calibration of simulated conditions to differential pressures with simplified material distribution. After calibration of the simplified base case, a final base case model was then developed to represent the internal distribution of materials within the dump, including the presence of a boulder layer (Figure 5 and Table 1). The final base case model was calibrated and validated against 1) differential pressure measurements at different elevations along the surface of the dump, 2) radon flux and concentration measurements on the lower part of the dump slope that were used to estimate equivalent gas fluxes, 3) upward gas velocities at the upper base of the dump estimated by Wismut GmbH on the basis of a gas tracer test made at “low” atmospheric temperature and 4) the elevation of the cross-over at which differential pressures are zero (i.e. 440 m, Figure 4).
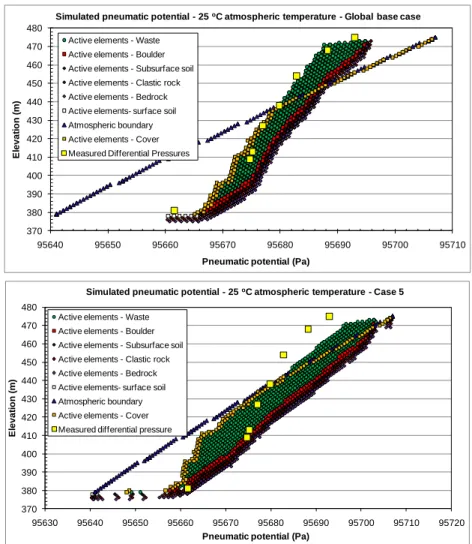
The simplified base case model was run at 5 and 25 ºC and calibrated against the field measurements of differential pressure (converted into pneumatic potentials – for details see Lefebvre et al., 2011a or 2011b). Figure 6 shows that there is a good match between simulated and measured pneumatic potentials at 25 ºC near the surface of the dump. This calibrated simplified base case used air permeability values of 5x10-12 m2 for the cover and 1x10⁻⁸ m2 for the bulk of waste rock (Table 1).
A final base case model was then developed by distinguishing “regular” waste rock, a waste rock boulder layer at the base of the dump and natural materials underlying the waste rock. The calibration and validation objectives were met using air permeabilities of 1x10-11 m2, 8x10⁻¹⁰ m2, 3.5x10⁻⁸ m2 and 1x10⁻¹⁰ m2, respectively, for the soil cover, “regular” waste rock, the boulder layer and
the natural material underlying the dump (Table 1). This final base case reproduces the gas velocity of a tracer experiment as well as the radon fluxes measured at the base of the dump. However, the differential pressures are not matched as closely as with the simplified base case (Figure 6). The two base cases are considered representative of the range of possible internal material distribution in dump 38neu, so both models were used to simulate potential radon mitigation options.
The air permeability of the cover is consistent with field measurements as well as the values derived from radon fluxes. At this permeability, the soil cover does limit the entry and exit of gas in the dump, but its air permeability is much higher than what would be expected on the sole basis of the grain size of the material. It is presumed that vegetation growth, bioturbation and natural evolution of the material exposed to weather conditions have led to the observed conditions. Based on Wismut GmbH information concerning older dump cover, this evolution towards higher soil cover permeability is normal, so a further increase in soil cover permeability in the future is to be expected for dump 38neu as well. The consequence is that the soil cover does not totally impede gas flow through the dump, although its permeability is low enough to favor a long gas flow path through the entire length of the waste rock dump slope.
The air permeability of waste rock needed to reproduce differential pressure measurements is much higher than field indications obtained from water infiltration tests. It is inferred that field measurements made in the upper layer of the dump may represent properties of crushed and compacted waste rock related to machinery traffic during resloping of the dump. It is also inferred that the end dumping and cone dumping construction of the dump may have induced high vertical permeability as well as potentially a boulder layer at the base of the dump that may explain the high air permeability.
The simplified base case (single material under the soil cover) and the final base (representing the presence of a boulder layer) are considered as representing “end-members” of the potential internal material structure of dump 38neu. Both cases generally represent most of the observations made by Wismut GmbH at the site, but not exactly. The simplified base case better represents differential pressures whereas the final base case does not match differential pressures as well but better represents the gas fluxes and the velocity of the gas tracer test in the upper part of the dump. We thus used the two models to simulate radon flux mitigation measures. If simulated measures appear applicable using both models, these measures can then be expected to work efficiently, independently of the actual internal distribution of materials in dump 38neu. This approach is prudent as it is important to have robust radon mitigation solutions that can be efficient under different actual internal conditions of the dump. The last part of this section will summarize the main features of the gas flow system that need to be considered in the development of potential radon flux mitigation measures.
370 380 390 400 410 420 430 440 450 460 470 480 95640 95650 95660 95670 95680 95690 95700 95710 E le v a ti o n ( m )
Pneumatic potential (Pa)
Simulated pneumatic potential - 25 oC atmospheric temperature - Global base case
Active elements - Waste Active elements - Boulder Active elements - Subsurface soil Active elements - Clastic rock Active elements - Bedrock Active elements- surface soil Atmospheric boundary Active elements - Cover Measured Differential Pressures
370 380 390 400 410 420 430 440 450 460 470 480 95630 95640 95650 95660 95670 95680 95690 95700 95710 95720 E le v a ti o n ( m )
Pneumatic potential (Pa)
Simulated pneumatic potential - 25 oC atmospheric temperature - Case 5
Active elements - Waste Active elements - Boulder Active elements - Subsurface soil Active elements - Clastic rock Active elements - Bedrock Active elements- surface soil Atmospheric boundary Active elements - Cover Measured differential pressure
Figure 6. Simulated pneumatic potentials versus elevation at 25 C for the simplified (top) and final (bottom).base cases. Simulated conditions for different parts of the dump are compared to measured differential pressures (yellow squares)
Horizontal Distance (m) E le v a ti o n (m ) 0 50 100 150 200 250 300 350 400 450 500 550 360 380 400 420 440 460 480 500 Potential 95707 95702 95698 95693 95689 95684 95680 95675 95670 95666 95661 95657 95652 95648 95643
Velocity streamtrace markers at 3 days intervals
Pneumatic potential (Pa) and velocity streamtraces Base case at 5o
C atmospheric temperature and 9.5o
C dump temperature «Global Properties»
2X Vertical Exaggeration Frame 00117 Nov 2010 Horizontal Distance (m) E le v a ti o n (m ) 0 50 100 150 200 250 300 350 400 450 500 550 360 380 400 420 440 460 480 500 Potential 95707 95702 95698 95693 95689 95684 95680 95675 95670 95666 95661 95657 95652 95648 95643
Pneumatic potential (Pa) and velocity streamtraces at 25o
C atmospheric temperature and 9.5o
C dump temperature « All Materials-Case 5»
2X Vertical Exaggeration
Velocity streamtrace markers at 3 days intervals
2X Vertical Exaggeration2X Vertical Exaggeration
Frame 00123 Jan 2011
Figure 7. Pneumatic potential (kPa) and gas transit time along stream traces at 25 C for the simplified base case (left) and the final base case (right)
Figure 7 shows the simulated gas flow patterns, both for the simplified and final base cases at 25 C. Trends in pneumatic potentials with elevation (Fig. 6) and gas flow patterns (Fig. 7) are similar, but in opposite direction, for simulations made at 5 C (not shown). Preferential gas entry and exit occur on the top surface of the dump and
on its lower slope. Higher differential gas pressures between the atmosphere and the dump gas at the upper and lower limits of the dump promote more significant gas exchanges at these locations (Figures 4 and 6). The gas exchange across the top surface is also favored by its very large surface area compared to the rest of the dump.
However, the highest differential pressures are present near the base of the dump, thus favoring higher radon gas fluxes out of the dump at that location under high atmospheric temperatures (above 9.5 °C). Along the dump slope, the portions of slopes just above benches are the locations of preferential gas entry or exit through the soil cover, whereas there are lower fluxes across the bench surfaces. This preferential flow occurs because benches lead to discontinuities in the normal trend of pneumatic potential differences with elevation between dump gas and the atmosphere. Such a behavior was observed in previous numerical simulations at other sites (Lefebvre et al., 2001, 2002; Lahmira et al., 2009).
The natural material underlying the dump does not seem to play an important role on gas flow, as its estimated gas permeability is much lower than that of the waste rock and boulder layer. Within the dump, there is preferential flow and higher gas velocities in the boulder layer. Gas flow is actually “focused” through the boulder layer. This layer was represented as not covering the entire extent of the dump base, so gas flow goes through “regular” waste rock before entering and after leaving the boulder layer. However, within the dump, most of the gas flows through the boulder layer.
5 MODELING OF MITIGATION APPROACHES A simulation program was carried out to represent the following potential radon flux mitigation options: 1) vertical barriers through the entire thickness of waste rock located at the toe or at the center of the dump; 2) enhancement of the soil cover over the top surface of the dump with a decreased air permeability; 3) openings in the soil cover on benches along the dump slope; 4) the potential effect of long-term degradation of the soil cover that would increase its air permeability; 5) gas venting wells screened at the base of the dump in the boulder layer under different benches; and 6) the effect of long-term degradation of the soil cover on gas venting wells at the most efficient location. This section only provides the highlights of simulation results for potential mitigation options (details in Lefebvre et al., 2011a and 2011b).
Option 1 – Internal barriers: an internal barrier near
the toe of the dump does not significantly change gas flow patterns for the heterogeneous model (with a boulder layer) and it even leads to higher gas fluxes through the soil cover at the toe of the dump for the homogeneous model. The use of a barrier at the center of the dump breaks the gas flow system into two separate “cells” with gas entry and exit in the upper and lower halves of the dump, but gas fluxes through the soil cover near the toe of the dump remain high. Internal barriers show some potential, but they did not appear as promising as the efficient mitigation option identified.
Option 2 – Soil cover enhancement: Improvement of
the soil cover to reduce its air permeability on the top surface of the dump leads to a significant reduction in gas flow through the cover on the top surface of the dump. However, increased gas flow through the upper half of the dump almost negates the beneficial effect of the cover enhancement on the top surface. It follows that gas flow through the soil cover near the toe of the dump is not
significantly reduced. Improvement of the soil cover on the top surface of the dump was considered because there is a large global flow rate through the wide area of the top surface of the dump. Enhancement of the soil cover over the entire dump, including the slopes, was not numerically considered because it did not appear as promising as the efficient mitigation option identified.
Option 3 – Openings in the soil cover: Openings in
the soil cover on the benches of measurement points 1297 and 1296 (alone or combined) was considered as it was thought to have the potential to change the gas flow patterns in the dump and vent part of the gas flowing through the dump. Such changes were thought to potentially lead to reduction of gas fluxes through the soil cover near the toe of the dump. For the heterogeneous model, the boulder layer so dominates gas flow that openings away from this material on the top surface of the dump had very little effects of the overall gas flow patterns and gas fluxes through the soil cover near the toe of the dump. There was some reduction in gas fluxes in the lower half of the dump for the homogeneous model, but not very significant reductions in gas fluxes through the soil cover near the toe of the dump.
Option 4 – Degradation of the soil cover: The air
permeability of the soil cover is significantly higher than expected for the grain size of the cover material, which is thought to result from bioturbation of the cover. It can thus be expected that the long term evolution of the cover may lead to further increases in the air permeability of the cover. Simulations were made to verify the effect of such long term changes. Simulation results showed that if the air permeability of the cover were to increase by an order of magnitude or more, gas flow through the dump would be much enhanced. Under such conditions gas fluxes through the soil cover near the toe of the dump would increase several fold.
Option 5 – Gas venting wells: Simulations were
made to represent the effects of vertical gas venting wells screened through the thickness of the boulder layer near the base of the dump under the benches located in the lower half of the dump (where MP 1298, 1296 and 1236 are located). These simulations considered only high atmospheric temperatures (25 ºC) at which gas flow is downward through the dump and dump gas escapes through the soil cover near the toe of the dump. Such wells would passively vent the dump gas, which has a higher pressure than the atmosphere in the lower half of the dump.
Such venting wells have to be located in the lower half of the dump to intercept the downward gas flow prior to its exit through the soil cover near the toe of the dump. However, these wells cannot be installed too near the toe of the dump because these wells must intercept a significant thickness of highly permeable waste rock to be efficient. It is presumed that the boulder layer does not extend to the outer limit of the dump. Since these wells are passively venting dump gas, they should not significantly enhance gas flow in the dump. Furthermore, these wells should be installed with valves (clappers) preventing gas entry in the wells to avoid enhancing gas flow through the dump under low atmospheric temperatures.
Simulation results showed that venting wells located under the three considered locations lead to reduced gas flow through the soil cover near the toe of the dump, which should be resulting in lower radon concentrations near the houses. Venting wells have similar positive effects for the simplified and final base case models. Location of venting wells under the bench of MP 1236 is most effective, as it leads to greater reduction of fluxes through the soil cover near the toe of the dump. For the final base case model, Figure 8 shows that gas fluxes through the soil cover near the toe of the dump are reduced to about 20% of the fluxes without such wells. Similar results are obtained with the homogeneous model. Venting wells intercept the gas flow of all the gas that had entered the dump up-gradient of the venting wells. The gas flow still exiting the dump down-gradient of the venting wells is related to gas that is entering the dump from the last bench to the base of the dump. If radon emissions needed to be further reduced beyond the effect related to gas venting wells, it could perhaps be achieved by improvement of the soil cover in the lowest part of the dump, down-gradient of the venting wells.
375 400 425 450 475 500 -1.5E-05 -1.0E-05 -5.0E-06 0.0E+00 5.0E-06 1.0E-05 0 50 100 150 200 250 300 350 400 450 500 550 Elev atio n (m ) T ot al G as Fl ux (m 3/m 2/s) Horizontal Distance (m)
Base Case - Ventilation at MP 1236 Base Case - No Ventilation Surface Topography Measure Points 1295 1236 1296 1298 1299 1208 1213 Exiting gas flux LP4 1201 / 1202 1297 1208
Zero gas flux
Entering gas flux
Figure 8. Simulated gas fluxes through the soil cover for the final base case at 25 C for present-day conditions (purple dots) and with gas venting wells (blue dots)
Option 6 – Gas venting wells and degradation of the soil cover: Simulations were made to evaluate if
venting wells would still be efficient if there were a long-term degradation of the soil cover. Compared to the situation without venting wells and with degradation of the soil cover, the gas flux through the cover near the base of the dump is lower. Still, this flux is quite high. Even with venting wells, it is thus necessary to maintain some cover integrity to limit gas flow through the dump, especially over the lower slope. Mechanisms degrading the cover should thus be minimized and cover maintenance appears beneficial even with venting wells.
6 DISCUSSSION
Results obtained from simulations of potential radon gas mitigation options provide further insight on the gas flow behavior in dump 38neu as well as on the mechanisms that can be effective (or not) to mitigate radon gas emissions. Among other things, these simulations show the important role of the boulder layer in controlling gas flow in the dump. The control exerted by the boulder layer leads to difficulties in controlling gas flow using measures
aimed only at the dump surface, such as cover openings. These openings were found to enhance gas flow, rather than dissipate gas circulation in the dump. An important implication of the simulation results also concerns the role played by the soil cover on the overall gas flow through the dump. Although the soil cover in its present state is found to be somewhat degraded (higher air permeability), it still limits gas circulation through the dump. It is thus necessary to limit important long-term degradation of the cover, through maintenance or measures preventing important bioturbation.
Passive control of exiting gas flow through the cover with the use of gas venting wells appears as a viable radon gas mitigation option that has many advantages. It is important to emphasize that such venting wells intercept gas that would have otherwise exited mostly through the soil cover near the toe of the dump. The role of venting wells is thus to provide control on the location of gas exhaust from the dump, not on preventing gas flow through the dump. Gas control does not appear feasible without major changes to the configuration of the dump, such as numerous internal vertical barriers or an enhanced cover over the entire dump surface. Gas venting wells have the following advantages:
Gas venting wells appear effective both for the simplified and final base case models. This system thus seems robust since its efficiency is not dependent on the actual internal structure of the dump, which is still largely unknown;
Effectiveness of gas venting wells can be monitored using the same approaches already implemented by Wismut GmbH on dump 36neu: measurements of differential pressure and radon fluxes. Based on the results of this monitoring and on the gas flow rates of these wells, it will be possible to adapt the well spacing. This system is thus flexible and can be progressively implemented in phases. Finally, if it were found during a pilot phase that venting wells are not efficient or lead to detrimental effects, it would be simple to seal the wells and return the system to its original condition;
Besides monitoring, the system would operate passively with minimal mechanical apparatus (except for valves or flappers on wells and exhaust tubes). Installation of wells through waste rock can be done efficiently with air rotary drilling systems. Thus, the implementation of the system does not require complex operations.
A multi-well pilot gas venting system will be implemented by Wismut GmbH to get additional data for full scale implementation of this new radon flux remediation measure at uranium waste rock dumps.
7 CONCLUSION
The differential pressure and radon flux measurements made by Wismut GmbH on dump 38neu provide a novel and powerful way to calibrate the numerical modeling of gas flow in a waste rock dump, without the need to drill observation boreholes. The data are consistent and provide clear indications of gas flow conditions in the dump. Radon gas concentrations and fluxes can also be
used to further constrain the model and provide another estimate of the air permeability of the cover that is coherent with field measurements.
A simplified base case model representing only the bulk waste rock properties under the soil cover was used to develop a base case simulation that could be calibrated against the differential pressure measurements. A final base case model was then developed by distinguishing “regular” waste rock, a high permeability waste rock boulder layer at the base of the dump and natural materials underlying the waste rock. This final base case reproduces the gas velocity of a tracer experiment as well as the radon fluxes measured by Wismut GmbH at the base of the dump.
Modeling shows that preferential gas entry and exit occur on the top surface of the dump and on its lower slope. However, the highest differential pressures are present near the base of the dump, thus favoring higher radon gas fluxes out of the dump at that location under high atmospheric temperatures. Within the dump, there is preferential flow and higher gas velocities in the boulder layer. These key features of gas flow have to be taken into account in the design of radon flux mitigation approaches.
Based on the simulation results, a simulation program was carried out to represent potential radon flux mitigation options. Venting wells located under the bench of measure point 1236 proved to be the only potentially efficient radon flux mitigation option. Such venting wells would remain efficient even if there were some degradation of the soil cover. However, the soil cover has to remain effective, through maintenance if need be, in order to prevent a future increase in gas flow through the cover. A multi-well pilot gas venting system will be implemented by Wismut GmbH to get additional data for full scale implementation of this new radon flux remediation measure.
Results obtained from simulations of potential radon gas mitigation options provide further insight on the gas flow behavior in dump 38neu. These simulations show the important role of the boulder layer in controlling gas flow in the dump, which leads to difficulties in controlling gas flow using measures only aimed at the dump surface, such as openings in the cover. An important implication of the simulation results also concerns the role played by the soil cover on the overall gas flow through the dump. Although the soil cover in its present state is found to be somewhat degraded (higher air permeability), it still limits gas circulation through the dump. It is thus necessary to limit important long-term degradation of the cover, through maintenance or the prevention of bioturbation.
ACKNOWLEDGEMENTS
Wismut GmbH is acknowledged for supporting this work and granting permission to publish. From Wismut GmbH, J. Regner, Ch. Schramm, M. Speer, Dr. P. Schmidt and Dr. M. Paul directly contributed to this work.
REFERENCES
Lahmira, B., Lefebvre, R., Hockley, D., Phillip, M., 2009. Sullivan mine fatalities incident: Numerical modeling of gas transport and reversals in flow directions. 8th
ICARD International Conference on Acid Rock Drainage, Skelleftea, Sweden, June 22-26, 2009.
Lefebvre, R., Lahmira, B., Gabriel, U., 2011b. Numerische
Modellierung der Luftströmung in Halde 38neu [In
German]. INRS research report R-1207, submitted to Wismut GmbH, March 2011, 47 p. and appendix, ISBN 978-2-89146-635-6.
Lefebvre, R., Lahmira, B., Gabriel, U., 2011a. Numerical
modeling representing air flow in waste dump 38neu.
INRS research report R-1206, submitted to Wismut GmbH, February 2011, 35 p. and appendix, ISBN 978-2-89146-634-9.
Lefebvre, R., 2010. Écoulement multiphase en milieux
poreux [in French]. Graduate course notes, 7th ed., Course GEO-9602/GLG-65146, Joint graduate program of Université Laval and INRS, INRS, Centre Eau Terre Environnement, 371 pp.
Lefebvre, R., Lamontagne, A., Wels, C., Robertson, A.MacG., 2002. ARD Production and Water Vapor Transport at Questa Mine. In Tailings and Mine Waste
'02, Proceedings of the Ninth International Conference
on Tailings and Mine Waste, Fort Collins, Colorado, 27-30 Jan. 2002, A.A. Balkema Pub., 479-488. Lefebvre, R., Hockley, D., Smolensky, J., Lamontagne,
A., 2001. Multiphase transfer processes in waste rock piles producing acid mine drainage, 2: Applications of numerical simulations. J. of Contaminant Hydrology, 52 (1-4), 165-186.
Wismut GmbH, 2011. Nachhaltigkeit und Langzeitaspekte bei der Sanierung von Uranbergbau-und Aufbereitungsstandorten [In German]. Proceedings des Internationalen Bergbausymposiums WISSYM_2011, Ronnenburg, May 25-27, 2011, ISBN 978-3-00-034226-4, 434 p.