Response of the Ha! Ha! River to the flood of July 1996
in the Saguenay Region of Quebec: Large-scale
avulsion in a glaciated valley
M. F. Lapointe,
1Y. Secretan,
2S. N. Driscoll,
1N. Bergeron,
3and M. Leclerc
2Abstract.
Modifications to valley form due to extreme flooding in the lower 34 km of the
Ha! Ha! River were analyzed. Heavy regional precipitation in July 1996 triggered extreme
runoff and the catastrophic drainage of Ha! Ha! Lake, producing discharges of 1100 m
3/s,
8 times the 100-year flood. Dominant valley modifications, revealed by comparing preflood
and postflood topographies derived photogrammetrically, were related to two large-scale
avulsions; in particular, a deep retrogressive incision which bypassed the 30-m-high Perron
Falls, exporting 6
3 10
6m
3of glacial stratified drift from a 2-km section of valley and
producing massive sedimentation in the reach downstream. Reconstructed maximum flow
power values support the existence of a 300 W/m
2threshold for major scouring of the
alluvial valley bottom. The evidence highlights the potential for massive scour and fill and
reorganization of the long profile, with potentially catastrophic effects on infrastructure,
during extreme floods in glaciated valley settings.
1. Introduction
In a classic paper, Wolman and Miller [1960] argued that river channel shape is adjusted to relatively frequent, moderate amplitude runoff events rather than to extreme, low recurrence floods. Admittedly, many extreme floods that have occurred in well-vegetated lowland valleys have left little lasting impact on the landscape [Wolman and Eiler, 1958; Costa, 1974; Gupta and Fox, 1974; Moss and Kochel, 1978]. Yet numerous other case studies have highlighted the strong formative role of extreme floods given particular geomorphic settings [Hack and Goodlett, 1960; Williams and Guy, 1973; Costa, 1978; Gupta, 1983; Jarrett and Costa, 1986; Osterkamp and Costa, 1987; Kochel, 1988; Patton, 1988; Ritter, 1988; Pitlick, 1993]. Part of the variability in geomorphic effects of extreme floods reflects climatological contrasts which affect vegetation cover and soil erodibility on valley bottoms and slopes [Wolman and Gerson, 1978; Schumm and Lichty, 1963]. Also important, however, are variations in local flood hydraulics and valley side sediment supply determined by the geomorphic setting [Nanson, 1986; Baker, 1977; Kochel, 1988; Miller, 1995]. Analyzing the evi-dence of flood impact variability, Miller [1990] and Magilligan [1992] found that the variable geomorphic effects of a partic-ular flood are determined by the spatial distribution of unit flow power among individual reaches, a variable largely con-trolled by peak flood discharge as well as valley bottom width and slope. Both these authors propose that in humid alluvial valley settings, large-scale floodplain stripping and channel widening are observed where valley bottom geometry is such that flood flow power exceeds a threshold of 300 W/m2.
This study analyses the impacts on the lower 34 km of the
Ha! Ha! River valley due to the catastrophic flood that oc-curred in July 1996 in the Saguenay region of Quebec. Al-though triggered by an extreme precipitation event the flood magnitude in this valley section was amplified by the effects of a disastrous reservoir breach episode, resulting in a peak dis-charge of 8 times the 100-year flood. Flood hydraulics and geomorphic effects of particular reservoir breach events are presented by Jarrett and Costa [1986], Blair [1987], Costa [1988], Pitlick [1993], Walder and Costa [1996], and Walder and O’Conner [1997]. The type and degree of valley modifications caused by the Ha! Ha! River flood event were remarkably variable among neighbouring reaches, ranging from 5 to 10 m incision to 3–4 m aggradation to 100-meter scale widening. This study focuses on describing and explaining these contrasts in valley modification in light of the variation in geomorphic setting along the river and by reconstructing the peak flow power levels and sediment budgets for the various reaches.
2. Flood Event and Study Site
On July 18, 1996, a small low-pressure system that had orig-inated over Manitoba, Canada, rapidly deepened as it moved northeastward beyond Lake Ontario, undergoing a sea level pressure drop of 20 mbar in 24 hours [Yu et al., 1997]. Over the next 2 days, the movement of this intense system slowed and then stalled over the Gaspe´ Peninsula of Quebec causing 48 hours of intense precipitation, particularly concentrated over the Saguenay region and eastward along the lower North Shore of the Gulf of St. Lawrence. Near Chicoutimi, 48-hour precipitation totals of 210 mm (Figure 1) were 2 to 3 times greater than the maximum over 120 years of record. Total accumulation averaged 200 mm over the 5000 km2 area of
most intense precipitation. Peak precipitation reached 280 mm on the windward side of the mountainous, high-plateau region culminating at over 1000 m above sea level (asl), south of the Saguenay River. Because of a wet, early summer and high antecedent moisture conditions, this precipitation event caused widespread flooding in the steep catchments with thin soils that drain northward toward tidewater along the
1Department of Geography, McGill University, Montreal, Quebec,
Canada.
2INRS Eau, University of Quebec, Quebec, Canada.
3INRS Georessources, University of Quebec, Quebec, Canada.
Copyright 1998 by the American Geophysical Union. Paper number 98WR01550.
0043-1397/98/98WR-01550$09.00
Saguenay River and Fjord. In these basins storm runoff aver-aged 65–70% of precipitation and peak specific discharges were generally 0.63– 0.70 m3/(km2 s). The resultant floods
caused over Canadian $800 million in damages to eight com-munities bordering the Saguenay River. Some of the most dramatic damages occurred near the industrial town and port terminal of La Baie, at the mouth of the Ha! Ha! River.
The Ha! Ha! River drains a 610 km2catchment and reaches
tidewater at the head of the Saguenay Fjord, 20 km east of Chicoutimi. Most of the drainage basin consists of a 300–500 m high plateau, with summits over 800 m asl, underlain by granitic and gneissic rocks from the Grenville Province of the Canadian Shield. Glacial till and occasional fluvioglacial de-posits mantle the Pre-Cambrian bedrock. Immediately after deglaciation, ;10 ka ago, a marine transgression occurred onto the isostatically depressed land mass along the margin of the Saguenay River valley. This led to the accumulation of up to 180 m of clays, currently prone to landsliding. In some tributary valleys, including sections of the lower Ha! Ha! River valley, these clays may be locally overlain by stratified deltaic beds, formed near the inland margins of the late-glacial marine body.
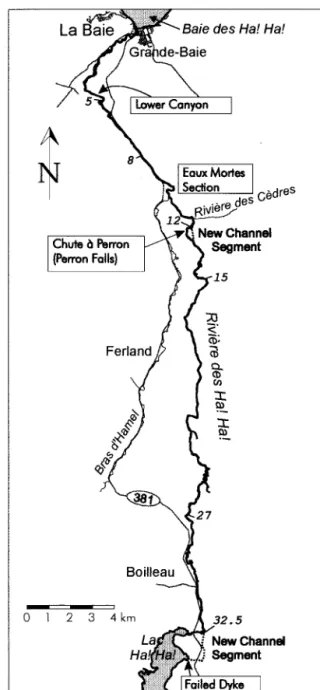
As is commonly the case in glaciated river valleys (i.e., val-leys formerly affected by glaciers), the long profile of the Ha! Ha! River is held up in certain locations by outcrops of bedrock or coarse glacial deposits, producing strong contrasts in river slope and sedimentology. These contrasts played a strong role in controlling the geomorphic responses to the July 1996 flood. Two dominantly sandy reaches with slopes of 0.1% lie just upstream of such lithologic controls (Figure 2; the Boilleau reach, km 32–27 from the mouth, and the Eaux Mortes reach, km 12–8). Between these two sandy reaches lies a 12-km sec-tion dominated by bedrock canyons with mean slope of 1.3%. The last 5 km of river before tidewater was a boulder domi-nated sequence of rapids with a mean slope of 2%, an energy gradient twenty times greater than that found in the sandy Eaux Mortes reach only 3 km upstream.
Ha! Ha! Lake, at ;380 m asl, lies halfway between the headwaters and the mouth of the river. The lake was originally
dammed by a local forestry company to regulate the water supply to its mill downstream. Early in the runoff event, the rising level of the reservoir led to the failure of an earthen dike containing the lake. Over the next 18 hours, 26 million m3of
lake water drained into the lower Ha! Ha! River valley while a new, 1.5-km-long section of channel was scoured through for-est, between the dike and the pre-existing lake outlet channel (see Figure 2). Upstream from the lake, the river runs through undeveloped forest land. This study focuses on the 34 km of valley, from the Ha! Ha! Lake outlet to the Saguenay Fjord, where roads and populations are most concentrated and where the bulk of the flood damages were noted.
The gauging station on the Lower Ha! Ha! River was de-stroyed early in the flood. However, a reconstruction of the
Figure 2. The Lower Ha! Ha! River, Quebec, Canada, along with tributaries and adjacent roads and towns. General char-acteristics of the various reaches are given in the text. Two new channel segments, scoured by the flood of July 1996, are indi-cated with dotted lines. Italicized numbers refer to river kilo-meter points discussed in the text.
Figure 1. Forty-eight hour precipitation totals for eastern Quebec, Canada, from 8:00 a.m. July 19 to 8:00 a.m. July 21, 1996. The storm system triggered catastrophic flooding in the Ha! Ha! River basin, Quebec, Canada, as well as in basins throughout the Saguenay Region.
flood hydrograph was conducted by INRS-Eau for a public inquiry into the flood [Government of Quebec, 1997], providing a relatively reliable estimate of the peak discharge for the Lower Ha! Ha! River. Precipitation fields were interpolated for the entire Saguenay Region using hourly precipitation to-tals from 10 meteorological stations. One of these stations is located directly within the Ha! Ha! Basin and four others are distributed within 25 km around the basin. The Lower Ha! Ha! River flood hydrograph (Figure 3) was reconstructed from two components: the Ha! Ha! Lake drainage event and the direct storm runoff from the basin. The lake drainage component was estimated from dam records and from several eye witness accounts of lake levels during the period of July 19–20. The “storage volume-water level” relation for the drained lake was obtained photogrammetrically.
Ha! Ha! Basin storm runoff was reconstructed using the “Cequeau” runoff model, a distributed model that factors spa-tial and temporal variability in physiography, precipitation and soil characteristics to route storm runoff downstream [Morin et al., 1995; World Meteorological Organization, 1992]. Soil param-eters for the Ha! Ha! Basin simulations were calibrated to those developed for the same flood in the Kenogami Reservoir Basin, 20 km to the west, where both precipitation and flood hydrograph data were available, the latter from continuous spillway records.
For the Lower Ha! Ha! River the lake drainage component dominated the flood hydrograph (Figure 3), accounting for .80% of the peak flow of ;910 m3/s in the valley below the
lake [Government of Quebec, 1997]. Discharges from tributar-ies, estimated by the runoff model, raised the peak flow esti-mate for the lower 10 km of the valley to approxiesti-mately 1100 m3/s, attained on the evening of July 20. At the basin mouth
this peak discharge estimate, including reservoir drainage, cor-responds to a specific discharge of 1.8 m3/(km2 s). Historical
gauge records show that, in the lower Ha! Ha! River valley, the mean annual flood is 70 m3/s and the 100-year flood is 130
m3/s. The catastrophic flow of July 1996 in the Lower Ha! Ha!
River valley was thus over 15 times the mean annual flood and 8 times the 100-year flood.
3. Methods
Following the recession of flood waters, field visits, air photo analysis and interviews with local inhabitants were conducted to observe the nature and scale of morphological changes to the lower Ha! Ha! River valley. The postflood channel was inspected on foot and recorded on video tape downstream from Ha! Ha! Lake (km 34–27) and from the Eaux Mortes Section to the mouth (km 10–0). Evidence of major debris jams and recent large-scale erosion and deposition was noted. The general caliber of postflood alluvium was mapped, and the nature of valley wall stratigraphy, where exposed, was re-corded. Estimates of maximum stage levels were available for numerous locations along the valley, based on local evidence of flood disturbance or debris in the floodplain as well as on high water marks on houses and other structures [INRS-Eau, 1997]. The primary data on flood effects presented below are based on vertical air photo coverage. Air photo sequences at a scale of 1;15,000 were available for July 1994 (preflood) and for late July 1996 (10 days after the flood peak). Two sets of ground coordinates (preflood and postflood) for the entire river valley below Ha! Ha! Lake were compiled by a commercial firm using computer-assisted photogrammetry. To this end, a field
sur-veying campaign was first conducted to georeference air pho-tos using ground control points located with centimetre accu-racy using differential GPS. Ground coordinates along a dense grid concentrated on the valley bottom and sides were then extracted photogrammetrically from the geo-adjusted stereo models. Given the 1;15,000 scale of the photos and the quality of the ground control, this technique allows ground elevations (preflood and postflood) to be determined to;0.75 m accu-racy, with elevation errors that are independent among sound-ing points. The available data points for 1994 and 1996 (30,800 points and 40,800 points, respectively) provided an efficient method to assess altitudinal and volumetric changes along the entire 34 km valley. The depth of the low flow channel, inac-cessible to photogrammetric measurement, was characterized through field observation (postflood) and historical records (preflood).
A digital terrain model was developed from the raw photo-grammetric data using a graphical data preparation software for hydraulic simulation, called “Modeleur” [Leclerc et al., 1996; Gauthier et al., 1997]. On the basis of raw photogram-metric data points, the Modeleur constructs an irregular trian-gular Delauney network [Baker, 1987] allowing for the linear interpolation of elevations over each triangular surface bounded by data points. The two terrain models (preflood and postflood) may then be compared. The uncertainty in local vertical changes is of the order of 1.5 m; however, estimates of average changes over wide areas are more accurate. Total volumes of erosion and deposition per 1-km valley segment were computed using the Modeleur’s spatial integration tools. The water surface elevation at peak flow was reconstructed based on ;40 observations of peak stages along the valley [INRS-Eau, 1997]. In such catastrophic floods, it is impossible to know to what extent massive morphological change to the valley had progressed when peak stages occurred. Because of the indeterminate nature of the bed topography throughout the event, two-dimensional simulations of the flood hydraulics could not be attempted; instead, both the preflood and post-flood valley topographies were used to make a simple
one-Figure 3. Reconstructed flood hydrograph at the outlet of Ha! Ha! Lake and hourly precipitation totals for the basin during the period July 19–22, 1996 [adapted from Government of Quebec [1997]. The flows resulting from the catastrophic drainage of Ha! Ha! Lake are represented by the thick curve, superposed on the direct storm inflow to the lake.
dimensional estimation of peak flood hydraulic parameters. For this purpose the peak water surface, interpolated from maximum stage observations, was overlain onto both preflood and postflood valley topographies to compute, over 1-km valley segments, maximum and minimum possible values of mean flow width (W), depth (H), mean bed shear stress (t), and unit flow power (v), where
t 5 gHS v 5 ~gQS!/W 5 tV
whereg is the unit weight of water, S is the energy slope, and V is the mean velocity. Peak discharge data (Q) were taken from the reconstructed flood hydrograph at the lake outlet (Figure 3) and augmented downstream by runoff model esti-mates for peak inflow from the various tributaries. We believe that the calibrated reconstructions of flood runoff and the lake drainage hydrograph used here provide a more reliable esti-mate of peak flood discharge than are generally possible using field evidence (via the slope-area method) from extreme floods. The large uncertainties about the phase of valley mod-ification at the time of the peak stages, compounded upstream by evidence of debris jams, precluded the use of the slope-area method anywhere in the lower Ha! Ha! valley. The dominant uncertainty on the resultant estimates of peak shear stress and flow power relate to the indeterminate nature of the valley geometry at peak flows, a factor which is quantified in the hydraulic reconstructions presented here.
4. Results
4.1. Geomorphological Changes to the Lower Ha! Ha! River Valley
4.1.1. Dike failure and sedimentation in the Boilleau reach (km 34 –27). Immediately below Ha! Ha! Lake, a new 2 km long and 90 m wide channel was cut into the forest floor,
connecting the failed dike to the previous lake outflow channel (see Figure 2). This channel incised vertically up to 15 m into the gravely sands underlying the forest, washing out a section of highway 381. Large volumes (quantified later) of sediment and forest debris were exported into the relatively low-energy, sandy Boilleau reach (gradient of 0.1%) immediately down-stream (km 32.5–27). Sandy gravel accretion was most intense where the new channel joins the previous lake outflow (km 32.5), giving this sector a braided appearance after the flood. In the remainder of the Boilleau reach below km 32, the domi-nant modification was in-channel blanket deposition of sands, with overbank muds mantling village roads and surrounding farm fields. No cutoffs occurred in the preexisting meandering channel pattern; although, due to sand aggradation, the low flow channel became shallower with fewer pools. Except near a couple of debris jams, riparian shrubs and trees were left generally intact throughout this reach, albeit with decimetres of fresh sand accretion at their base. The lower limit of the Boilleau reach at km 27 is marked by bedrock outcrops on the valley floor, followed by a 15-m-high set of falls. This point marks the head of a 12-km-long reach (km 27–15) dominated by canyons and two other 20 to 40-m-high falls. Airphoto analysis indicates that this canyon reach underwent general scouring of the few extant patches of floodplain down to bed-rock.
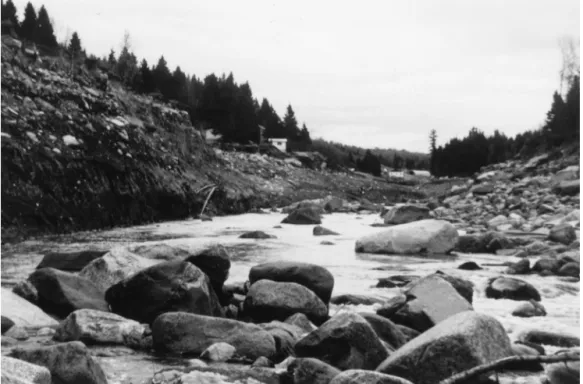
4.1.2. Massive Avulsion at Perron Falls and sedimentation in the Eaux Mortes Section (km 15– 8). The most extreme geomorphological changes occurred as a result of an avulsion (rapid shift to an alternate river course) in the vicinity of “Chute a` Perron” (Perron Falls; see Figure 2). Just upstream of this narrow, bedrock controlled, 30-m-high set of falls, flood waters reached 200 m asl, a level exceeding the falls crest by 8 m. At this stage the flow was able to divide around the bedrock hill flanking the falls to the east, and spill into the Figure 4. The Ha! Ha! River viewed downstream (northwards) towards Perron Falls after the recession of
the extreme flood waters of July 1996. The flood triggered a large avulsion (foreground) which bypassed the 30-m rocky falls, located to the west (left) of a bedrock hill, vertically incising over tens of meters into glacial deposits. The low gradient Eaux Mortes reach appears in the background.
valley of a small tributary lying beyond the hill. This alternate flow path ran through an area underlain by sand-rich glacial deposits, tens of meters thick, which also extend up the Ha! Ha! valley over many kilometres. These stratified gravely sands are part of a late-glacial deltaic fill occupying part of the pre-glacial river valley. The fine texture of sediments underlying this side of the hill, in combination with the strong valley slope across the 30-m-high falls, led to the rapid 20-m vertical inci-sion of a new 150-m-wide channel. This channel captured all the flood flow causing the river to rapidly avulse to the east side of the hill (Figure 4). In effect, because of extraordinarily high stages, the flood flows of July 1996 were able to reach an alternate path downvalley abandoning the bedrock control on which the post-glacial river course had become stuck at the Perron Falls. Figure 5 displays the valley modifications sur-rounding this avulsion, superimposed on the pre-flood course of the river and its tributaries. The striking effect of this avul-sion on the river long profile in the vicinity of Perron Falls is also visible in Figure 6. Upstream of the avulsion, deep bed incision retrogressed over 2 km into the fluvioglacial sand fill before encountering a rocky rapids section, near km 15. Down-stream of the avulsion, the low-energy (gradient of 0.1%), partly meandering Eaux Mortes reach experienced massive
sand accretion (Figures 5 and 6). Blanket aggradation on the channel bed and surrounding floodplain averaged as much as 3 m. Parked vehicles and house foundations were buried in flood sediments, and three bridges were washed out in this reach.
4.1.3. Incision above the Lower Canyon (km 8 –5). Prior to the flood, the Eaux Mortes section was followed down-stream by a higher-energy, bouldery reach (gradient of 1.7%) which extended through a relatively confined valley down to km 5, at which point the 200-m long, bedrock Lower Canyon controlled the valley bed elevation (Figures 2 and 6). During the flood, vertical incision occurred along much of this higher-energy reach. Incision also propagated retrogressively up-stream to km 8, triggering considerable bed lowering in the lower 1 km of the low-gradient Eaux Mortes reach (Figure 6). Near km 7, the flood caused up to 10 m of valley incision, generally leaving a boulder pavement overlain with a lag of 2–3 m glacial drift boulders. Locally, incision in this reach also exposed bedrock and consolidated marine clay strata. Moder-ate valley widening accompanying this deep incision destroyed a section of road and most residential properties along a 2 km section adjacent to the right bank (Figure 7). Just upstream of
Figure 5. Valley modifications in the vicinity of Chute a` Perron (Perron Falls) and the Eaux Mortes Section of the Ha! Ha! River, obtained by subtracting postflood from pre-flood valley terrain models, obtained photogrammetrically.
the Lower Canyon, a low-head, concrete water storage dam was toppled and bypassed on both sides during the flood.
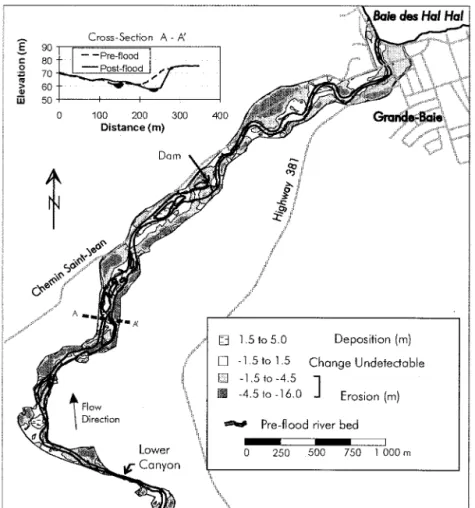
4.1.4. Widening and incision below the Lower Canyon (km 5– 0). Downstream from the narrow Lower Canyon, the pre-flood channel maintained a high bed slope of 2% down to the town of La Baie (Figures 2 and 6). The only break in this strong energy gradient lay behind a second low head dam (km 1.7) also toppled by the flood. In contrast to the deep incision that occurred upstream between km 8 and 5, dominant changes to this moderately sinuous section of river were the complete stripping of the floodplain and large scale retreat of the clayey terraces fringing the valley floor. The thalweg generally incised 1–2 m, limited in many places by the proximity of bedrock (see
Figure 6). Incision reached 5–6 m between bedrock outcrops at km 1.7 (the dam site) and at km 3.2, where a new 5 m high fall created a knickpoint in the postflood profile. The flood left an active channel zone with poorly sorted alluvial bars (gravels and abundant sands, embedded with boulders up to 1 m in diameter). Approaching Grande-Baie, lateral terrace retreat carried away numerous houses and farms which previously flanked the left valley wall. Overall, channel zone widening reached 250 m. The pattern of terrace retreat on alternating sides of the valley, indicated in Figure 8 as zones with 4.5 to 16 m of valley bed lowering, reveals the longer wavelength sinuosity of the high-velocity flood flow, compared to the tighter sinuosity of the original channel pattern (outlined). A considerable portion of the Grande-Baie section of La Baie, including residences, businesses, and bridges, was entirely washed out in this reach (Figure 9).
4.2. Downvalley Patterns in Sediment Transport and Flood Power
Figure 10 presents a distributed sediment budget, showing net erosion and deposition volumes for 1 km valley segments, calculated in the Modeleur as the difference in elevation be-tween preflood and postflood valley geometries obtained pho-togrammetrically. Overall, valley scour was the dominant pro-cess. The avulsion at Perron Falls, with the retrogressive channel incision it triggered upstream (segments 13–15), was by far the dominant locus of scour, exporting approximately 6 million m3of sediment downstream. Sedimentation volumes in
the Eaux Mortes section (segments 9–12) were considerable (1.5 million m3) although much smaller than upstream scour
volumes. A secondary locus of intense valley scour occurred upstream in the new channel section just below Ha! Ha! Lake (segments 34–35) which exported 1 million m3 of sediment
downstream. Blanket sedimentation of fine sediments in the
Figure 6. Preflood and postflood long profiles of the section of the Lower Ha! Ha! River from upstream of Chute a` Perron (Perron Falls) down to tidewater at Baie des Ha! Ha! (at km 0). Elevations are those of the low flow channel surface ex-tracted from preflood and postflood terrain models.
Figure 7. Upstream view of the Ha! Ha! River in the vicinity of km 7, after recession of the flood. Several houses and a section of highway on the right bank (left portion of photo) were carried away when floodwaters caused widening and up to 10 m of vertical incision, leaving behind a coarse bed armour (foreground boulders ;750 mm) and oversteepened valley sides.
Boilleau reach just downstream (km 28–32), although wide-spread, was under 0.25 million m3. In the last 6 km of valley,
leading down to tidewater, significant patches of accumulation occurred on the valley bottom but these were more than bal-anced by scour of the valley sides. A net total of over 9 million m3were exported from the lower 34 km of the Ha! Ha! River
valley and into the Saguenay Fjord. Assuming an average bulk density of 1.6 t/m3, this represents the export of;15 million
metric tons of sediment, two thirds of which can be traced to the Perron Falls avulsion event. Despite the lack of historical sediment load data, an order of magnitude estimate of the preflood yearly sediment load at the mouth of the Ha! Ha! River can be attempted. Given a mean flow at the mouth of 8 m3/s and assuming a generous upper bound (100–500 mg/l) for
the average (discharge weighted) yearly suspended sediment concentration in this boulder-dominated system, the annual sand export was at most in the range of 20–130 thousand tons. This is between two and three orders of magnitude less than the flood sediment export at the mouth due to the July 1996 flood (15 million cubic tonnes). Recent oceanographic surveys reveal that a multidecimeter thick wedge of sand and mud was deposited many kilometers into Ha! Ha! Bay by this flood.
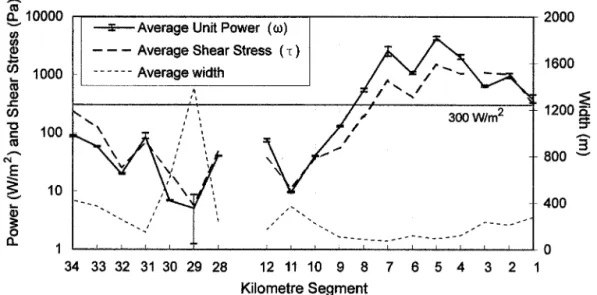
Figure 11 illustrates the downvalley variation in estimated peak stresses, flood powers, and flood-zone width. Error bars on the flood power estimates reflect the uncertainties about valley bottom geometry at the time of the peak flow (see Methods). By definition, shear stress and unit power are highly correlated variables and their overall patterns are consistent.
The most devastating flood powers (v), ranging from 1000 to 4500 W/m2 (t 5 300–1500 Pa) occurred in the steep and
narrow valley sections from km segments 3–7. Except where bedrock dominated (km 3.2–4.7), this reach experienced up to 6–10 m of bed incision, combined with large-scale valley wid-ening. The lack of data on the median sediment caliber for the highly unsorted bars in this reach precludes any detailed as-sessment of critical stresses required for entrainment of the coarsest boulders [Komar, 1996]; however, reconstructed shear stresses of the order 1000 Pa are clearly compatible with the transport of the metric boulders embedded in a sandy-gravel bar matrix. Within the low gradient Boilleau and Eaux Mortes reaches, where riparian vegetation was preserved and large-scale sand deposition was observed (Figure 10), peak flood power was almost two orders of magnitude smaller (10–100 W/m2;t 5 10–70 Pa; Figure 11).
5. Discussion
The catastrophic 1982 Lawn Lake flood [Jarrett and Costa, 1986; Pitlick, 1993], like the Ha! Ha! River flood, was triggered by the failure of an earthen dike at an artificial impoundment. These floods vividly illustrate the hazards posed by such res-ervoir failures in steep mountain terrain and the critical control exerted by preflood valley slope. In both cases, the flood pro-duced massive incision in the high-gradient reaches, while lower gradient reaches were mantled in flood alluvium.
The evidence presented here is generally consistent with a
Figure 8. Valley modifications in the lower 5 km of the Ha! Ha! River, obtained by subtracting postflood from preflood valley terrain models, obtained photogrammetrically. Terrace retreat appears as patches of 4.5–16 m erosion.
threshold of around 300 W/m2above which Miller [1990] and
Magilligan [1992] observed large-scale stripping of valley bot-tom sediments in their studies. Two short reaches appeared to have experienced peak powers in the vicinity of the proposed 300 W/m2threshold (Figure 11): segment 8 at the toe of the
Eaux Mortes reach, and segment 1 near the river mouth. The former reach underwent valley bottom erosion and limited thalweg incision (Figures 6 and 10), while terrace retreat and floodplain scouring clearly affected the latter (Figures 8, 9, and 10). Between km 7 and 1, where the strength of the flood in the valley of the Ha! Ha! River far exceeded the 300 W/m2
thresh-old, substantial valley widening and lowering of the thalweg occurred wherever bedrock did not impede (Figures 6, 8, and 9). Conversely, in the Boilleau and Eaux Mortes reaches where unit flood power was generally under 100 W/m2, field evidence
indicates that the hydraulic power of this immense flood flow was insufficient to erode floodplain soils and vegetation.
Instead, large-scale deposition occurred on the bed and floodplain in both these low energy reaches (Figure 10). Both reaches received, within a few hours, millions of cubic metres of sandy sediment from the deep incision of new kilometer-long channels just upstream. In each case, the river avulsion and the incision of a new channel had been triggered by the extreme runoff event. At Perron Falls, the flood allowed the river to abandon a higher elevation section of valley on which glacial events had trapped it (Figures 4 and 6). At Ha! Ha! Lake, the dammed and heightened reservoir outlet was aban-doned for a lower elevation outlet through a failed dike (Fig-ure 2). In both cases, the new channel courses lay over easily eroded materials, highly susceptible to incision once exposed to large flows.
Miller [1995] argued that valley bottom erosion can be
par-Figure 9. Aerial photographs of the lower 2.5 km of the Ha! Ha! River valley from May 24, 1994 (preflood; left) and July 30, 1996 (postflood; right). Considerable sections of the town of Grande-Baie (top of photos) and connecting roads were washed out during the extreme flooding of late July 1996.
Figure 10. Net erosion and deposition in the Lower Ha! Ha! River valley due to the extreme flooding of July 1996, based on comparisons of preflood and postflood terrain models. Kilometre segments are numbered from the mouth (e.g., segment 1 refers to km 0–1). Segment 35 denotes the valley segment between km 34 and Ha! Ha! Lake (at km 34.3).
ticularly intense just downstream of a sudden valley expansion, due to a local amplification in flood energy gradient and flow shear stresses. At locations of valley expansion on the Lower Ha! Ha! River, such as near km 1.0 (Figures 8 and 9), clear patterns of enhanced local bed incision could not be detected. Instead, the entire lower kilometer of valley (i.e., kilometer segment 1) underwent catastrophic terrace retreat. This wide-spread erosion reflects the high level of peak stresses through-out the lower valley (350 to over 1000 Pa), much in excess of the threshold for floodplain stripping of 100 Pa suggested by Magilligan [1992]. As a result of this widespread erosion, the last kilometer of the Ha! Ha! River valley experienced a con-siderable export of sediment (0.5 million m3from km segment
1; Figure 10) during the July 1996 flood.
6. Conclusions
Recent review papers on the geomorphic effectiveness of large floods [Baker and Costa, 1987; Kochel, 1988; Miller, 1990, 1995] strongly emphasize the control exerted on floodplain stability by spatial variations in sediment inputs from valley sides as well as local flood competence to scour vegetated valley bottom alluvium. Hydraulic reconstructions of the July 1996 Ha! Ha! River flood support a threshold of 300 W/m2for
widespread scour of alluvial deposits in valley bottoms. Fur-thermore, in certain settings, flooding can also trigger large-scale scour and fill sequences along the valley bottom, with downvalley gradients in flood transport capacity, rather than competence, controlling the flood modifications. Graf [1983] and Harvey [1984] highlighted the role of such capacity imbal-ances along river valleys and alluvial fans in semiarid environ-ments. Nanson [1986] emphasized the alternation of floodplain scour in narrow, confined valley sections and floodplain fill in wider valley reaches, due to floods in temperate zone mountain valleys of New South Wales.
The Ha! Ha! River study highlights the potential for massive long profile scour and fill when extreme floods cause avulsions in glaciated valleys. The extraordinary scale of the Lower Ha! Ha! River flood (with peak discharges almost an order of magnitude greater than the 100-year flood) coupled with the existence of critical control points where the Holocene long profile was, in effect, in unstable equilibrium, led to valley bottom modifications characterized by strongly incised reaches alternating with reaches smothered under flood alluvium. Such large-scale and variable effects can likely be triggered only by flood events which, under natural discharge regimes, would be of multimillenial recurrence period; although, the presence of water storage reservoirs, and the possibility of their failure, considerably enhance the likelihood of such extreme floods. The unusual convex long profile of the Lower Ha! Ha! River (Fig. 6), inherited from the late glacial period, amplified flood damages by concentrating flood power in the lower, most in-tensely developed reach of valley.
The potential for long profile instability is not unique to the Ha! Ha! River. In glaciated landscapes that underwent rapid ice retreat, complex glacial deposits such as lateral and end moraines and fluvioglacial fills may occur along valley bottoms [Sugden and John, 1976]. As a consequence of postglacial drainage disruption, Holocene river courses in such valleys are often punctuated by rapids or falls developed over coarse tex-tured moraine or bedrock, producing local convexity in the river long profile. In many cases these rapids or falls may be flanked by segments of the preglacial valley infilled with easily incised stratified glacial drift. The postglacial river landscape in Canada is dotted with examples of similar postglacial drainage disruptions, notably Niagara Falls upstream of Lake Ontario and Montmorency Falls near Quebec City [Bird, 1972]. In glaciated valleys, the dominant impacts of extreme floods can be avulsions involving permanent long profile readjustments through scour and fill around late-glacial drainage disruptions.
Figure 11. Estimates of Ha! Ha! River peak flood hydraulic parameters for 1 km valley segments. The plotted points for each parameter correspond to the average of two estimates, one assuming preflood topography and the other assuming postflood topography. The range of these estimates is shown for flow power. The 300 W/m2power threshold is marked by a horizontal line. Kilometer segments are numbered from
the mouth (e.g., kilometer segment 1 refers to km 0–1). Calculations of hydraulic parameters were omitted for segments 15–12, site of the Perron Falls avulsion and incision, due to the lack of water stage data appropriate to the valley incision phase. Peak stage data were unavailable for segments 27–16.
Acknowledgments. The authors would like to thank Joe¨lle Marion, Paul Boudreau, Yves Gauthier, and Christine Vaillancourt for their assistance in data treatment. We are grateful to J.-P. Villeneuve (di-rector) for his support while the senior author was visiting professor at the INRS-Eau. Finally, thanks to Jean Valle´e (Chicoutimi) for the use of his spectacular aerial photograph of the avulsion near Perron Falls.
References
Baker, T. J., Three dimensional mesh generation by triangulation of arbitrary point sets, AIAA Paper 87-1124-CP, 255–271, 1987. Baker, V. R., Stream channel response to floods with examples from
central Texas, Geol. Soc. Am. Bull., 88, 1057–1071, 1977.
Baker, V. R., and J. E. Costa, Flood power, in Catastrophic Flooding, edited by L. Mayer, and D. Nash, pp. 1–21, Allen and Unwin, Boston, 1987.
Bird, J. B., The Natural Landscape of Canada: A Study in Regional
Earth Sciences, 191 pp., John Wiley, New York, 1972.
Blair, T. C., Sedimentary processes, vertical stratification sequences, and geomorphology of the Roaring River alluvial fan, Rocky Moun-tain National Park, Colorado, J. Sediment. Petrol., 57, 1–18, 1987. Costa, J. E., Response and recovery of a Piedmont watershed from
tropical storm Agnes, June 1972, Water Resour. Res., 10, 106–112, 1974.
Costa, J. E., Colorado Big Thompson flood: Geologic evidence of a rare hydrological event, Geology, 6, 617–620, 1978.
Costa, J. E., Floods from dam failures, in Flood Geomorphology, edited by V. R. Baker, R. C. Kochel, and P. C. Patton, pp. 439–462, John Wiley, New York, 1988.
Gauthier, Y., Y. Secretan, and M. Leclerc, Construction d’un mode`le nume´rique d´ele´vation pour la`nalyse de crues majeures a` la`ide du logiciel Modeleur, paper presented at the 9th Symposium Interna-tional de Ge´omatique, Can. Cent. for Remote Sens. and Geomat., Canada, May 1997.
Government of Quebec, Commission scientifique et technique sur la gestion des barrages, report prepared for the Ministe`re du Conseil exe´cutif, Jan. 1997.
Graf, W. L., Variability of sediment removal in a semi-arid watershed,
Water Resour. Res., 19, 643–652, 1983.
Gupta, A., High magnitude floods and stream channel response, in
Modern and Ancient Fluvial Systems, edited by J. D. Collinson, and
J. Lewin, Spec. Publ. Int. Assoc. Sedimentol., 6, 219–227, 1983. Gupta, A., and H. Fox, Effects of high-magnitude floods on channel
form: A case study in the Maryland Piedmont, Water Resour. Res.,
10, 499–509, 1974.
Hack, J. T., and J. C. Goodlett, Geomorphology and forest ecology of a mountain region in the Central Appalachians, U.S. Geol. Surv.
Prof. Pap., 347, 66 pp., 1960.
Harvey, A. M., Geomorphological response to an extreme flood: A case from southeast Spain, Earth Surf. Processes Landforms, 9, 267– 279, 1984.
INRS-Eau, Simulation hydrodynamique et bilan se´dimentaire des rivie`res Chicoutimi et des Ha! Ha! lors des crues exceptionnelles de juillet 1996, INRS-Eau Rep. R487, 207 pp., Report prepared for the Comm. Sci. et Tech. sur la Gestion des Barrages, Quebec, Canada, 1997.
Jarrett, R. D., and J. E. Costa, Hydrology, geomorphology, and dam-break modelling of the July 15, 1982 Lawn Lake Dam and Cascade Lake Dam failures, Larimer County, Colorado. U.S. Geol. Surv. Prof.
Pap., 1369, 78 pp., 1986.
Kochel, R. C., Geomorphic impact of large floods: Review and new perspectives on magnitude and frequency, in Flood Geomorphology, edited by V. R. Baker, R. C. Kochel, and P. C. Patton, pp. 169–187, John Wiley, New York, 1988.
Komar, P. D., Entrainment of sediment from deposits of mixed grain sizes and densities, in Advances in Fluvial Dynamics and Stratigraphy, edited by P. A. Carling and M. R. Dawson, pp. 127–181, John Wiley, New York, 1996.
Leclerc, M., Y. Secretan, M. Heniche, and Y. Roy, Projet Me´trique: Bilan scientifique, Rapport d´etape #3 au Fonds de recherche et de de´ve´loppement technologique en environnement (MEF), Rep.
INRS-Eau R482, 237 pp., INRS-Eau, Quebec, Canada, 1996.
Magilligan, F. J., Thresholds and the spatial variability of flood power during extreme floods, in Geomorphic Systems, edited by J. D. Phil-lips and W. H. Renwick, Geomorphology, 5, 373–390, 1992. Miller, A. J., Flood hydrology and geomorphic effectiveness in the
central Appalachians, Earth Surf. Processes Landforms, 15, 119–134, 1990.
Miller, A. J., Valley morphology and boundary conditions influencing spatial patterns of flood flow, in Geophys. Monogr. Ser., vol. 89, pp. 57–81, AGU, Washington, D.C., 1995.
Morin, G., P. Paquet, and W. Sochanski, Le mode`le de simulation de quantite´ et de qualite´ CEQUEAU, Reference manual, Rapp. Rech.
433, 341 pp., INRS-Eau, Quebec, Canada, 1995.
Moss, J. H., and R. C. Kochel, Unexpected geomorphic effects of the Hurricane Agnes storm and flood, Conestoga drainage basin, south-eastern Pennsylvania, J. Geol., 86, 1–11, 1978.
Nanson, G. C., Episodes of vertical accretion and catastrophic strip-ping: A model of disequilibrium flood-plain development, Geol. Soc.
Am. Bull., 97, 1467–1475, 1986.
Osterkamp, W. R., and J. E. Costa, Changes accompanying an extraor-dinary flood on a sand-bed stream, in Catastrophic Flooding, edited by L. Mayer and D. Nash, pp. 201–224, Allen and Unwin, Boston, Mass., 1987.
Patton, P. C., Geomorphic response of streams to floods in the glaci-ated terrain of southern New England, in Flood Geomorphology, edited by V. R. Baker, R. C. Kochel, and P. C. Patton, pp. 261–278, John Wiley, New York, 1988.
Pitlick, J., Response and recovery of a subalpine stream following a catastrophic flood, Geol. Soc. Am. Bull., 105, 657–670, 1993. Ritter, D. F., Floodplain erosion and deposition during the December
1982 floods in southeast Missouri, in Flood Geomorphology, edited by V. R. Baker, R. C. Kochel, and P. C. Patton, pp. 243–259, John Wiley, New York, 1988.
Schumm, S. A., and R. W. Lichty, Channel widening and flood-plain construction along Cimarron River in southwestern Kansas, U.S.
Geol. Surv. Prof. Pap., 352-D, 71–88, 1963.
Sudgen, D. E., and B. S. John, Glaciers and Landscape, 376 pp., Edward Arnold, London, 1976.
Walder, J. S., and J. E. Costa, Outburst floods from glacier-dammed lakes: The effect of mode of lake drainage on flood magnitude,
Earth Surf. Processes Landforms, 21, 701–723, 1996.
Walder, J. S., and J. E. O’Connor, Methods for predicting peak dis-charge of floods caused by failure of natural and constructed earthen dams, Water Resour. Res., 33, 2337–2348, 1997.
Williams, G. P., and H. P. Guy, Erosional and depositional aspects of hurricane Camille in Virginia, 1969, U.S. Geol. Surv. Prof. Pap., 804, 80 pp., 1973.
Wolman, M. G., and J. P. Eiler, Reconnaissance study of erosion and deposition by the flood of August, 1955, Eos Trans. AGU, 39, 1–14, 1958.
Wolman, M. G., and R. Gerson, Relative scales of time and effective-ness of climate in watershed geomorphology, Earth Surface
Pro-cesses, 3, 189–288, 1978.
Wolman, M. G., and J. P. Miller, Magnitude and frequency of forces in geomorphic processes, J. Geol., 68, 54–74, 1960.
World Meteorological Organization, Simulated real time intercom-parison of hydrological models, Oper. Hydrol. WMO 779, Geneva, Switzerland, 1992.
Yu, W., C. A. Lin, and R. Benoit, High resolution simulation of the severe precipitation event over the Saguenay, Quebec, region in July 1996, Geophys. Res. Lett., 24(15), 1951–1954, 1997.
N. Bergeron, INRS Georesources, Complexe Scientifique, 2700 Ein-stein Road, POB 7500, St. Foy PQ, Canada G1V 4C7.
S. N. Driscoll and M. F. Lapointe, Department of Geography, McGill University, 805 Sherbrooke Street West, Montreal, Quebec, Canada H3A 2K6. (e-mail: [email protected])
M. Leclerc and Y. Secretan, INRS Eau, 2800, rue Einstein, POB 7500, Sainte-Foy, Quebec, Canada G1U 4C7.
(Received September 8, 1997; revised April 23, 1998; accepted May 7, 1998.)