Any correspondence concerning this service should be sent to the repository administrator:
[email protected]
Official URL:
http://www.iahr.org/site/cms/contentCategoryView.asp?category=82
This is an author-deposited version published in:
http://oatao.univ-toulouse.fr/
Eprints ID: 9014
To cite this version:
Cassan, Ludovic and Belaud, Gilles Experimental and numerical studies of the
flow structure generated by a submerged sluice gate. (2010) In: Proceedings
from First IAHR European Congress, 64-6 May 2010, Edinburgh, Scotland.
O
pen
A
rchive
T
oulouse
A
rchive
O
uverte (
OATAO
)
OATAO is an open access repository that collects the work of Toulouse researchers and
makes it freely available over the web where possible.
Experimental and numerical studies of the flow structure
generated by a submerged sluice gate
L. Cassan
1& G. Belaud
11UMR G-EAU, Cemagref/IRD/Supagro, Montpellier, France.
ABSTRACT : Sluice gates are commonly used to control discharge and levels, and to monitor discharge.
However discharge formulas perform poorly at large opening and large submergence. This study explores the flow structure under such gates in order to verify commonly used assumptions about contraction coefficient and energy losses. The study is based on experimental results acquired in a laboratory flume. The flow structure was determined experimentally by ADV and numerically with RANS simulations performed with Fluent for different configurations of submerged gates and different modelling assumptions. Attention is given to the contracted flow and to the recirculating zone upstream of the gate. The experimental results on velocity are consistent with RANS simulations as far as discharge coefficients, wall shear stress and flow structure are concerned. Contraction coefficients were compared with analytical calculations based on potential flow and momentum balance. It is verified that, as usually assumed, the viscosity effects have a limited influence on the flow structure. We show that contraction coefficients should not be considered as constant at large submergence and large opening, which is a reason of the poor performance of the discharge formulas in these regimes.
INTRODUCTION
Sluice gates are commonly used in artificial and natural open-channels. Different engineering applications require paying more attention to these structures. Indeed, they are frequently used to measure the discharge, as they are insensitive to channel roughness evolution, unlike rating curves or velocity probes that may deviate due to vegetation developments. At large opening and large submergence, large errors can be observed due to bad estimates of the contraction coefficient, which is assumed to be the same as in free flow. Other common issues are linked to the flow structure upstream of gates, such as the capture of floating elements (especially
vegetation).
Most previous studies have focused on gates in free flow. Roth & Hager (1999) published a detailed
experimental study of the flow structure, and analyzed the real fluid effect. For submerged flow, most studies are limited to small openings (e.g. Dey & Sarkar 2006, 2007). Using energy and momentum balance and potential flow assumptions, Belaud et al. (2009) determined the contraction coefficient Cc of submerged gates, and then
their discharge coefficient. They showed that large opening and large submergence may lead to much higher values of Cc than the typical value of 0.61 obtained in free flow at small opening. However, real fluid effects
must be analyzed, as they may modify the velocity distribution, and introduce energy dissipation and flow resistance. In this paper, the flow structure is analyzed by experimental and numerical methods. The objective is to characterize the shear stress and velocity fields upstream and under sluice gates in submerged conditions, taking account of real fluid effects such as viscosity. Analytical formulations to calculate both fields are proposed. An application to discharge coefficient is finally given.
EXPERIMENTAL SETUP
The experiments have been carried out with the flume of the hydraulic lab of Montpellier Supagro. Its width, depth and length are 30cm, 50cm and 8m respectively. It has glass wall and a steel bottom. The sluice gate is positioned 4 m from the upstream end. The flow discharge is adjusted by a gate set on the inlet pipe. Discharge is measured with a V-notch weir placed at the canal tail and removed before experiments. The downstream
tailwater depth is fixed by a shutter at the tail of the flume. The Plexiglas gate is 5 mm wide with a rectangular shape. Water levels are measured with a point gage of ± 0.5 mm reading accuracy.
Velocities are measured with the Vectrino acoustic doppler velocimeter from Nortek, with an output sampling frequency of 25 Hz. The sample volume and transmit length are chosen to ensure recommended measurement conditions, namely SNR greater than 20 and correlation greater than 80%. For some measurements in the recirculation zone downstream from the gate (submerged flow) the correlation was only greater than 50% due to high turbulent flow.These conditions are obtained for a sample volume of 1.9 mm high and a transmission length of 1.2 mm. Sensor is maintained vertically with a 1 cm diameter rod. This set-up ensures an accuracy of ±0.5 mm in the vertical direction and ±2 mm in the longitudinal direction. At each point, the measurement is recorded during 40 s. Turbulence properties are computed by analyzing and averaging instantaneous data.
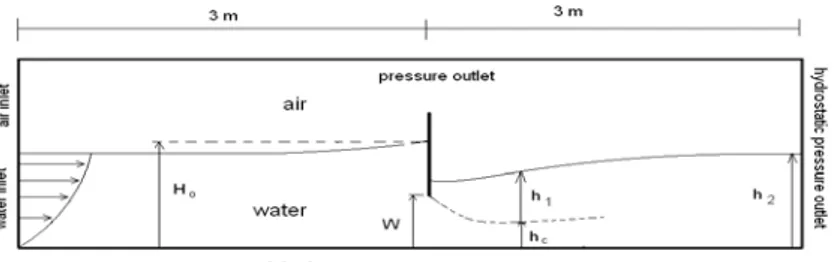
Figure 1 : domain and boundary conditions for submerged flow 2D RANS simulation
Experiments have been performed in submerged flow with a total head H0=0.3m, gate openings W between 0.03 and 0.24cm and downstream level h2 between 0.20 and 0.27cm. Relative gate opening is defined by a=W/H0; submergence is defined by s=h2/H0. Distance from the gate is denoted x, and relative distance X=x/W. Measurements include water levels, velocity profiles and ridge position.
NUMERICAL APPROACH Modelling equation
The Reynolds Average Navier Stockes equations are solved with Fluent 6.3. in unsteady condition. Seventy seconds of simulation time give a constant solution where mass balance is checked, which had been difficult to obtain with steady calculation. The SIMPLE algorithm is used to obtain pressure fields. The pressure
discretization uses the PRESTO scheme, and other equations are discretized with a second-order scheme. Three turbulent models were used for 2 specific flow, with parameters given by Fluent default values. The RNG k-e model was used too in one case. To track the free surface, the partial volume of fluid model was used. It is based on VOF formulation (Hirt & Nichols 1981) but it differs from it because air flow is taken into account
(Bombardelli et al. 2001). Two phases (water and air) are considered in the entire domain but a single set of momentum equations is shared by air and water. The nature of fluid is taken into account thanks to the volume fraction of each phase in each cell of the domain. The RANS and continuity equations are solved with volume fraction average value for properties (density and kinematic viscosity). The accurate free surface position is interpolated with the geometric reconstruction scheme available for unsteady calculation only. This scheme enables to calculate the free surface in a cell using its position in the neighbor cells.
Mesh
The 2D structured mesh was produced by Gambit. The domain dimensions are 6*0.4 m. The gate was located 3 m downstream from the inlet boundary. It is taken as the origin of the horizontal abscissas. Eight different meshes were created for each relative opening (a=0.1 to 0.8). The meshes were refined near the wall boundaries (bottom and sluice gate) and in the free surface area. The wall functions defined by Launder & Spalding (1972) were used. The mesh was constructed in order to verify that the non-dimensional distance to the wall is in the range of 12 < y+ < 250, with
y
+=
y
.u
*υ
.Boundary conditions
The boundary conditions and initial values are indicated on Fig 1. Water and air are injected separately with two velocity conditions at the upstream end. The air velocity is insensitive and equal to zero. An exponential profile is assumed for the water velocity distribution:
(
γ
)
γ + = 0 0. . 1 ) ( h y U y U Eq. 1in which γ is a shape factor, y is the vertical position and h0 is channel depth. Equation 1 insures that the mean
velocity is equal to U0 at the inlet. Based on standard values observed in open channels, we used γ=0.1. The first calculation were performed with a discharge (and mean velocity) determined by Garbrecht (1977)’s discharge equation in order to refine the mesh at the free surface. At the downstream end, a hydrostatic pressure outlet condition is imposed thanks to the open channel option. For submerged simulation, the water height (h2) is also fixed. The bed and the gate are considered smooth and the top is a pressure outlet condition. The initial and boundary turbulence intensity is estimated to 3 %.
RESULT AND DISCUSSIONS Velocity profile
Velocity profiles are described for small opening (a=0.2) and s=0.8, then a large opening (a=0.7) and s=0.9. At small opening (Fig. 2), the velocity is well reproduced with RSM and RNG k-ε models. The standard k-ω model, which is usually adapted to jet flow, gives the worst result with this contracted jet. Knowledge of the velocity profile allows plotting the contraction stream (Fig. 3) defined as that which carries a forward flow equivalent to the flow entering the gate (Rajaratnam & Subramanya 1967). The maximum contracted section is similar with RNG and RSM simulations.
Figure 2 : Velocities for submerged flow with a=0.2 and s=0.8. (X=-5, -2, 2, 5, 10).
Figure 3 : Velocities for submerged flow with a=0.7 and s=0.9. (X=-1, -0.5, 1, 2, 3).
At large opening, all RANS simulations agree with experiments except in the jet between the gate and the contracted section. Results with RNG k-ε and RSM models are very similar, while k-ω gives results that largely deviate from experiments. Upstream of the gate, longitudinal velocity is slightly underestimated, due to the presence of the recirculating zone that is not simulated with the 2D simulations. Simulations show a slight increase of velocity in the mixing region close to the contracted section (between X=1 and X=2), which is observed on experiments at X=1 only. Error could come from turbulence model and from the non-uniformity of velocity in the transverse direction. Nevertheless, the contraction coefficicent deduced from experimental and numerical methods are very close as shown on Figure 3. For all submergence ratios and small opening, the flow can be analyzed as a water jet (Dey & Sarkar 2006, 2007) while at large opening, velocity profile under the gate is more heterogenous in the vena contracta.
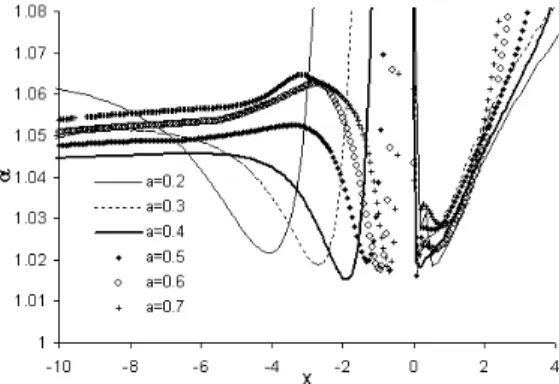
Energy correction
The previous estimates of the velocity may be used in a one-dimensional view to calculate kinetic energy and momentum coefficients. Figure 4 shows the values of Coriolis α coefficient as a function of the longitudinal distance for a largely submerged gate (s=0.9) and different openings. The minimum of αcorresponds to a mostly uniform longitudinal velocity profile (except in the boundary layer) and the limit of the significant gate
influence, which is around 2 to 4 times the gate opening. In the downstream part, α is between 1.02 and 1.03 at the contracted section. Average values of the momentum coefficients are 1.02 (upstream) and 1.015
(downstream of the gate). Head loss between upstream pool and contracted section is about 1% of the total head, mainly due to the high velocity gradients in the boundary layer.
Bottom pressure and wall shear stress
The normalized pressure head Hp=(h-hmin)/(h0-hmin) is calculated, as suggested by Roth & Hager (1999) for free
flow. It can be supposed that hmin corresponds to the value at the contracted section because the maximum
velocity is reached at this section. Then, it can be noticed that before the gate up to X=1(x=W), the pressure head is well described by Eq. 2 whatever the opening and the submergence is:
(
)
(
2)
4
.
1
.
48
.
0
exp
1
−
−
−
=
X
H
p Eq. 2The value of 1.4 corresponds to the average position of the contracted section (velocity is maximum). However, the position X of this section increases when opening decreases or submergence increases.
Bed shear stress can be calculated using Von Karman’s equation (Eq. 3) and the approximation of the classical wall-law (Eq. 4): dXUe d e U n n n a dX d a n n n e U p ~ ~1 . ~ ) 2 )( 1 ( 3. 2 1 ~ 1 ) 2 )( 1 ( ~ ~ 2 δ δ τ + + + + + + = Eq. 3
( )( )( )
( )
( )
21 2 1 2 1 2 ~ . ~ ~ Re . ~ Kn n Ue n Ue n p + − + − + − = δ τ Eq. 4where n=7 is the exponent of the exponential velocity profile in the boundary layer,
ν0 0 Re=Uh is Reynolds number, 2 0 . ~ U p p ρ τ τ = , 0 ~ U Ue Ue= , 0 ~ h δ
δ= with ρ water density, Ue velocity at the boundary layer limit, δ boundary
layer thickness and K is the constant provided by the approximation of the log-law (K=8.75). Using Bernoulli’s theorem between upstream pool and contracted section provides a third equation for
e U~ :
(
1)
1 ~ ~ 2 0 2 2 − + = p d H Cc h a e U α Eq. 5where h~0 =h0/H0. A very good approximation is given by Cc=0.61 and h~0 =1. Alternatively, these values can
be calculated by the method of Belaud et al. (2009) and used further in this paper. The first-order differential equation giving δ is solved with a boundary condition given by δ=h0/2 in the upstream pool, leading to
τ
~
p.Figure 5 : Bottom pressure profile for all RANS simulation and for A-2 and B case from Rjaratnam (1967).
Figure 6 : Normalized wall shear stress at the bed under the sluice gate (
f
( )
X
=
τ
~
a
2Re
−0.25).For a=0.2 simulations well agree with experiments (Fig. 3) and the semi-empirical formula proposed by Dey & Sarkar (2006). However for a> 0.3, error is significant because correlations were adjusted only for a jet configuration. The second maximum for bed shear stress is due to the end of the submerged hydraulic jump. The one dimensional calculation allows reproducing the wall shear stress under the gate even for large opening. The gap for a=0.8 comes from the fitting of Hp which did not take into account changes of minimum position
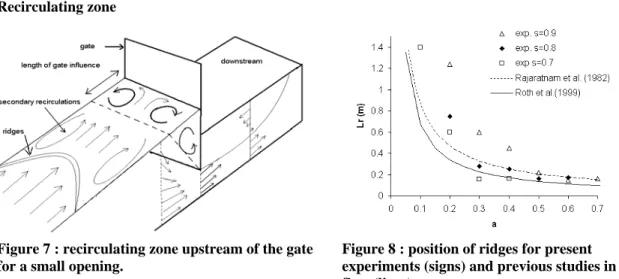
Recirculating zone
Figure 7 : recirculating zone upstream of the gate for a small opening.
Figure 8 : position of ridges for present
experiments (signs) and previous studies in free flow (lines).
The upstream recirculating zone has a specific interest as it may capture vegetation and other floating materials. However our 2D simulations do not simulate recirculation. Then, it is assumed that this structure is due to 3D effects. For free flow, previous measurements have been done by Rajaratnam & Humphries (1982) and Roth & Hager (1999) who considered that position of ridges (Lr) at the surface define the recirculating zone (Fig. 8) and linked the length of this zone to a. Our laboratory experiments showed that, unlike in free flow, ridges appear much more upstream from the gate than the main recirculating zone.The ridges are linked to secondary recirculations that appear only at the surface, close to the borders. For a given depth and opening, they appear further from the gate as the submergence increases. Indeed, mean velocity decreases as Froude number decreases and secondary recirculations can become longer. We find also that a change in h0 causes a change of Lr, which
was not considered in former studies.
Contraction and discharge coefficients
Several authors (Sepulveda et al. 2009; Belaud et al. 2009) have shown the benefit to determine discharge coefficient using energy equation and contraction coefficient. At large opening, choosing Cc=0.61 leads to
under-estimate discharge coefficient. Using the momentum balance, the method of Belaud et al. (2009) leads to values of Cc that increase with gate opening in submerged flow, allowing improving the calculation of discharge
coefficient compared to classical methods. Such variation is confirmed with RANS simulations. This method was applied using the water level at the section contracted h1. Momentum and energy equations may be adjusted
to take account of energy and momentum corrections, using RANS simulations as described here. Figure 9 shows the variation of Cc with a for three submergence ratios (s=0.7, 0.8, 0.9). Energy-momentum balance
approach is improved using the correction coefficients given by RANS simulations, in particular at small
Figure 9: contraction coefficient as a function of relative opening from RANS simulation (signs) and Belaud et al. (2009)’s formulation (lines).
Figure 10 : comparison between discharge coefficients estimated by several methods and measured discharge coefficients.
opening. It indicates the influence of viscous effects which increase the kinetic energy correction factor. At large opening, mean values of correction coefficients are sufficient to approach Cc.
A comparison of experimental values and present numerical results with the momentum-energy approach and Garbrecht (1977)’s formula is given in Fig. 10. For almost all openings, an error lower than 10 % was obtained only with the momentum-energy method. Although this method gives the best result, the water level over the contracted section is more difficult to measure than the tailwater depth, but it may be calculated using momentum balance too.
CONCLUSION
The flow structure generated by a submerged sluice gate have been studied experimentally and with RANS simulations. RSM and RNG k-ε are able to reproduce measured velocity and shear stress profiles, and then characterize the contracted flow. However, 2D simulation is inappropriate to simulate 3D effects such as the recirculating zone, but allows estimating its position and length of this zone by analyzing velocity field.
Simulations also give correction factors that can be applied to energy-momentum equations, which may be used to quickly calculate contraction and discharge coefficients, in particular at large opening and large submergence. Viscosity influence such as head losses and boundary layer thickness may be taken into account to improve the different terms of the balance, and then the estimation of the discharge coefficient.
REFERENCES
Belaud, G. , Cassan, L & Baume, J.P. 2009. Calculation of Contraction Coefficient under Sluice Gates and Application to Discharge Measurement. J. Hydr. Engrg. 135( 12): 1086-1091
Bombardelli, F. A., Hirt, C. W. and García, M. H.: 2001, ‘Discussion on ‘Computations of Curve Free Surface Water Flow on Spiral Concentrators’ ’ by B. W. Matthews, C. A. J. Fletcher, A. C. Partridge and S. Vasquez,
J. Hydraul. Eng. ASCE 127(7), 629–630.
Cassan, L. & Belaud, G. 2008. RANS simulation of the flow generated by sluice gates. Int.Junior Researcher
and Engineer Workshop on Hydraulic Structures, Pisa, Italy.
Dey, S & Sarkar, A. 2007. Computation of Reynolds and boundary shear stress in submerged jets on rough boundaries. J. Hydro-environment Res. 1: 110-117
Dey, S & Sarkar, A. 2006.Response of velocity and turbulence in submerged wall jets to abrupt changes from smooth to rough beds and its application to scour downstream of an apron. J. Fluid Mech. 556, 387–419. Garbrecht, G. 1977. Discussion of "Discharge computations at river control structures", by L. Dannie. J.
Hydraul. Div.-ASCE, 103: 1481-1484
Hirt, C.W & Nichols, B.D. 1981. Volume of fluid (VOF) method for the dynamics of free boundaries. J.
Comput. Phys., 39: 201–225.
Launder, B. E. 1989. Second-Moment Closure: Present... and Future? Int. J. Heat Fluid Flow 10(4):282-300 Launder, B. E. & Spalding, D. B.1972. Lectures in Mathematical Models of Turbulence. Academic Press,
London, England.
Montes, J.S. 1997. Irrotational flow and real fluid effects under planar sluice gates. J.Hydraul. Engng 123: 219-232
Rajaratnam, N. & Humphries, J.A. 1982. Free flow upstream of vertical sluice gate. J. Hydraul. Res. 20(5) : 427-437
Rajaratnam, N. & Subramanya, K. 1967. Flow equation for sluice gate. Journal of Irrigation Division, ASCE. 93(3) : 167-186
Roth, A. & Hager, W.H. 1999. Underflow of standar sluice gate. Experiments in Fluids 27 : 339-350 Sepulveda, C., Gomez, M, & Rodellar, J. 2009. Benchmark of discharge calibration method for submerged
sluice gate. J. Irrig. and Drain. Eng. 135(5): 676-682