Michel : Assistant Professor of Finance, HEC Montréal, Montréal, Québec, Canada H3T 2A7; and CIRPÉE.
Phone: 514 340-7153; Fax: 514 340-5632
Pandes : Assistant Professor of Finance, Haskayne School of Business, University of Calgary, Calgary, Alberta,
Canada T2N 1N4; Phone: 403 220-4350; Fax: 403 210-3327
We would like to thank Matteo Cacciatore, Debarshi Nandy, Richard Willis and seminar participants at the 2012 CEA meetings (Calgary), the 2012 EFMA meetings (Barcelona), the 2012 MFS meetings (Krakow), the 2012 Asian FMA meetings (Phuket), the 2012 FMA meetings (Atlanta), the 2012 AAA meetings (Washington D.C.), the University of Calgary, and HEC Montréal for their very helpful comments. We gratefully acknowledge the financial support from the Social Sciences and Humanities Research Council of Canada.
Cahier de recherche/Working Paper 13-05
Analyst Forecast Revisions and Overconfidence
Jean-Sébastien Michel J. Ari Pandes
Abstract:
We find evidence that supports the notion that analysts who provide extreme forecast revisions are overconfident, especially in assessing the earnings prospects of high information uncertainty firms. We further examine whether analyst overconfidence is associated with stock market performance, and find that a portfolio of extreme forecast revisions underperforms a portfolio of modest forecast revisions in high information uncertainty firms, but not in low information uncertainty firms. Finally, we find that experienced analysts are more overconfident than inexperienced analysts, particularly for high information uncertainty firms, suggesting that analysts do not reduce their overconfidence bias by learning from experience.
Keywords: Analyst forecast revisions, overconfidence, information uncertainty, forecast accuracy, stock returns
1 1. Introduction
Perhaps the most robust finding in the psychology of judgment is that people are overconfident (Debondt and Thaler, 1995). In particular, calibration studies examining subjective probabilities find that people tend to overestimate the precision of their knowledge, especially for difficult tasks, for forecasts with low predictability, and for undertakings lacking timely and clear feedback (Alpert and Raiffa, 1982; Fischhoff, Slovic, and Lichtenstein, 1977). Furthermore, it has been shown that traders in experimental markets do not place enough weight on the information and actions of others (Bloomfield, Libby, and Nelson, 1999).
Past research on analyst behavior suggests that analysts are not immune to this bias. Chen and Jiang (2006) use linear regression and probability-based methods to find that on average, analysts overweight their private information when they forecast corporate earnings. This evidence is consistent with the Daniel, Hirshleifer, and Subrahmanyam (1998) definition of overconfidence. Friesen and Weller (2006) develop a model of analyst earnings forecasts that discriminates between rational behavior and that induced by cognitive biases. They find strong empirical evidence that analysts are overconfident about the precision of their own information. Montgomery and Bradlow (1999) develop a theoretical explanation of why analyst overconfidence about the functional form of demand models can lead to overpricing. In their setup, the analyst’s overconfidence can stem from their ignorance of model misspecification, structural changes in the marketplace, or omitted variables.
We pose three questions in this paper. First, are analysts who make extreme forecast revisions overconfident?1 By overconfident, we mean that analysts overweight their private information signals relative to publicly available information, causing them to overreact as in
1
To be clear, extreme forecast revisions are not outliers. Empirically, we define a revision as extreme if it is in the top 20% of forecast revisions in that month. Similarly, we define a revision as modest if it is in the bottom 20% of forecast revisions in that month.
2
Daniel et al. (1998). If analysts’ extreme revisions are driven by overconfidence, and not by valuable information production, then they should be less accurate than analysts’ modest revisions. When information is sparse or ambiguous, analysts’ extreme revisions should be even more extreme and even less accurate than analysts’ modest revisions. Second, can analyst overconfidence also affect stock prices? If analyst overconfidence is correlated with investor overconfidence, and there are market imperfections or limits to arbitrage as in Shleifer and Vishny (1997), then stock prices should be overvalued and subsequently correct downward. Analyst overconfidence would be correlated with investor overconfidence if they have the same underlying determinants or if investors make their investment decisions based on the forecasts of overconfident analysts.2 The effect of overconfidence on stock prices should be greater when information is uncertain since reliance on private information and limits to arbitrage will both be greater. Finally, can analysts learn their way out of being overconfident? Given the clear feedback provided by the revealed accuracy of the forecast when true earnings are announced, we want to see whether overconfidence can be eliminated by learning from experience.
The testable implications of analyst overconfidence are as follows: (i) analysts making extreme revisions should be less accurate than analysts making modest revisions; (ii) when information uncertainty is high, analysts making extreme revisions should be even less accurate than analysts making modest revisions; (iii) the firms for which analysts are making extreme revisions should underperform relative to the firms for which analysts are making modest revisions; (iv) when information uncertainty is high, the firms for which analysts are making extreme revisions should underperform even more than the firms for which analysts are making modest revisions; (v) experienced analysts should make more accurate revisions than
2
Beyer, Cohen, Lys, and Walther (2010) find that 22% of quarterly abnormal stock returns are explained by the abnormal returns surrounding analyst forecasts, suggesting that investors do indeed rely heavily on analyst forecasts to make their investment decisions.
3
inexperienced analysts; and (vi) when information uncertainty is high, experienced analysts should make even more accurate revisions than inexperienced analysts.
We find that analysts’ extreme forecast revisions are almost five times less accurate than analysts’ modest forecast revisions made in the same month. Furthermore, the difference between the highest and lowest forecast revisions is 31% to 92% larger in high information uncertainty firms than in low information uncertainty firms, depending on the measure of information uncertainty used. This increase in extreme forecast revisions is accompanied by a decrease in accuracy of between 63% and 126%. We also find that analysts who make extreme or moderate revisions, tend to do so persistently. Of the analysts who provide extreme revisions in a year (top 20%), almost half of them provide extreme revisions in the subsequent year. In terms of the market’s reaction to forecast revisions, the factor-adjusted return from a hedge portfolio long on extreme forecast revisions and short on modest forecast revisions is between – 0.58% and −0.76% per month (–6.96% and –9.12% annually) in high information uncertainty firms, while this return is largely insignificant in low information uncertainty firms. Finally, we find a surprising result with respect to analyst learning. Among skilled analysts, those with more experience are more overconfident than those with less experience. Furthermore, experienced analysts are more overconfident than inexperienced analysts about firms with high information uncertainty, but slightly less overconfident about firms with low information uncertainty.
We make three main contributions to the literature. First, we contribute to the discussion on analysts’ role in disseminating information to the public. All of our evidence supports the notion that analysts who provide extreme forecast revisions are indeed overconfident, especially in assessing the earnings prospects of firms with high information uncertainty. Second, we contribute to the discussion on market efficiency. Through its impact on investors, analysts’
4
extreme revisions are associated with stock-market overvaluation followed by underperformance when information uncertainty is high. This result suggests that, in situations where information is ambiguous and limits to arbitrage are binding, behavioral biases can lead to temporary market inefficiencies. Last, we contribute to the discussion on learning from experience. We show that among skilled analysts, experience actually increases overconfidence. Furthermore, this effect is mainly concentrated among firms with high information uncertainty.
Information uncertainty, as in Zhang (2006a), comes from two sources: the volatility of a firm’s underlying fundamentals and poor information. We use three measures of information uncertainty. Our first measure is the dispersion in analyst forecasts (DAF), which is used widely in the literature as a measure of uncertainty or heterogeneous beliefs about a firm’s future earnings prospects. It has been shown that greater analyst forecast dispersion predicts more positive (negative) forecast errors and subsequent forecast revisions following good (bad) news, which suggests that information uncertainty undermines analysts’ ability to incorporate the information in their forecasts (Zhang, 2006b). Moreover, Diether, Malloy and Scherbina (2002) find that a trading strategy of buying low dispersion stocks and selling high dispersion stocks yields economically large profits, consistent with Miller's (1977) theory of heterogeneous beliefs.3 In addition, Wurgler and Zhuravskaya (2002) find a significant positive correlation between arbitrage risk and the heterogeneity of earnings forecasts.
Second, earnings volatility (EVOL) is used to measure earnings uncertainty. Chordia, Huh, and Subrahmanyam (2007) use earnings volatility to capture estimation uncertainty about fundamental values, and find that it is an important determinant of expected trading activity. Berkman, Dimitrov, Jain, Koch, and Tice (2009) use earnings volatility as a measure of
3
If dispersion and earnings volatility also predicts negative returns, then we use DAF and EVOL not only as measures of information uncertainty, but also as control variables to ensure that they are not driving the relationship between extreme forecast revisions and returns.
5
differences of opinion, and find that high differences of opinion stocks earn significantly lower returns around earnings announcements than low differences of opinion stocks.
Last, we use analyst coverage (COV) as an additional measure of information uncertainty.4 COV is also a natural measure since an analyst's role is to process and distribute information about a firm’s prospects, and recent evidence shows that greater analyst coverage is likely to uncover more information about the firm, and therefore reduce the information uncertainty surrounding this firm. Furthermore, low-coverage stocks seem to react more sluggishly to bad news than to good news (Hong, Lim, and Stein, 2000), and the post-revision price drift is more pronounced in firms with lower analyst coverage (Gleason and Lee, 2003). Also, initial public offerings with high unexpected coverage have significantly better returns and operating performance than those with low unexpected coverage (Das, Guo, and Zhang, 2006). 2. Related Literature
This paper is related to various strands of literature in finance and accounting. First, there is a small but growing literature on analyst overconfidence, which we mention above. We add to this literature by documenting that extreme analyst revisions are driven by analyst overconfidence, which we show to be persistent. Moreover, through its impact on investors, analyst overconfidence is associated with stock-market overvaluation followed by underperformance.
Second, we contribute to the literature on analyst forecast accuracy. Clement and Tse (2003) show that investors fail to extract some of the information that analyst characteristics can provide about future forecast accuracy, but that investors respond more strongly to forecasts released earlier in the year and forecasts provided by larger brokerages. Stickel (1992) finds that
4
We deem an analyst to have covered a firm if he or she has provided a forecast in the year prior to the forecast being considered.
6
Institutional Investor All-American analysts are more accurate forecasters, forecast more frequently, and their upward forecast revisions have a greater impact on prices, than non-All-American analysts. Sinha, Brown and Das (1997) note that forecast errors tend to be serially correlated, and that analysts classified as superior in one period retain that classification in later periods, but analysts classified as inferior in one period do not retain that classification in later periods. Clement (1999) documents that forecast accuracy is positively associated with analysts' experience (a surrogate for analyst ability and skill) and employer size (a surrogate for resources available), and negatively associated with the number of firms and industries followed by the analyst (measures of task complexity). We are the first to find that analysts’ extreme revisions are associated with much lower subsequent forecast accuracy than analysts’ modest revisions, and furthermore that this effect is stronger when information uncertainty is high.
Third, there is a large literature on earnings forecast revisions and stock market returns. Stickel (1991) is one of the first papers to document that revisions affect prices, but prices do not immediately impound the information. Chan, Jegadeesh, and Lakonishok (1996, 1999) show that earnings forecast price drifts can last up to a year after portfolio formation. More recently, Gleason and Lee (2003) find a number of factors that help explain the cross-sectional relationship between forecast revisions and post-revision price drift, including the level of the forecast revision, being an "All-Star" analyst, and the level of analyst coverage. In contrast to this literature, we are the first to examine the magnitude of earnings forecast revisions and find that more extreme revisions predict lower returns in firms with high information uncertainty. We attribute this result to investors’ reaction to analyst overconfidence in the face of ambiguity.
7
Finally, there is a long literature on learning-by-doing, whereby learning is a product of experience (Arrow, 1962).5 Mikhail, Walther, and Willis (1997) show that analysts improve their forecast accuracy with firm-specific experience, and the market recognizes this improvement. Clement (1999) finds that security analysts’ earnings forecasts become more accurate as they gain experience. Mikhail, Walther, and Willis (2003) show that the superior forecast performance of experienced analysts is due to the more complete incorporation of information in prior earnings. More specifically, the authors show that analysts underreact less to prior earnings information as their firm-specific experience increases. We add to this literature by showing that analysts with more experience are on average more overconfident (not less overconfident) than analysts with less experience.
There is a distinct, but related, literature on learning to be overconfident through self-attribution. In self-attribution bias, individuals attribute success to their own skill but dismiss failure as the product of bad luck. Overconfidence and biased self-attribution are static and dynamic counterparts, whereby self-attribution causes individuals to learn to be overconfident rather than converging to an accurate self-assessment (Hirshleifer, 2001).6 Gervais and Odean (2001) develop a multi-period market model of learned overconfidence. Traders in their model learn about their ability through experience, and those who are successful overweight the
5
This literature is quite broad. For example, List (2003, 2011) finds that experience plays a significant role in eliminating market anomalies in an experimental context. Feng and Seasholes (2005) also show that investor sophistication combined with experience eliminates the reluctance to realize losses. Koestner, Meyer, and Hackethal (2012) show that underdiversification and the disposition effect do not decline as investors gain experience, but that investors do learn from overconfidence. Agarwal, Driscoll, Gabaix, and Laibson (2008) provide evidence that paying fees teaches credit card holders to avoid paying late fees in the future, which is also consistent with the idea that individuals learn from experience.
6
Indeed, the two types of overconfidence likely coexist. Using data on identical and fraternal twins' complete financial portfolios, Barnea, Cronqvist, and Siegel (2010) find that a genetic factor explains about one third of the variance in stock market participation and asset allocation. Cronqvist and Siegel (2013) find that for a long list of investment biases, genetic differences explain up to 45% of the variation across individual investors, consistent with the idea that investment biases are manifestations of innate features of human behavior. However, Barnea et al. (2010) also find that the social environment has an effect on the behavior of young individuals, but this effect disappears as individuals gain experience.
8
possibility that their success was due to superior ability, thus leading to overconfidence. Consistent with Gervais and Odean's (2001) learned overconfidence model, Hilary and Menzly (2006) find that after making a short series of accurate predictions, analysts are more likely to be inaccurate than their skill and environment would predict. Analysts also take additional risk by deviating more from the consensus forecast on their subsequent prediction. While we approach overconfidence from a static perspective, we leave open the possibility that it may be learned through self-attribution.
3. Research Design, Data, and Summary Statistics 3.1. Research Design
This paper examines whether extreme analyst forecast revisions are an indication of analyst overconfidence. As such, the main unit of analysis is analyst-level forecasts. In particular, our main variable of interest is the absolute analyst forecast revision (AREV), defined as the absolute value of the analyst one-year earnings per share forecast minus the prior-month consensus one-year earnings per share forecast, and scaled by the prior-month price, in percent. We focus on the absolute value because overconfidence relates to the magnitude of revisions and not their sign. Moreover, overconfidence should be found primarily in hard-to-value firms. To test this empirically, we use three measures of information uncertainty. The first measure of information uncertainty is dispersion in analyst forecasts (DAF), defined as the standard deviation of analyst forecasts, and scaled by the prior-month price, in percent. Our alternative information uncertainty proxies are: EVOL, earnings volatility defined as the standard deviation of earnings per share (EPS) over the past four quarters, and scaled by the prior-month price, in percent; and COV, the analyst coverage defined as the number of analysts that have provided a forecast for a given firm in the year prior to the forecast. We use analyst EPS forecast accuracy
9
(ACC) as an ex post measure of analyst forecasts’ informational content, defined as the absolute value of the analyst forecast minus the realized value, and scaled by the prior-month price, in percent. We also test the impact of extreme analyst forecasts on stock market returns. Stock return (RET) is defined as the one-month return in the month after the analyst forecast is observed, in percent. Finally, analyst experience (EXP), defined as the number of months since the analyst’s first forecast as announced, is also examined later in this paper in order to gain insight on the learning behavior of analysts.
3.2. Data
The initial sample is composed of all analyst forecasts in Thomson Reuters’ I/B/E/S unadjusted detail history file. We retain U.S. analyst EPS annual forecasts, and eliminate observations where the analyst code is missing. Since we require one year of forecasts to calculate analyst coverage, our sample starts in 1985 and ends in 2012. We winsorize the sample below 1% and above 99% because of errors found in the I/B/E/S detail history file and also to ensure that our results are not being driven by outliers.7 Finally, we also remove firms that are not covered by the Center for Research in Security Prices (CRSP). Actual EPS and its announcement date are obtained from the I/B/E/S unadjusted detail actuals file, while consensus forecasts and forecast standard deviations are obtained from the I/B/E/S unadjusted summary file. The book value of equity is taken from Compustat.
In Figure 1, we present a monthly time-series plot of the main variables used in this paper: AREV, ACC, and RET. When comparing AREV and ACC, we find that both series exhibit time-series variation as well as seasonality from the decreased absolute forecast revision and increased accuracy that come with an impending fiscal year end. Interestingly, we find that
7
A notable example is Microsoft. On five occasions between December 4th 1986 and January 14th 1987, a 1-year EPS forecast of around $20 per share (between $19.40 to $22.14) was given for the fiscal period ending June 30th 1987, even though all of the other 79 forecasts in 1986-87 were around $2 (between $1.62 and $3.06).
10
during economic downturns AREV tends to be higher than during periods of economic growth. For example, during the 1987 market crash, the early 1990s recession, the early 2000s post-dot.com recession, and the recent financial crisis of 2007-2008, there is a clear spike in AREV relative to other periods. According to the overconfidence hypothesis, we should find higher AREV (extreme forecast revisions) to be associated with lower forecast accuracy during periods of greater information uncertainty (i.e. market downturns). Indeed, the ACC time-series also spikes in those time periods where AREV spikes, which says that analysts’ extreme forecast revisions are the least accurate during periods of greater information uncertainty. We also present a monthly time-series plot of raw returns, and note that there is no visible time-series relationship between more extreme forecast revisions and returns.
3.3. Summary Statistics
Table 1 reports summary statistics for the variables used throughout this paper. We form portfolios of forecast revisions sorted monthly into AREV quintiles and provide summary statistics for the variables split into extreme forecast revisions (Panel A), which is the highest quintile of revisions, and modest forecast revisions (Panel B), which is the lowest quintile of revisions. Not surprisingly and by construction, we find AREV to have a higher mean (4.07%) and median (2.63%) value for the extreme revisions in Panel A than for the modest revisions in Panel B, which has a mean and median AREV of 0.04%. DAF has a mean value of 1.94% and a median value of 1.11% in the extreme revisions portfolio, which is substantially higher than the mean and median DAF of 0.26% and 0.13%, respectively, in the modest revisions portfolio. Also, we find EVOL to have a mean of 2.85% and a median value of 1.25% for extreme forecast revisions, which are higher than the mean and median of 0.56% and 0.25%, respectively, for modest forecast revisions. We further find that on average a firm is covered by 13.75 analysts,
11
and a median number of 11.00 analysts for extreme revisions, which are lower than the mean number of analysts of 18.42 and median number of analysts of 17.00 for modest forecast revisions. The differences in our information uncertainty proxies between extreme and modest forecast revisions suggest that more extreme forecast revisions are given for higher information uncertainty firms. We report mean ACC of 5.94% and a median ACC of 2.17% for extreme forecast revisions, which are substantially higher than for modest forecast revisions, where we find the mean and median ACC to be 1.05% and 0.24%, respectively. This result suggests that extreme forecast revisions are associated with less informational content than modest forecast revisions, consistent with overconfidence, although it does not control for other factors, which we turn to later in the paper. The mean stock return is 0.57% and the median return is 0.00% for extreme forecast revisions, which are lower than the mean and median stock return of 0.78% and 0.86%, respectively, for modest forecasts revisions. The mean and median analyst experience is similar between the extreme forecast revisions portfolio and the modest forecast revisions portfolio (70.96 and 55 months versus 73.00 and 57 months). We include firm size (MV), book-to-market (BV/MV), and standardized unexpected earnings (SUE) as additional firm-specific control variables. The mean and median market value (MV) of firms with extreme forecast revisions is $3,440.86 million and $565.81 million, respectively, compared to a mean and median MV of $11,567.50 and $2,891.52, respectively, for modest forecast revisions. Moreover, the mean BV/MV of firms with extreme forecast revisions is 0.72, and the median BV/MV is 0.62, compared to a mean BV/MV of 0.38 and a median BV/MV of 0.33 for modest forecast revisions We also document marked differences for SUE, where the mean is 0.14 and the median is 0.08 for extreme forecast revisions, compared to a mean and median of 1.24 and 0.91,
12
respectively, for modest revisions. We control for these differences in firm size, book-to-market, and earnings surprises in subsequent sections of the paper.
4. Absolute Forecast Revisions and Overconfidence
4.1. Univariate and Bivariate Absolute Revision and Accuracy Results
In Table 2 we provide further insight into the AREV measure by forming portfolios of forecast revisions sorted monthly into AREV quintiles and examining average AREV (Panel A) and average ACC (Panel B) across these quintiles for the full sample. We also examine AREV and ACC for bivariate portfolios split into High DAF (top quintile) firms and Low DAF (bottom quintile) firms, High EVOL (top quintile) firms and Low EVOL (bottom quintile) firms, and High 1/COV (top quintile) firms and Low 1/COV (bottom quintile) firms. We use 1/COV to remain consistent with our DAF and EVOL measures (i.e. High 1/COV implies high information uncertainty, similar to High DAF and High EVOL). Focusing on the AREV results in Panel A, not surprisingly and by construction we find that average AREV increases monotonically in the AREV quintiles. Turning to the bivariate portfolio results and the DAF proxy for information uncertainty, we find that in both High DAF and Low DAF subsamples, average AREV is monotonically increasing, and the high minus low AREV difference is statistically significant in both subsamples. The results become more telling when we compare the economic significance between the High DAF and Low DAF subsamples. In particular, the high minus low AREV difference is 4.74 for High DAF firms, compared to 2.87 for Low DAF firms, and this difference is mainly driven by the highest AREV quintile, which suggests that high information uncertainty firms are associated with the most extreme forecast revisions, consistent with our Table 1 results. We find a similar pattern for our alternative information uncertainty proxies. For High EVOL firms, the high minus low AREV difference is 5.32, which is substantially higher than the high
13
minus low AREV difference of 2.77 for Low EVOL firms. Moreover, the high minus low AREV difference of 4.44 for High 1/COV firms is also higher than the high minus low AREV difference of 3.38 for Low 1/COV firms. Thus, each of the information uncertainty proxies indicates that when information uncertainty is high, analysts tend to provide much more extreme forecast revisions relative to firms with less information uncertainty.
The analyst overconfidence hypothesis predicts that more extreme forecast revisions are associated with less accurate earnings forecasts, and this effect should be stronger for firms with higher information uncertainty. Therefore, in Panel B we empirically examine the AREV-ACC relationship for univariate portfolios sorted by AREV and for bivariate portfolios sorted by AREV and our information uncertainty proxies, which tests whether there is a more pronounced AREV-ACC relationship among high information uncertainty firms versus low information uncertainty firms. We first examine the relationship between AREV and forecast accuracy (ACC: a higher number indicates lower accuracy) for the full sample, and find that ACC is increasing in AREV. We further note that the forecast revisions in the top AREV quintile are statistically and economically less accurate than the forecast revisions in the bottom AREV quintile. In particular, since ACC is an ex-post measure, we find that analyst forecast revisions in the highest AREV quintile are 4.89 percentage points less accurate than forecast revisions in the lowest AREV quintile. We gain further insight when we split the sample into high information uncertainty firms and low information uncertainty firms. Focusing on the DAF subsamples, we find that while average ACC is monotonically increasing in AREV in both the High DAF and Low DAF subsamples, consistent with more extreme forecast revisions being associated with less accurate forecasts, we interestingly find the average ACC in each AREV quintile to be higher for High DAF firms compared Low DAF firms. This result indicates that absolute
14
forecast revisions for harder to value firms are less accurate, in general. The high minus low AREV difference between High DAF firms and Low DAF firms is particularly telling. Specifically, we find this difference to be 3.67 for High DAF firms compared to 2.15 for Low DAF firms, consistent with more extreme forecast revisions being associated with relatively less accurate forecasts for firms with high information uncertainty compared to firms with low information uncertainty. Importantly, this finding is consistent with analyst overconfidence such that extreme forecast revisions for firms where the information is relatively more sparse and difficult to interpret are associated with much lower forecast accuracy. We also find similar results for our alternative information uncertainty proxies, EVOL and 1/COV. When we sort AREV monthly into portfolios and split the sample between High EVOL and Low EVOL firms and examine the average accuracy, we find the high minus low AREV for High EVOL firms to be 5.01, compared to 2.22 for Low EVOL firms. The pronounced effect among High EVOL firms again supports analyst overconfidence in extreme forecast revisions, especially for those firms that are hardest to value. Similarly, the high minus low AREV difference for High 1/COV firms is 5.29 and higher than the high minus low AREV difference of 3.24 for Low 1/COV firms.
Overall, the univariate and bivariate portfolio results in Table 2 indicate that extreme forecast revisions, as measured by high AREV, are consistent with analyst overconfidence. Our empirical findings show that analysts make more extreme forecast revisions for harder to value firms, and that firms with extreme forecast revisions are associated with less accurate earnings forecasts, with this effect being much more pronounced among firms that exhibit high information uncertainty, as measured by DAF, EVOL and 1/COV.
15
The univariate and bivariate results presented above do not control for other factors that could explain the positive AREV-ACC relationship and the pronounced effect among high information uncertainty firms. Therefore, in Table 3 we examine the impact of AREV on forecast accuracy while controlling for other potential determinants of forecast accuracy, including a Regulation FD dummy variable (Reg FD), firm size (Ln(MV)), book-to-market (BV/MV), and standardized unexpected earnings (SUE).8 We use the quintile indicator variables for our information uncertainty proxies in the regressions (DAFQ, EVOLQ, and COVQ), which take on the values 1 to 5, instead of the variables themselves, because the quintiles are computed monthly and thus do not vary through time. We note that COVQ is the quintile for 1/COV in order to remain consistent with the bivariate analysis above. We include interaction terms between AREV and DAFQ, AREV and EVOLQ, and AREV and COVQ to test the overconfidence hypothesis, which predicts a positive coefficient on our interaction terms. We also include calendar year and Fama-French 48-industry dummy variables in all of our regressions.9
Model 1 in Table 3 reports the results from regressing forecast accuracy on a constant, AREV, and the various control variables, excluding any interaction terms. The positive and statistically significant coefficient on AREV confirms our earlier results in Table 2 that higher AREV leads to significantly less accurate forecasts after controlling for other determinants of forecast accuracy. We expect a positive relationship between our information uncertainty proxies and ACC, which supports the idea that analyst forecasts for higher information uncertainty firms are less accurate. The results indeed show a positive relationship for two of our three information
8 Reg FD, which was implemented on October 23, 2000 by the Securities & Exchanges Commission, prohibits firms
from disclosing value-relevant information to select analysts without simultaneously disclosing this same information to all market participants.
9
Fama-French 48-industry definitions are obtained from Professor Kenneth R. French’s website
16
uncertainty proxies, DAFQ and EVOLQ, and a negative coefficient on COVQ. The negative coefficient on COVQ is due to the inclusion of Ln(MV), which is highly correlated with COVQ. When we remove Ln(MV) from Models 1 and 4 in Table 3, we find a positive relationship between ACC and COVQ. We further find the coefficient on the Reg FD dummy variable to be negative and statistically significant, indicating that the regulation prohibiting firms from disclosing firm-specific information to select analysts without simultaneously disclosing the information to all market participants has resulted in better forecast accuracy by analysts. Alternatively, market conditions post-Reg FD could have changed such that analysts generally became more accurate in their earnings forecasts. The coefficient on Ln(MV) is negative and statistically significant, indicating that analysts provide more accurate forecasts for larger firms, consistent with prior research. We also find a positive and statistically significant coefficient on BV/MV, which signifies that analysts are less accurate in providing forecasts for value firms. Lastly, the coefficient on SUE is negative and statistically significant, indicating that positive earnings surprises are associated with higher accuracy and negative earnings surprises are associated with lower accuracy. This suggests that analysts are on average optimistic (consistent with prior research) such that for positive earnings surprises, analysts’ optimistic forecasts are closer to the true value, and for negative earnings surprises, analysts’ optimistic forecasts are further from the true value. It is worthwhile to point out that the Model 1 regression has reasonable explanatory power, with an adjusted R-squared of 30.5%.
In Model 2 we include the interaction between AREV and DAFQ, and exclude our other information uncertainty variables, EVOLQ and COVQ. We find the coefficient on the interaction term AREV × DAFQ to be positive and statistically significant. This result is consistent with our Table 2 bivariate results that more extreme forecast revisions leads to incrementally lower
17
forecast accuracy for firms where there is high analyst disagreement, and thus providing strong support for analyst overconfidence. Model 3 presents the results for our alternative information uncertainty proxy, EVOLQ, and yields similar results to Model 2. In particular, we find the coefficient on AREV × EVOLQ to be positive and statistically significant, indicating that more extreme forecast revisions for firms with greater earnings volatility, which are generally harder to value and more informationally opaque, leads to lower forecast accuracy. In Model 4 we report the results for our third information uncertainty proxy, COVQ, which also yields results that are in line with Models 2 and 3. The coefficient on the interaction term, AREV × COVQ, is positive and statistically significant, indicating that more extreme forecast revisions for firms that receive less analyst coverage leads to lower forecast accuracy. Interestingly, we find that after controlling for other determinants of forecast accuracy, the coefficient on AREV is negative and statistically significant in Models 2 and 3, which include our DAF and EVOL information uncertainty proxies, respectively, suggesting that more extreme forecast revisions among low information uncertainty firms leads to greater forecast accuracy. However, the coefficient on AREV in Model 4, which includes COV as the information uncertainty proxy, is positive and statistically significant, suggesting that the AREV-ACC relationship among low information uncertainty firms is mixed. We note that all of our other control variables (Reg FD, Ln(MV), BV/MV and SUE) in Models 2-4 have the same signs and significance levels as in Model 1, and the regressions also have reasonable explanatory power, which range from 29.9% to 31.1%, similar to the explanatory power in Model 1.
Overall, the regression results support our earlier univariate and bivariate findings, and suggest that the positive AREV-ACC relationship that is especially pronounced among high information uncertainty firms is not being driven by other firm-specific or industry factors.
18
Therefore, holding all else constant, we find strong support for overconfidence among analysts that make extreme forecast revisions.
4.3. Analyst-Level AREV Persistence
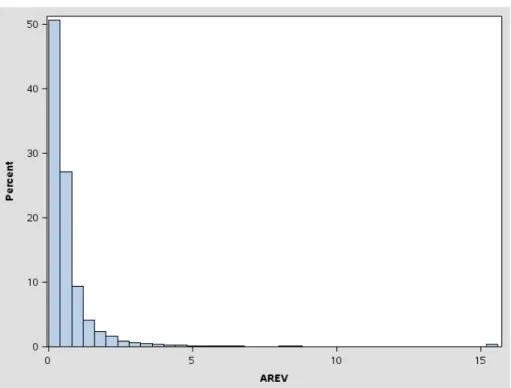
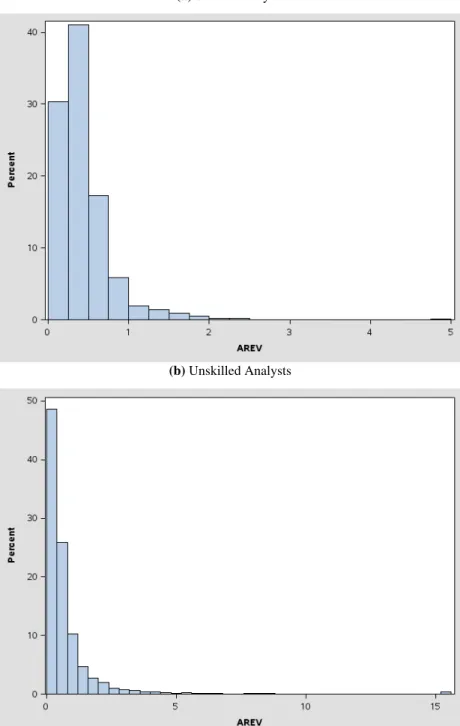
We now examine whether overconfidence, as measured by extreme forecast revisions, is persistent and thus more likely to be a behavioral trait rather than the result of random analyst errors. The empirical design in this subsection breaks the main sample used up until this point into subsamples of skilled and unskilled analysts. Skilled analysts are analysts that are in the top quintile in terms of career experience, defined as the number of months between an analyst’s first and last forecast. We hypothesize that analysts with relatively long careers are “skilled” in the sense of being able to retain their job. Unskilled analysts are the analysts whose careers are too short to qualify as skilled analysts. Examining persistence on the skilled and unskilled analyst subsamples is useful for two reasons. First, the main sample contains forecast revisions from analysts with very short careers. By definition, however, persistence should be continued or prolonged – qualities that cannot be attributed to analysts with short careers. Second, extreme or moderate forecast revisions have a strong impact on the analyst’s average forecast revision for analysts with short careers. This effect could produce outliers when examining year-over-year persistence, which are the result of a few randomly extreme or modest forecast revisions made during a short career, instead of being the product of a persistent tendency. Therefore, we retrieve all of the forecasts made by skilled and unskilled analysts from the main sample, yielding subsamples that contain 66% and 34% of all forecasts made in the main sample, respectively. We shed further light on this logic in Figures 2 and 3. In Figure 2 we present a frequency distribution of median analyst-level AREV over the analyst’s career for the main sample. The figure shows considerable variation in median career AREV, and in particular,
19
while 84% of analysts have median career AREV values between 0.00 and 1.00, 16% of analysts have median career AREV values in excess of 2.00, with some that exceed 5.00 and 15.00. In Figure 3, we present a frequency distribution of median analyst-level AREV for the subsamples of skilled and unskilled analysts. Focusing on the skilled analysts in Panel A, we still find that there is great variation in median career AREV, whereby on average some analysts make moderate revisions during their career while other analysts make extreme revisions during their career. More specifically, while there is a concentration of AREV values around 1.00, there are several absolute forecast revisions close to 0.00 and 2.00, and even exceeding 2.00, but there are no AREV values that exceed 5.00 in the subsample of skilled analysts. In contrast, for the unskilled analysts in Panel B, we find several extreme AREV values that exceed 5.00 and even exceeding 15.00, indicating that the outliers documented in the main sample in Figure 2 are forecast revisions made by analysts with short careers.
In Table 4 we provide additional evidence supporting the notion that the extreme (and moderate) forecast revisions provided by analysts are not the result of random errors, but are rather persistent, consistent with the extremeness of analyst forecast revisions representing a behavioral trait. In particular, Table 4 reports the percentage of analysts that change AREV quintile from one year to the next, averaged over all of the years in the sample. We form portfolios by sorting the sample into yearly average analyst AREV. We then form a yearly 5 × 5 matrix by calculating the percentage of analysts in each quintile that stay in the same quintile or move to another quintile in the subsequent year. We report the results for the main sample (all analysts) in Panel A, and we also report the results for the skilled analysts and unskilled analysts in Panels B and C, respectively. The results for all analysts in Panel A indicate that analysts who provide extreme (moderate) forecast revisions tend to provide extreme (moderate) forecast
20
revisions in the subsequent year. Specifically, we find that 46.90% of the analysts who provide extreme forecast revisions (top AREV quintile) provide extreme forecast revisions in the subsequent year. Similarly, we find that 45.28% of the analysts who provide moderate forecast revisions (low AREV quintile) provide moderate forecast revisions in the subsequent year. These results cast doubt on the idea that the extreme forecast revisions provided by analysts are due to random chance rather than being a behavioral trait, since the same analysts are consistently providing extreme forecast revisions. If extreme (moderate) forecast revisions were due to random chance, then we would expect 20% of the analysts who provide extreme (moderate) forecast revisions in a year to provide extreme (moderate) forecast revisions in the subsequent year. The results on the subsample of skilled and unskilled analysts also produce similar results, and interestingly, the persistence is slightly greater for skilled analysts than for unskilled analysts. In particular, for the skilled analysts in Panel B, we find that 48.79% of the analysts who are in the top AREV quintile are in the top AREV quintile in the subsequent year, and 48.78% of the analysts who are in the low AREV quintile are in the low AREV quintile in the subsequent year. Meanwhile, for the unskilled analysts in Panel C, we find these percentages to be slightly lower, whereby 43.69% of the analysts who are in the top AREV quintile are in the top AREV quintile in the subsequent year, and 41.33% of the analysts who are in the low AREV quintile are in the low AREV quintile in the subsequent year.
In sum, we find strong support for the persistence of overconfidence bias, indicating that overconfidence is a behavioral trait rather than random analyst errors. In particular, the results in this subsection show that analysts persistently make extreme or moderate forecast revisions, and this persistence is greater for skilled analysts compared to unskilled analysts.
21
5.1. Univariate and Bivariate Raw and Factor-Adjusted Returns Results
Thus far we have presented evidence in support of analyst overconfidence and its persistence. Since investors rely on analyst forecasts in their decision to buy and sell stocks, we conjecture that analyst overconfidence is likely correlated with investor overconfidence, which in the presence of limits to arbitrage leads to overvaluation followed by underperformance. In this section we provide evidence for this hypothesis by examining the relationship between AREV and returns for univariate portfolios of stocks sorted monthly by AREV as well as bivariate portfolios of stocks sorted monthly by AREV and our information uncertainty proxies. If extreme forecast revisions are correlated with investor overconfidence, then we expect a decreasing AREV-return relationship, which will be much more pronounced for high information uncertainty firms than for low information uncertainty firms.
The returns results are reported in Table 5. In Panel A we present the results for raw returns (RET), and in Panel B we present the results for factor-adjusted returns (FARET), where FARET is the portfolio’s monthly factor-adjusted return in percent from Fama and French (1993) three-factor regressions involving equal-weighted monthly calendar-time returns.10 Focusing on Panel A, we find that while average RET is not monotonically decreasing in AREV, firms in the top AREV quintile underperform firms in the bottom AREV quintile by 0.20% monthly, or 2.40% annually (0.20% × 12). While the univariate difference is indicative of investor overconfidence, the economic significance is not staggering. However, when we examine the AREV-RET relationship between high information uncertainty firms and low information uncertainty firms, the results become more telling. Remarkably, we find that average returns are monotonically decreasing in AREV for High DAF firms, but that this negative relationship does not hold for Low DAF firms. Specifically, the high minus low AREV
22
difference is −0.63% for High DAF firms and a positive 0.26% for Low DAF firms. This result shows that the underperformance of extreme forecast revisions relative to modest forecast revisions is specific to high information uncertainty firms. This finding also sheds further light on the low economic significance that we document in the univariate high minus low AREV returns result; among low information uncertainty firms, either behavioral biases are unimportant or limits to arbitrage are not binding, or both. We also examine the AREV-RET relationship split by EVOL and 1/COV, and find that our conclusions remain the same.
In Panel B we present the results for factor-adjusted returns, which control for standard risk characteristics. Focusing first on the univariate sorts, we find that firms in the top AREV quintile underperform firms in the bottom AREV quintile, where the high minus low AREV portfolio yields a −0.31% monthly factor-adjusted return (−3.72% annually), but is statistically insignificant.11 However, similar to the Panel A results for raw returns, the results become telling when we split the sample between high information uncertainty firms and low information uncertainty firms. Focusing first on our DAF proxy for information uncertainty, we find that for High DAF firms, the high minus low AREV portfolio has a −0.58% return (−6.96% annually), compared to a 0.45% monthly return (5.40% annually) for Low DAF firms. Our results are qualitatively similar and economically more significant for our alternative information uncertainty proxies. The high minus low AREV return for High EVOL firms is −0.71% (−8.52% annually), which is substantially lower than the positive but statistically insignificant high minus low AREV return of 0.23% (2.76% annually) we find for Low EVOL firms. Similarly, the high minus low AREV return is −0.76% (−9.12% annually) for high 1/COV firms, and a statistically insignificant 0.17% (2.04% annually) for Low 1/COV firms.
11
For factor-adjusted returns, the high minus low portfolios are not the difference between a high and a low portfolio, but are rather hedge portfolios that go long on high AREV firms and short on low AREV firms.
23
Overall, the Table 5 results are consistent with our conjecture that analyst overconfidence is correlated with investor overconfidence. For both raw and factor-adjusted returns, we find that firms with extreme forecast revisions underperform firms with modest forecast revisions mainly for firms with high information uncertainty, which are precisely those firms that are the most prone to behavioral biases. We note that that the Table 5 results do not control for other potential determinants of returns, and so we turn to a multivariate analysis in the next subsection.
5.2. Return Regressions 5.2.1. Pooled Regressions
In Table 6 we present multivariate regression results where the monthly raw returns are the dependent variable. The main variables and interactions of interest, as we well as the control variables, are the same as those found in Table 3. The empirical prediction of the overconfidence hypothesis is a negative coefficient on each of our interaction terms between AREV and our information uncertainty proxies, which says that firms with extreme forecast revisions underperform firms with modest forecast revisions mainly among high information uncertainty firms.
Focusing on Model 1, which does not include any of our interaction terms, we find the coefficient on AREV to be positive (coefficient of 0.04) and statistically significant. Thus, contrary to the Table 5 univariate results, after controlling for other known determinants of returns, more extreme forecast revisions lead to higher returns, on average, across the whole sample. We also include each of our information uncertainty proxies in Model 1, and find a negative coefficient on each proxy (DAFQ, EVOLQ, and COVQ), indicating a negative relationship between information uncertainty and returns. The negative and statistically significant coefficient on Reg FD indicates that returns have been lower, on average, after the
24
enactment of Regulation FD. This result likely reflects the poor performance of stocks in the wake of the dot.com bubble and during the 2007-2008 financial crisis. We further find the coefficient on Ln(MV) to be negative and statistically significant, and the coefficient on BV/MV to be positive and statistically significant, which signifies that smaller firms and value firms earn better returns. Lastly, in Model 1, we find a positive and statistically significant coefficient on standardized unexpected earnings, SUE, which is consistent with the prior literature.
We glean insight into the overconfidence hypothesis in Model 2, where we include the interaction between AREV and our information uncertainty proxy, DAFQ. We exclude our other proxies for the moment, but include the Reg FD, Ln(MV), BV/MV and SUE control variables. We find that the coefficient on AREV × DAFQ is negative and statistically significant, which says that as disagreement among analysts increases, extreme forecast revisions are associated with lower returns. In Model 3 we employ our alternative information uncertainty proxy, EVOLQ, and find similar support for the overconfidence hypothesis. Specifically, we find the coefficient on AREV × EVOLQ to be negative and statistically significant, which shows that for firms with greater earnings volatility, the most extreme forecast revisions predict incrementally lower returns. The Model 4 results for our analyst coverage proxy also yields very similar results, where the coefficient on AREV × COVQ is negative and statistically significant. We note that in Models 2-4 the signs and significance of the coefficients on our other control variables are similar to those found in Model 1. These results provide strong support for the overconfidence hypothesis, which predicts that behavioral biases should be more pronounced among the most informationally uncertain firms, and hence should lead to greater underperformance.
25
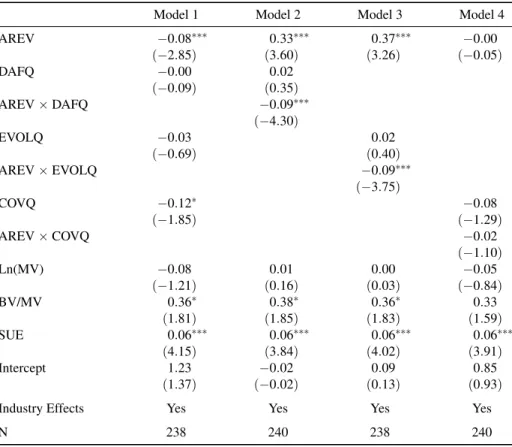
As a further robustness, we also adopt the Fama and MacBeth (1973) panel regression methodology to examine the effect of extreme forecast revisions on returns, and the differential effect between high versus low information uncertainty firms. Each month, we conduct cross-sectional regressions of returns on each of the variables of interest and control variables from Table 6 (excluding Reg FD and calendar year dummy variables). These results are reported in Table 7 and yield qualitatively similar results as those found in Table 6. In Model 1, when no interaction terms are included, contrary to the pooled regression results from Table 6 and consistent with the univariate results from Table 5, we find the coefficient on AREV to be negative and statistically significant, implying that holding all else constant, more extreme forecast revisions leads to lower future returns. In Models 2-4 we include the interaction terms between AREV and our information uncertainty proxies (i.e. AREV × DAFQ, AREV × EVOLQ, and AREV × COVQ). The coefficients on each of these interaction terms is negative, and statistically significant for AREV × DAFQ and AREV × EVOLQ, but statistically insignificant for AREV × COVQ. Thus, the results indicate that the negative AREV-RET relationship is mainly found for high information uncertainty firms, consistent with the overconfidence hypothesis. We do not find the coefficient on firm size, Ln(MV), to be significant in any of the models, and we find the coefficient on BV/MV to be positive in each model, and statistically significant only in Models 1-3. The coefficient on standardized unexpected earnings, SUE, is positive and highly statistically significant in each model, consistent with the prior literature. Overall, the Fama-MacBeth regression results support the pooled return regression results from Table 6, and the univariate and bivariate returns results from Table 5, providing further support for the overconfidence hypothesis.
26
The evidence up to this point provides compelling evidence that analysts providing extreme forecast revisions are overconfident such that they make less accurate forecasts, and this effect is found to be more pronounced for high information uncertainty firms compared to low information uncertainty firms. In this section, we examine whether analyst overconfidence changes with analyst experience in the subsample of skilled analysts to see whether analysts can learn to be less overconfident. We use the subsample of skilled analysts in order to eliminate the possibility of inadvertently capturing skill when examining learning from experience.
6.1. AREV and Forecast Accuracy Portfolio Results for Skilled Analysts by Analyst Experience
In this subsection, we examine analyst forecast accuracy (ACC) by univariate AREV portfolios and bivariate portfolios of AREV and our information uncertainty proxies (DAF, EVOL, and 1/COV) for high and low analyst experience (EXP) subsamples. The portfolios are formed on the skilled analyst subsample (as discussed earlier) into AREV, DAF, EVOL, COV and EXP quintiles independently.
Table 8 reports the average accuracy (ACC) results for univariate AREV portfolios as well as bivariate portfolios between AREV and information uncertainty by analyst experience. Focusing first on the univariate portfolio results, we find that ACC is monotonically increasing in the AREV quintiles overall in both the Low EXP and High EXP subsamples. Interestingly, however, the high minus low AREV difference is lower for inexperienced analysts (4.59) in Panel A compared to experienced analysts (4.71) in Panel B, which suggests that experienced analysts are more overconfident than inexperienced analysts, and thus providing evidence contrary to analyst learning. When we turn to the bivariate portfolio results between AREV and information uncertainty, we find that the high minus low AREV difference (i.e. Q5–Q1) is higher for high information uncertainty firms compared to low information uncertainty firms in
27
both the Low EXP and High EXP subsamples. However, we find that for high information uncertainty firms, the high minus low AREV difference is higher for experienced analysts compared to inexperienced analysts, while for low information uncertainty firms, the high minus low AREV difference is smaller for experienced analysts compared to inexperienced analysts, indicating that experienced analysts are more overconfident for high uncertainty firms and less overconfident for low uncertainty firms. These findings are consistent across each of our information uncertainty proxies – DAF, EVOL, and 1/COV.
6.2. Forecast Accuracy Multivariate Regressions for Skilled Analysts by Analyst Experience
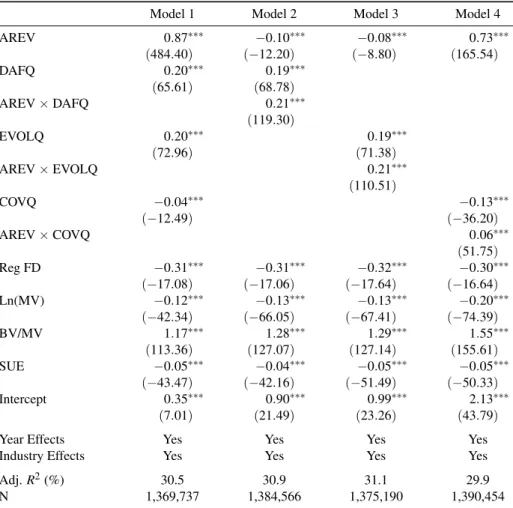
In Table 9 we examine the effect of average absolute forecast revisions (AREV) and AREV and information uncertainty interactions on forecast accuracy between analyst experience (EXP) subsamples, while controlling for other potential determinants of forecast accuracy in a multivariate framework. In Model 1 we present the results excluding any interaction terms, and find that the coefficient on AREV in the Low EXP subsample (0.82) is statistically significant and smaller than the statistically significant coefficient on AREV in the High EXP subsample (0.87), which is consistent with the univariate results in Table 8. Thus, after controlling for other determinants of forecast accuracy, we continue to find that experienced analysts are more overconfident than inexperienced analysts in that more extreme forecast revisions are associated with less accurate earnings forecasts. We also note that the coefficient on each of our information uncertainty proxies is statistically significant and smaller in the High EXP subsamples compared to the Low EXP subsamples, which implies that experienced analysts provide more accurate forecasts compared to inexperienced analysts for high information uncertainty firms, holding all else constant. Models 2-4 report the regression results that include the interaction terms between AREV and our information uncertainty proxies. In each of the models we find that the
28
coefficient on the interaction between AREV and information uncertainty is positive and statistically significant, which implies that more extreme forecast revisions for high uncertainty firms leads to lower forecast accuracy. We further find that the coefficient on the interaction between AREV and our information uncertainty proxies is higher in the High EXP subsamples compared to the Low EXP subsamples, with the exception of our DAF proxy, which is marginally lower for experienced analysts compared to inexperienced analysts. Similar to the Table 3 accuracy regression results, we find mixed results for the AREV-ACC relationship among low information uncertainty firms once we control for other determinants of forecast accuracy. Specifically, the coefficient on AREV is negative and statistically significant in Models 2 and 3 for our DAF and EVOL information uncertainty proxies, respectively, but positive and statistically significant in Model 4 for our COV information uncertainty proxy. Moreover, while there appears to be learning in Models 3 and 4 among low information uncertainty firms, this does not hold in Model 2. The Table 9 regression results are thus consistent with our Table 8 univariate and bivariate results in that there does not appear to be evidence supporting the notion that analysts learn to become less overconfident, particularly for high information uncertainty firms. We note that while our other control variables are significant and consistent across each of the models, they do not explain away any of our main findings and effects, implying that our results are robust.
Overall, the results in this section show that in the subsample of skilled analysts, the difference in accuracy between extreme and modest forecast revisions is greater for experienced analysts than for inexperienced analysts, and this result is mainly found among high information uncertainty firms, providing evidence that experienced analysts are more overconfident than inexperienced analysts for high information uncertainty firms. On the other hand, we find that
29
among low information uncertainty firms, the difference in accuracy between extreme and modest forecast revisions is smaller for experienced analysts than for inexperienced analysts, providing evidence that experienced analysts are slightly less overconfident than inexperienced analysts for low information uncertainty firms.
7. Conclusions
In this paper, we test and confirm that analysts who make extreme forecast revisions are overconfident. We find that analysts who provide extreme forecast revisions are much less accurate than analysts who provide modest forecast revisions, and the decrease in forecast accuracy is substantially more pronounced in high information uncertainty firms than in low information uncertainty firms. In addition, we find that the analyst overconfidence we document is persistent. We further examine stock returns to see whether analyst overconfidence leads to stock market underperformance, which models of overconfidence predict if analyst overconfidence is correlated with investor overconfidence and there are market frictions or limits to arbitrage. We find that a portfolio of extreme forecast revisions underperforms a portfolio of modest forecast revisions in high information uncertainty firms, while the difference between these two portfolios is largely insignificant in low information uncertainty firms. The significantly larger effect for high information uncertainty firms is consistent with the prediction that individuals are more prone to behavioral biases for firms in which information is sparse, or when there is a lack of accurate feedback about a firm's fundamentals (e.g. Daniel et al., 1998; Hirshleifer, 2001). Finally, we find that the analyst overconfidence we document is not reduced through learning, but rather increased.
Overall, the evidence in this paper strongly supports the notion that analysts who provide extreme forecast revisions are overconfident, especially in valuing firms with high information
30
uncertainty. However, our tests are joint tests of overconfidence and the correctness of the models we are using. Therefore, it is always possible that our results are due to model misspecification. To mitigate this concern, we use multiple models in testing our overconfidence hypothesis and in testing the relationship between overconfidence and stock-market performance. Furthermore, while our results are convincing, there are two alternative explanations for the findings in this paper: risk and random chance. A risk explanation requires extreme analyst forecast revisions to be from less risky firms in order to lead to lower stock returns. The finding that extreme analyst forecast revisions are less accurate makes this explanation unlikely. Also, we risk-adjust returns using standard risk factors and find results that are as statistically and economically significant as with raw returns. It could also be argued that the results found in this paper are due to random chance (i.e. spurious correlation found through extensive data-snooping). We do not believe that our results are due to random chance since we provide evidence of overconfidence at three levels: analyst forecast accuracy, information uncertainty, and stock market returns. Furthermore, the magnitude, persistence, and significance of our findings make it unlikely that they are the result of data mining.
31 References
Agarwal, S., J. C. Driscoll, X. Gabaix, and D. Laibson, 2011, Learning in the Credit Card Market, NBER Working Paper 13822.
Alpert, M., and H. Raiffa, 1982, A Progress Report on the Training of Probability Assessors, in D. Kahneman, P. Slavic, L. A. Tversky (Eds.), Judgment under Uncertainty: Heuristics and Biases, 294-305, Cambridge, England: Cambridge University Press.
Arrow, K. J., 1962, The Economic Implications of Learning by Doing, Review of Economic
Studies 29, 155-173.
Barnea, A., H.S. Cronqvist, S. Siegel, 2010, Nature or Nurture: What Determines Investor Behavior?, Journal of Financial Economics 98, 583-604.
Berkman, H, V. Dimitrov, P. C. Jain, P. D. Koch, and S. Tice, 2009, Sell on the News: Differences of Opinion, Short-Sales Constraints, and Returns around Earnings Announcements, Journal of Financial Economics 92, 376-399.
Beyer, A., D. A. Cohen, T. Z. Lys, and B. R. Walther, 2010, The Financial Reporting
Environment: Review of the Recent Literature, Journal of Accounting and Economics 50, 296-343.
Bloomfield, R., R. Libby, and M. W. Nelson, 1999, Confidence and the Welfare of Less-Informed Investors, Accounting, Organizations and Society 24, 623-647.
Carhart, M. M., 1997, On Persistence in Mutual Fund Performance, Journal of Finance 52, 57-82.
Chan, L. K.C., N. Jegadeesh, and J. Lakonishok, 1996, Momentum Strategies, Journal of
Finance 51, 1681-1713.
Chan, L. K.C., N. Jegadeesh, and J. Lakonishok, 1999, The Profitability of Momentum Strategies, Financial Analysts Journal 99, 80-90.
Chen, Q., and W. Jiang, 2006, Analysts’ Weighting of Private and Public Information, Review of
Financial Studies 19, 319-355.
Chordia, T., S.-W. Huh, and A. Subrahmanyam, 2007, The Cross-Section of Expected Trading Activity, Review of Financial Studies 20, 709-740.
Clement, M., 1999, Analyst Forecast Accuracy: Do Ability, Resources, and Portfolio Complexity Matter?, Journal of Accounting and Economics 27, 285-303.
Clement, M. B., and S. Tse, 2003, Do Investors Respond to Analysts’ Forecast Revisions as if Forecast Accuracy Is All that Matters?, The Accounting Review 78, 227–249.
32
Cronqvist, H., and S. Siegel, 2013, Why Do Individuals Exhibit Investment Biases?, Working Paper.
Daniel, K. D., D. Hirshleifer, and A. Subrahmanyam, 1998, Investor Psychology and Security Market Under- and Overreactions, Journal of Finance 53, 1839-1886.
Das, S., R.-J. Guo, and H. Zhang, 2006, Analysts’ Selective Coverage and Subsequent Performance of Newly Public Firms, Journal of Finance 61, 1159-1189.
DeBondt, W.F. and R. Thaler, 1995, Financial Decision-making in Markets and Firms: A Behavioral Perspective, Handbooks in OR & MS 9, 385–410.
Diether, K. B., C. J. Malloy, and A. Scherbina, 2002, Differences of Opinion and the Cross Section of Stock Returns, Journal of Finance 57, 2113-2141.
Fama, E. F., and K. R. French, 1993, Common Risk Factors in the Returns on Stocks and Bonds,
Journal of Financial Economics 33, 3-56.
Fama, E. F., and J. D. MacBeth, 1973, Risk, Return, and Equilibrium: Empirical Tests, Journal
of Political Economy 81, 607-636.
Feng, L. and M. S. Seasholes, 2005, Do Investor Sophistication and Trading Experience Eliminate Behavioral Biases in Financial Markets?, Review of Finance 9, 305-351.
Fischhoff, B., P. Slovic, and S. Lichtenstein, 1977, Knowing with Certainty: The Appropriateness of Extreme Confidence, Journal of Experimental Psychology: Human
Perception and Performance 3, 552-564
Friesen, G., and P. A. Weller, 2006, Quantifying Cognitive Biases in Analyst Earnings Forecasts,
Journal of Financial Markets 9, 333-365.
Gervais, S., and T. Odean, 2001, Learning to be Overconfident, The Review of Financial Studies 14, 1-27.
Gleason, C. A. and M. C. Lee, 2003, Analyst Forecast Revisions and Market Price Formation,
The Accounting Review 78, 193-225.
Hilary, G., and L. Menzly, 2006, Does Past Success Lead Analysts to Become Overconfident?,
Management Science 52, 489-500.
Hirshleifer, D., 2001, Investor Psychology and Asset Pricing, Journal of Finance 64, 1533-1597. Hong, H., T. Lim, and J. C. Stein, 2000, Bad News Travels Slowly: Size, Analyst Coverage, and
the Profitability of Momentum Strategies, Journal of Finance 55, 265-295.
Koestner, M., S. Meyer, and A. Hackethal, 2012, Do Individual Investors Learn from their Mistakes?, Working Paper.
33
List, J. A., 2003, Does Market Experience Eliminate Market Anomalies?, Quarterly Journal of
Economics 118, 41-71.
List, J. A., 2011, Does Market Experience Eliminate Market Anomalies? The Case of Exogenous Market Experience, American Economic Review 118, 41-71.
Mikhail, M. B., B. R. Walther, and R. H. Willis, 1997, Do Security Analysts Improve their Performance with Experience?, Journal of Accounting Research 35, Supplement, 131-166. Mikhail, M. B., B. R. Walther, and R. H. Willis, 2003, The Effect of Experience on Security
Analyst Underreaction?, Journal of Accounting and Economics 35, 101-116.
Miller, E. M., 1977, Risk, Uncertainty, and Divergence of Opinion, Journal of Finance 32, 1151-1168.
Montgomery, A. L., and E. T. Bradlow, 1999, Why Analyst Overconfidence about the Functional Form of Demand Can Lead to Overpricing, Marketing Science 18, 569-583.
Shleifer, A., and R. W. Vishny, 1997, The Limits of Arbitrage, Journal of Finance 52, 35-55. Sinha, P., L.D. Brown, and S. Das, 1997, A Re-examination of Financial Analysts’ Differential
Earnings Forecast Accuracy, Contemporary Accounting Research 14, 1-42.
Stickel, S. E., 1991, Common Stock Returns Surrounding Earnings Forecast Revisions: More Puzzling Evidence, The Accounting Review 66, 402-416.
Stickel, S. E., 1992, Reputation and Performance among Security Analysts, Journal of Finance 47, 1811-1836.
Wurgler, J., and E. Zhuravskaya, 2002, Does Arbitrage Flatten Demand Curves for Stocks?,
Journal of Business 75, 583-608.
Zhang, X. F., 2006a, Information Uncertainty and Stock Returns, Journal of Finance 61, 105– 137.
Zhang, X. F., 2006b, Information Uncertainty and Analyst Forecast Behavior, Contemporary