RESEARCH PAPER
Title: Compensatory mechanisms mitigate the effect of warming and drought on wood formation
Authors : Lorena Balducci1*, Henri E. Cuny2, Cyrille B.K. Rathgeber2, Annie Deslauriers1, Alessio Giovannelli3, Sergio Rossi1
Affiliation :
1
Département des Sciences Fondamentales, Université du Québec à Chicoutimi, 555 Boulevard de l’Université, Chicoutimi, QC G7H2B1, Canada
2
INRA, UMR 1092 LERFOB, F-54280 Champenoux, France
3
CNR-IVALSA, Via Madonna de Piano, 50019 Sesto Fiorentino, (FI), Italy.
*Corresponding authors: E-mail: lorena.balducci1@uqac.ca, telephone +1 418-545-5011 ext. 2330, fax +1 418-545-5012
4.1 ABSTRACT
Due to global warming, high-latitude ecosystems are expected to experience increases in temperature and drought events. Wood formation will have to adjust to these new climatic constraints to maintain tree mechanical stability and long-distance water transport. The aim of this study is to understand the dynamic processes involved in wood formation under warming and drought. Xylogenesis, gas exchange, water relations and wood anatomy of Picea mariana (Mill.) B.S.P. saplings were monitored during a greenhouse experiment where temperature was increased during daytime or night-time (+6 °C) combined with a drought period. The kinetic of tracheid development, expressed as rate and duration of the xylogenesis sub-processes, was quantified using generalized additive models. Drought and warming had a strong influence on cell production, but a weaker effect on wood anatomy. The increase in cell production rate under warmer temperatures, and especially during night-time at the end of the growing season, was responsible for ring width increase. The weaker effect of treatments on wood anatomy was explained by a strong compensation between the rates and durations of cell differentiation processes that mitigates warming and drought effects on tree-ring structure. Our results allowed quantification of how wood formation kinetics is regulated under drought and warming, consenting trees to adapt to new environmental conditions.
Symbols/abbreviations and units:
T0, greenhouse with a similar temperature to that of external air temperature; T+day, greenhouse with temperature 6 °C higher than T0 during the day; T+night, greenhouse with temperature 6 °C higher than T0 during the night; Ψpd, pre-dawn leaf water potential;
Ψmd, midday leaf water potential; gs, stomatal conductance; Amax, maximum photosynthesis
rate; DOY, day of the year; VWC, volumetric water content of soil; radial number of cambial (nC), enlargement (nE), lignification and wall thickening (nWT), mature (nM) and total cells (nTotal); means of durations of cell enlargement (dE, days) and wall thickening
(dW, days); cell production rate by cambial zone, rC cells day-1; mean rates of cell
differentiation (radial diameter enlargement rate, rE, µm day-1, and wall deposition rate, rW ,
4.2 INTRODUCTION
Since the mid-20th century, frequency, duration and magnitude of heat waves have increased (Perkins et al., 2012), and recent climate projections predict temperatures of 3 to 6 °C higher by 2100 (IPCC, 2013). Several studies have reported that the recent warming is more pronounced at high latitudes (Brönnimann et al., 2009, Vincent et al., 2012, Wang et al., 2013). In these regions, the night-time temperature changes faster than daytime temperature (Donat et al., 2013). In the early century, these trends were recorded for the Canadian boreal forest, with increases in summer temperatures being reported by some authors (Bonsal et al., 2001, Casati & De Elía, 2014). How these changes could influence tree growth and forest stand productivity in these regions remains an open question (Price et al., 2013). In particular, the widely distributed black spruce [Picea mariana (Mill.) B.S.P.] is the most important species of the North American boreal forest, and could be especially sensitive to global warming. Dendrochronological studies showed that black spruce located at high latitude could benefit from global warming because of a lengthening of the growing season, while radial growth in the southern regions might be negatively affected by warming (Huang et al., 2010).
An increase of regional precipitations has been observed in North America, but higher temperatures can lead to faster and greater evaporation with a consequent change in soil moisture and drought intensity (Donat et al., 2013, Seneviratne et al., 2012, Villarini et al., 2013). Water deficit induces a stress response in plants that is modulated at different levels in tissues and organs depending on intensity and duration of the stress. Water deprivation
provokes turgor loss in developing tissues. The decreasing of hydrostatic turgor pressure within the cell induces responses of plant stress perception (i.e. stomatal closure and/or decreasing of photosynthate production) and intermediate physiological processes (i.e. lower plant water potential and decrease in cell volume) (Kranner et al., 2010, Savidge, 2001) and finally a reduction in plant growth. Recent research showed that the response of secondary meristem to soil water depletion is faster and stronger than primary meristem response (Berta et al., 2009, Bogeat-Triboulot et al., 2007, Giovannelli et al., 2007). During growth development, the negative effect of abiotic stresses (multiple stresses) could be compensated by the recovery of stem growth and cambial activity or other wood traits. In this context, the plant meristem (i.e. cambium) displays different sensitivity according to the duration and intensity of stress, as well as different recovery capacity after a stress. The capacity of the cambium to resume activity after stress determines the capacity of the plant to compensate for the depressing effect of the stress on growth. Compensatory change among architectural, xylem traits and properties can result in a property remaining unchanged, with the plant retaining the same level of performance (Lachenbruch & McCulloh, 2014). A comprehensive investigation of the relative importance of cambial activity and xylem traits under climate change thus appears crucial.
Wood formation (xylogenesis) is a complex and highly dynamic process characterized by successive phases of cell production and differentiation: cell division, radial enlargement and secondary wall formation (Denne & Dodd, 1981). This mechanism is fundamental for plant functioning, because xylem structure provides mechanical stability and long-distance water transport. Regarding this, the number of studies on wood formation in adult trees has
increased considerably in recent years (Cuny et al., 2012, Fonti & Jansen, 2012, Gričar et al., 2011). Many studies provide interesting insights into wood formation and the influence of environmental conditions, such as drought (Gričar et al., 2006, Moser et al., 2010, Oberhuber & Gruber, 2010), warming and drought (Balducci et al., 2013, Fonti et al., 2013) and ozone (Richet et al., 2012). However, such intra-annual investigations, although accurate, are often limited to static variables, such as number of cells, which are insufficient to describe the dynamic processes occurring during secondary growth and to unravel the finer mechanisms of environmental influences. An accurate quantification of the dynamics of xylogenesis indeed appears to be a necessary endeavor to better understand environmental influences, as it comprises the mechanisms through which climatic factors are mediated to tree-ring structure (Cuny et al., 2014). For example, the duration and rate of cell enlargement determine the final cell radial diameter, while the duration and rate of wall-material deposition determine the amount of secondary cell wall. In turn, the ratio between the total amount of wall material deposited for one cell and the final size of this cell, determine the changes in lumen dimension (diameter and area), wall thickness, and wood density profile along conifer tree-rings (Cuny et al., 2014). A precise assessment of the kinetics (i.e. timings, durations and rates) of cell development is therefore crucial to obtain a mechanistic understanding of how stresses influence wood anatomy and, as a result, plant functioning and performance In this sense, recent works have demonstrated that Generalized Additive Models (GAMs) are particularly suitable to precisely and fully characterize wood formation dynamics (Cuny et al., 2013, 2014), opening a door to the mechanistic understanding of how climatic variations, extreme
events and, more generally, environmental stresses influence wood formation and the resulting tree-ring structure.
Temperature plays a crucial role among environmental factors, because it is the main abiotic driver directly influencing cambium resumption in the stem (Begum et al., 2010, Begum et al., 2013, Oribe et al., 2001). However, the well-known temperature effects are limited in time and restricted to cambium reactivation within the stem. Recent researches have described the various effects on whole plants: warming decreased carbon storage in the xylem and the imbalance of plant water status during xylogenesis can influence the sugars available for radial growth (Deslauriers et al., 2014). Photosynthesis (i.e. the main carbon source) can be greatly reduced during drought, and it has been shown that this is more marked under higher temperatures (Balducci et al., 2015). In this context, the need to understand the detailed mechanisms of xylogenesis under controlled drought and warming becomes a priority. The hydromechanical response to water stress implies first a reduction in cell expansion (Proseus et al., 2000) and then, under prolonged water stress, a decline in cambial cell division (Abe et al., 2003, Muller et al., 2011, Pantin et al., 2013). Saplings can be especially vulnerable to drought (de Luis et al., 2011, Rossi et al., 2009) and major susceptibility is observed in boreal species (Balducci et al., 2015, Peng et al., 2011). Past studies considered that the rate of growth is influenced by environment, in particular the total cell production (Denne & Dodd, 1981, Horáček et al., 2003). A recent study showed that radial growth and cambium activity were highly sensitive to water imbalance, but, after re-watering, surviving plants were able to resume radial growth showing a certain resilience to abiotic stresses (Balducci et al., 2013). All these studies highlighted the effect
of stress on xylogenesis but without clarifying in detail which sub-processes were more altered and which were more involved in the growth recovery.
The aim of this study was to evaluate the mechanisms by which water deficit in combination with night and day warming influence the sub-processes of xylogenesis and how these are translated in the tree-ring anatomy. We monitored the dynamics of wood formation, assessed the kinetics of cell differentiation and quantified the resulting tree-ring structure in saplings of black spruce. Preliminary results have shown that in a multistress experiment (drought and warming) cambium was more affected by drought during stress imposition whilst warmer temperature determined higher cambium activity in the irrigated condition. We tested the following hypotheses that i) water deficit and warming will modify the rate and duration of xylogenesis (cell division, enlargement and cell wall thickness), inducing lower changes in the tracheid lumen, diameter and cell wall thickness and ii) daytime and night-time warming can lengthen the kinetics of xylogenesis after the resumption of irrigation in stressed plants, determining a compensatory effect of stem growth and mitigating the effect of water stress on xylem traits.
4.3 MATERIALS AND METHODS
4.3.1 Experimental design
The experiment was conducted during the 2011 growing season in Chicoutimi, QC, Canada (48° 25’ N, 71° 04’ W, 150 m above sea level) on 4-year-old black spruce saplings. In the summer of 2010, the saplings were sheltered and maintained in the open air until spring 2011. During the experiment, the saplings were growing in plastic reversed-conic pots (volume 4.5 l) filled with peat moss, perlite and vermiculite. In April 2011, 1104 saplings of uniform size (53 ± 8.8 cm in height and 10.4± 1.8 mm in diameter at the collar) were selected, fertilized with 1 g l-1 of NPK (20-20-20) fertilizer dissolved in 500 ml of water, and transferred to three greenhouses. Growth was monitored under three different thermal conditions: control temperature, named T0, equal to external air temperature; and two warming conditions named T+day and T+night, with temperature 6 °C warmer than T0 during the day (7.00 am - 19.00 pm) and during the night (19.00 pm - 7.00 am), respectively. Two different irrigation levels were applied for each thermal condition during the growing season: (i) control (named I, irrigated saplings), in which soil water content was maintained above 80% of field capacity; and (ii) water deficit (NI, non-irrigated saplings) in which irrigation was withheld for 25 days in June.
4.3.2 Water relations, gas exchanges and CO2 assimilation
Water relations, gas exchange and CO2 assimilation were measured from May to August
on branches of the first whorl of 3 saplings on a total 6 treatments (3 thermal conditions × 2 irrigation regimes). Pre-dawn [Ψpd] and midday [Ψmd] leaf water potential were measured
using a pressure chamber (PMS Instruments, Corvalis, OR). Gas exchange and CO2
assimilation (stomatal conductance gs, mol m-2 s-1 and maximum photosynthesis rate, Amax,
μmol m-2
s-1) were measured from 10.00 am to 13.00 pm under saturating irradiance conditions (1000 μmol m-2 s-1) using a portable photosynthesis system (Li-6400, LI-COR Inc., Lincoln, NB). Air temperature, vapor pressure deficit, CO2 concentration and
irradiance inside the chamber were maintained at 25 °C, 2.2 kPa, 400 µmol mol-1 and 1000 µmol m-2 s-1 photosynthetic photon flux density (PPFD), respectively. Measurements were expressed according to the specific needle surface area computed as ratio of needle dry mass per unit of needle surface area and using a regression (Bernier et al., 2001). For the same saplings, the volumetric water content (VWC) of the soil was measured weekly by time domain reflectometry (TDR Fieldscout 300). The measurements were taken twice per pot at 7 cmdepth (Topp et al., 1984).
4.3.3 Wood formation dynamics
A destructive sampling of 6 saplings, randomly selected each week from every treatment (3 thermal conditions × 2 irrigation regimes) for a total of 36 saplings per week, was performed from May to October. Stem disks were collected 2 cm above the root collar of
each sapling. The wood sections were stained with cresyl violet acetate (0.16% in water) and examined within 10-25 min with visible and polarized light at 400-500× magnification to distinguish the differentiation of xylem according to four distinct phases. For each section, the radial number of (1) cambial, (2) enlarging, (3) wall thickening and lignification and (4) mature cells were counted along three radial files. The total number of xylem cells was calculated as the sum of differentiating and mature cells. In the cambial zone, the cells were characterized by thin cell walls and small radial diameters (Rossi et al., 2006). Criteria for discriminating secondary wall formation in cells were the birefringence under polarized light and the coloration due to the reaction of cresyl violet acetate with lignin, which produced a color change from violet to blue when lignification was complete (Rossi et al., 2006). Thus, when a homogeneous blue color was present over the whole cell wall, cells were considered mature (Rossi et al., 2006).
4.3.4 Characterization of the dynamics of wood formation
In order to accurately characterize the dynamics of wood formation, a statistical approach was used based on generalized additive models (GAMs) developed by Cuny et al. (2013). A GAM is a generalized linear model (GLM) in which the linear predictor partly depends on some unknown smooth functions (Wood, 2006). The strength of GAMs lies in their flexibility, i.e. their ability to deal with non-linear and non-monotonic relationships between the response and the set of explanatory variables (GAMs are referred to as being data-driven). Because of this flexibility, GAMs have proved to be far more appropriate
than parametric approaches (e.g. GLMs) to model the complex linear and non-monotonous patterns that characterize wood formation dynamics (Cuny et al., 2013). For each treatment, GAMs were fitted to the number of cells recorded in the cambial, enlargement, wall thickening and lignification, and mature phases using the mgcv package (Wood, 2006) of the R statistical software (R Development Core Team, 2011). The average cell numbers predicted by the GAMs were then used to quantify the kinetics (timing, duration and rate) of the developmental phases (cell enlargement and cell-wall thickening) for the different tracheids produced. First, the dates of entry of tracheids into each development phase (cell enlargement, wall thickening and lignification, and mature phases) were computed. From these dates, the durations of cell enlargement (dE, days) and
wall thickening (dW, days) were calculated for the successive tracheids. The mean rates of
cell differentiation (radial diameter enlargement rate, rE, µm day-1, and wall deposition
rate, rW , µm2 day-1) were then estimated for each tracheid by dividing its final dimensions
(cell radial diameter and wall cross-sectional area, respectively) by the time it spent in the corresponding phases (dE and dW, respectively). In addition, the daily rate of cell
production was calculated as the difference between the total numbers of cells predicted by GAMs on consecutive days.
4.3.5 Woody cells features
Stem disks of 36 saplings (6 saplings × 3 thermal conditions × 2 irrigation regimes), randomly collected during the last three weeks in October, were stained with safranine (1% in water) and fixed on slides with a mounting medium. Digital images were recorded using
a camera mounted on a microscope to measure xylem features along three paths using WinCellTM (Regent Instruments Inc., Canada). For each cell along the paths, lumen radial diameter, lumen area, and cell-wall radial thickness were measured. The cell radial diameter was calculated as the sum of the lumen radial diameter and the double cell-wall radial thickness, and the wall cross-sectional area was estimated based on a constant ratio of 1.2 between the tangential and radial wall thickness (Rathgeber et al., 2006, Skene, 1972) and assuming rectangular-shaped tracheids (see Cuny et al. 2014 for detailed explanations). For each treatment, GAMs were fitted to cell diameter, cell wall area, lumen area, wall thickness using the mgcv package (Wood, 2006) of the R statistical software (R Development Core Team, 2011). To highlight the cell anatomical patterns in tree-ring structure by removing high-frequency variability, cell diameter, cell wall area, lumen area, and wall thickness were smoothed with GAMs using the mgcv package (Wood & Augustin, 2002) of the R statistical software (R Development Core Team, 2011).
4.3.6 Effects of temperature on rates of cell differentiation
From May to October 2011, across water and thermal treatments (2 irrigation regimes × 3 thermal conditions), Spearman’s rank correlations were used to assess the monotonic relationship between the mean rates of cell differentiation (cell production rate by cambial zone, rC cells day-1;radial diameter enlargement rate, rE, µm day-1, and wall deposition rate,
4.4 RESULTS
4.4.1 Growth conditions
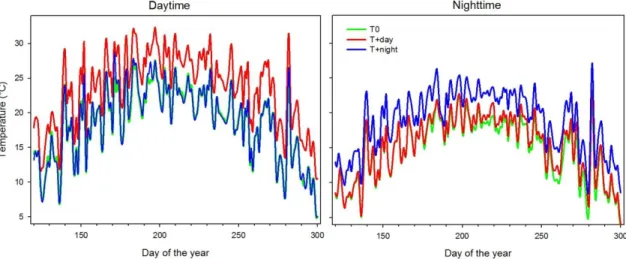
At the beginning of the experiment, the average daily air temperature in T0 greenhouse was 7 °C and increased to 12 °C in spring (April-May) (Fig. 4.1). Daily mean temperatures T+day and T+night were 4.5 and 5.2 K warmer on average than the T0 (external air temperature) treatment, and followed an evolution parallel to the T0. Maximum temperatures in T0 (around 24 °C) were reached in July. The temperature then gradually decreased to a minimum of 3.8 °C in October (Fig. 4.1). During the water deficit period, which lasted 25 days from DOY 158 to DOY 182, temperature in T0 ranged between 14 °C and 22 °C.
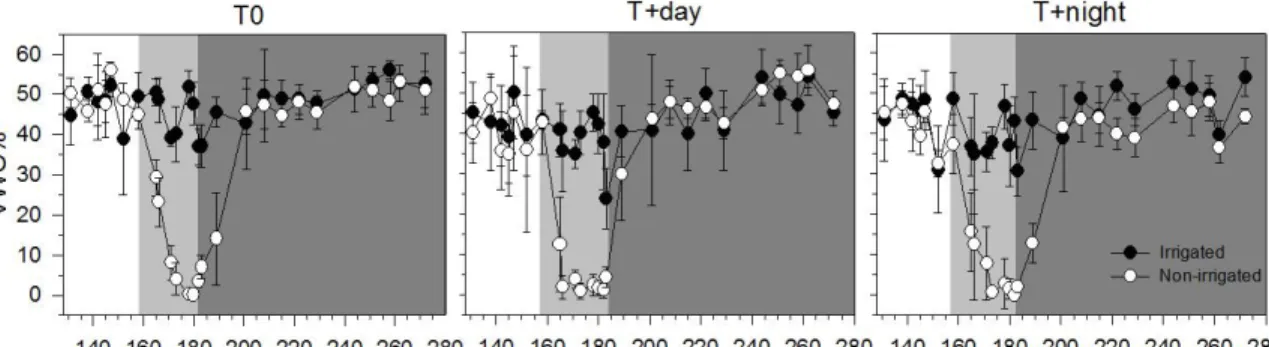
Volumetric water content (VWC) in non-irrigated saplings decreased in all thermal conditions during the water deficit period (Fig. 4.2). From DOY 183, VWC increased quickly after the resumption of irrigation, reaching field capacity on DOY 200 (Fig. 4.2). After this, the VWC remained at field capacity until the end of October.
4.4.2 Saplings water relations, gas exchanges and CO2 assimilation
From April to May, all saplings showed optimal water status (predawn leaf water potential at -0.5 MPa (Table 4.1). A similar pattern was observed in irrigated regimes for gas exchange and CO2 assimilation: mean average stomatal conductance gs, was 0.13 mol m-2s-1
after withholding irrigation, the predawn leaf water potential of non-irrigated saplings was lower than control saplings (-2.2 MPa versus -0.04MPa, respectively) with significant differences between thermal treatments. From DOY 171 to 181, lower values of Ψpd were
observed in nonirrigated saplings, with values reaching 2.1 MPa in T0, 1.97 MPa and -2.38 MPa in T+day and T+night, respectively. On DOY 166 until the end of the dry period (DOY 182), Amax of non-irrigated saplings decreased from about 9.42 to -0.03 μmol CO2
m-2 s-1 in all thermal conditions. After the resumption of irrigation the timing of the recovery of saplings was significantly affected by thermal regime. The non-irrigated saplings needed one week for the recovery of midday leaf water potential in control conditions. The recovery of predawn leaf water potential took two weeks in T+day and four weeks in T+night. In non-irrigated saplings, Amax responded after one week in T0, two
weeks in T+day and after four weeks in T+night. Gas exchange never recovered pre-stress levels in either temperature treatment.
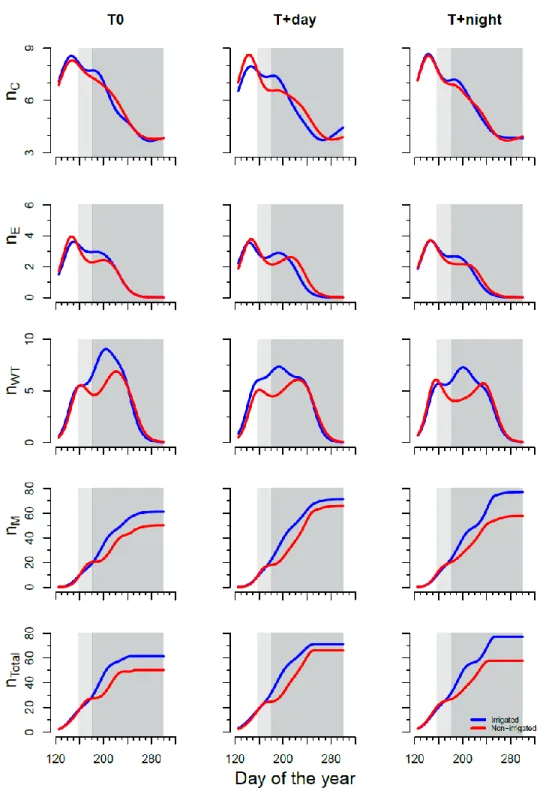
4.4.3 Wood formation dynamics
At the beginning of experiment, cell division was active in all treatments as 6-7 cells were observed in the cambial zone on DOY 125 (Fig. 4.3). The number of cambial cells increased at the end of May, on DOY 147 in T0 and on DOY 143 at warmer temperatures. The GAMs showed a curved shape with a peak at the beginning of the experiment and a progressive decrease around the end of August and beginning of September at warmer temperatures and T0, respectively. The end of cell production was reached when the number of cells in the cambial zone returned to being similar to that recorded during the
dormant state in all treatments. The number of cambial cells did not change between irrigation regimes. Saplings subjected to water deficit and growing under warmer nights (T+night) had fewer cambial cells than those growing in T0 regime. The number of cells in enlargement increased rapidly at the end of May in all treatments. The peak of cell enlargement ranged from the end of May to the beginning of June at warmer temperature and T0, respectively. During water deficit imposition, the number of cells in enlargement decreased significantly remaining stable until 3-4 weeks after water resumption in all thermal conditions, suggesting that fewer tracheids were entering differentiation (Fig. 4.3). In all treatments, the seasonal dynamics of the number of cells in the wall thickening and lignification phase showed bimodal curves with a first peak at the end of May and a second lower peak after the water deficit period (Fig. 4.3). The number of cells in thickening phase reached a maximum at the beginning of July in irrigated saplings (Fig. 4.3). In non-irrigated saplings the number of mature cells increased in the same manner as non-irrigated ones until the beginning of June, and then the increase slowed down for several weeks during the water deficit and recovery period.
4.4.4 Kinetics of tracheid development
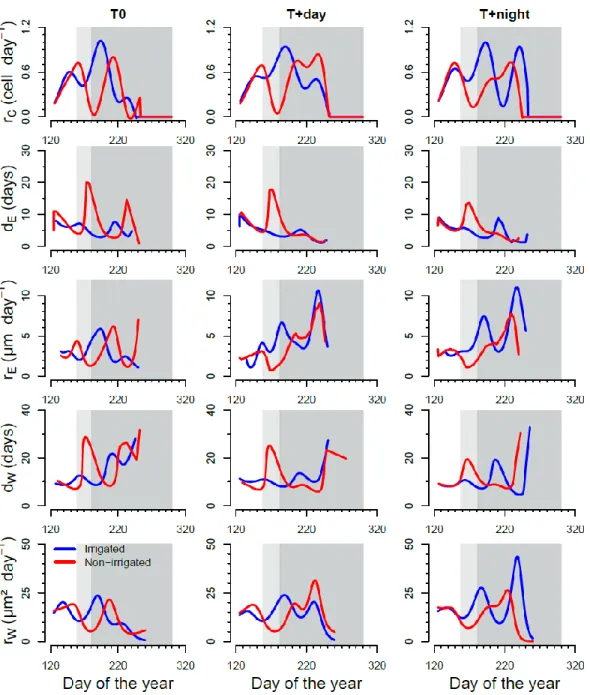
The rate of cell production in non-irrigated saplings showed a bimodal pattern; it followed a pronounced decrease during the drought period, increasing again as soon as irrigation restarted and decreased for a second time at the end of cell production (Fig. 4.4). The drop in cell production rate during drought explained the slowdown in the cell increment patterns of non-irrigated plants: the total number of mature cells stopped at about 25 cells
during drought while the total number of cells continued to increase for the irrigated saplings (Fig. 4.3). Irrigated saplings presented three changes in the growth rate (Fig. 4.4). A first peak was observed at the end of May, in correspondence to the culmination of the number of cells in cambium and in enlargement. A second peak occurred at the beginning of July when the number of cells in the wall thickening phase increased. The small dip at the end of August (T0) was more pronounced in T+day at a temperature higher than 23 °C, and a strong peak occurred at the beginning of September in T+night, when night-time temperature ranged between 19 and 24 °C (Fig. 4.4).
The warming and drought treatment affected the duration and rates of cell formation. The dE values of irrigated saplings exhibited very few changes during the growing season and
reached a maximum of 8-9 days in mid-July, while dE values of non-irrigated plants
increased about 3 fold (from 5 to 18 days) during water deficit, and then returned to the initial value (around 5 days) two weeks after the resumption of irrigation (Fig. 4.4). The increase in dE during water deficit was more pronounced for T0 and T+night than T+day.
On the contrary during water deficit, rE of non-irrigated saplings dropped about 3 fold
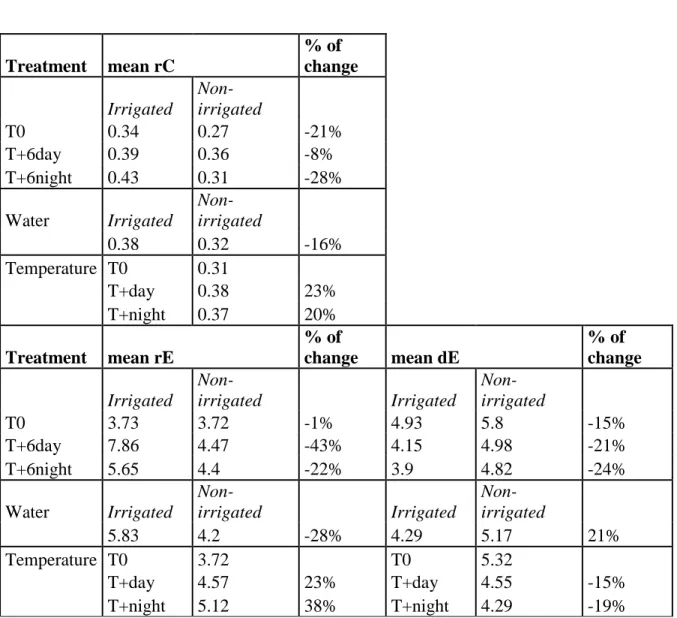
(from 3 to 1 µm day-1) and was lower than in irrigated ones. The duration of the enlargement phase in non-irrigated saplings was on average 21% longer than in irrigated saplings (5.17 days versus 4.29 days, respectively), but the rate of enlargement decreased by 28% (4.2 versus 5.83 µm day-1) (Table 4.2).
On average, the cell wall deposition rate lasted the same time (around 11 days) whatever the irrigation regime, but was 8% lower in non-irrigated than in irrigated saplings (17.7 vs. 16.2 µm² day-1, respectively) (Table 4.2). The irrigated saplings growing in the warmer
conditions (T+night and T+day) showed monotone patterns of rW with 2 abrupt peaks in
mid-July and mid-September, when temperature increased ranging between 19 and 25 °C. During day and night warming, rW was 14% and 28% faster than in T0 on average (Table
4.2).
During the drought period, the duration of cell wall formation (dW) in non-irrigated
saplings more than doubled (from 10 to 20-28 days) with a less pronounced increase at warmer day and night conditions, whereas it stayed constant (around 11 µm² day-1) in irrigated saplings (Fig. 4.4). Two weeks after the resumption of irrigation, the dW in
non-irrigated saplings returned to being similar to control ones (around 10 days). However, while dW increased in non-irrigated saplings during water deficit, the rate of cell wall
deposition (rW) decreased about 2 to 3 fold (from 15 to 5 µm² day-1) and was 37% lower
than control saplings. During daytime and night-time warming, dW was on average 22%
and 24% shorter than T0, respectively (Table 4.2).
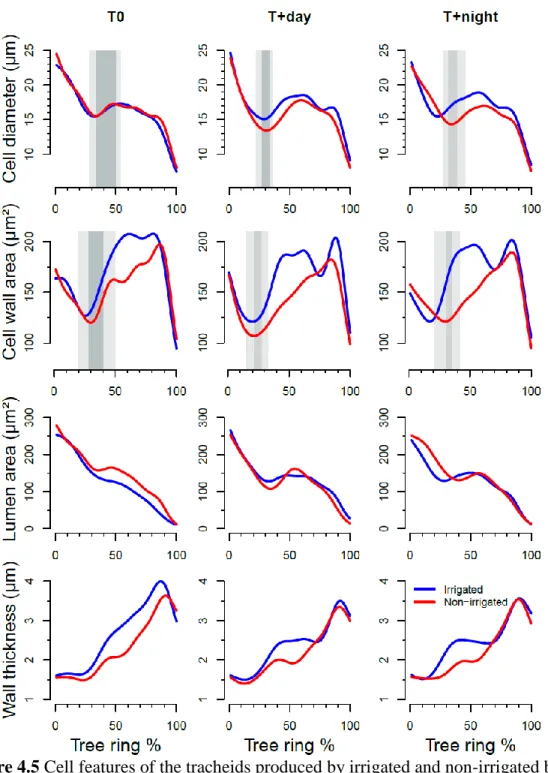
4.4.5 Woody ring features
Mature xylem cells in irrigated saplings were only 4% larger than in non-irrigated saplings (on average, 16.7 vs. 16.0 µm in radial diameter, respectively). Before water deficit imposition, cell diameter exhibited similar patterns in all treatments (Fig. 4.5). Twenty days after re-watering, only non-irrigated saplings in warmer conditions presented lower values than irrigated ones. From the end of July until the end of October, saplings growing in warmer conditions showed higher values than T0.
Cells of irrigated saplings exhibited 12% more cell wall area on average than those of non-irrigated saplings (167 vs. 148 µm² in wall cross area, respectively). The patterns of variation in cell wall area were similar among thermal conditions until the first week of water deficit imposition. At the end of water deficit (from DOY 170 to 181), the wall cross area of tracheids in non-irrigated saplings was clearly thinner than that in irrigated saplings. In addition, differences were observed between irrigation regimes according to thermal conditions. In T0 irrigated saplings reached 200 µm2 at the end of July and then decreased to around 50 µm2. Under warmer temperature, the cell wall area of irrigated saplings presented a bimodal pattern with two peaks in mid-July and the end of August (Fig. 4.5). In non-irrigated saplings, cell wall area ranged from 130 to 150 µm2 from the middle of the water deficit period until the end of July, and then showed maximum values shifted to September.
Lumen area was slightly different between irrigation regimes. Because they contained more wall material, cells of irrigated saplings had a lumen area 5% lower on average than cells of non-irrigated saplings (130 vs. 136 µm², respectively). The cells lumen area of the irrigated saplings in T0 progressively decreased from 250 µm2 to 20 µm2 or less along tree ring. In warmer conditions, cell lumen area of non-irrigated saplings remained stable during water deficit with values ranging around 150 μm2 until mid-July, and then reduced to 20-30 μm2 at warmer conditions at the end of autumn (Fig. 4.5).
Cell wall thickness also slightly differed according to the irrigation regime. Indeed, because they contained more wall material, cells of irrigated saplings had a wall about 11% thicker than those of non-irrigated saplings. From DOY 158 to DOY 166, it was quite
similar between all treatments (reaching around 2 µm, Fig. 4.5). From DOY 170, it remained at about 2 µm without increasing for non-irrigated saplings. By comparison, that of irrigated saplings kept increasing (T0) or reached values of about 2.5 to 3 µm in T+day and T+night. The maximum cell wall thickness was reached at the end of October, and was 3.6 µm in non-irrigated saplings and 4 µm in irrigated saplings.
4.4.6 Effects of temperature on rates of cell differentiation
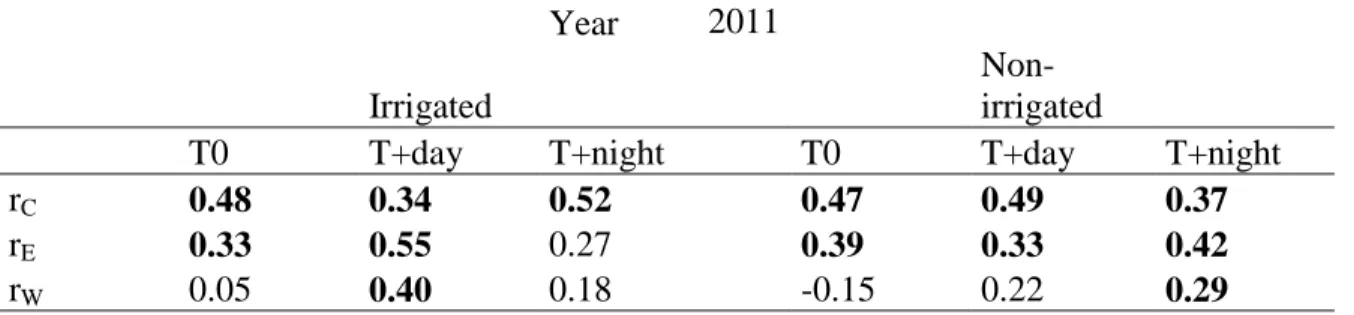
The value of cell production rate (rC) increased with the increasing of temperature during
the growing season with correlation ranging between 0.37 and 0.52 depending of the treatments (Table 4.3). The highest correlations in rC were found for T+night of irrigated
saplings followed by T+day in non-irrigated saplings. The highest correlation in rE was
found for T+day of irrigated saplings. No significant correlation was observed in rE for
T+night in irrigated saplings. In irrigated saplings, wall deposition rate was positive correlated only with T+day, while in non-irrigated saplings rW was correlated with T+night.
4.5 DISCUSSION
Water deficit combined with warmer conditions had a stronger influence on cell production than on tree-ring anatomy. Black spruce saplings strongly reduced cell production and our results indicate that plant water status (irrigated vs. non-irrigated) had a marked influence on radial cell production at different time scales, from the very beginning of water deprivation and until four weeks after irrigation resumption. The saplings responded to
water deprivation by considerably decreasing the rates of all sub-processes of xylogenesis (cell enlargement and wall deposition), but these rate reductions were compensated by increases in the durations of the corresponding sub-processes. During and after the water deficit period, these compensatory mechanisms strongly mitigated the impact of the drought and warming on wood anatomy. The irrigated saplings grown under warmer conditions maintained a high cell production rate at the end of the growing season, which was doubled during night-time warming. Our study therefore demonstrates strong effects of concomitant multiple stressors on xylem cell production rate and resulting tree-ring width, whereas compensatory mechanisms between rates and duration of cell differentiation processes mitigate stress impact.
4.5.1 Warming and drought influences on xylem cell production
The imposition of 25 days of water deficit strongly decreased cell production rate in non-irrigated saplings at all thermal conditions. Cell division was affected by water deficit, as observed in previous studies on young trees (de Luis et al., 2011, Rossi et al., 2009). We demonstrated that under reduced water availability, cell production was strongly inhibited. At the end of water deficit, the rate of cell production was reduced by 86% in non-irrigated saplings. We also observed that cambium is highly plastic and can resume cambial activity as soon as conditions become favorable for growth. This observation agrees with the decrease of cambial activity in both temperate-boreal (Gruber et al., 2010, Rossi et al., 2009) and Mediterranean species (Camarero et al., 2010, Vieira et al., 2013), where summer drought leads to fewer cells and, by result, to a thinner tree-ring width.
The dynamic mechanisms that influence the internal processes of cell production helped to reveal the recovery mechanism after drought at different temperatures. Our results allowed quantification of how wood formation kinetics is regulated under changing environments, consenting trees to adapt to new environmental conditions. The non-irrigated saplings greatly reduced their rate of cell production and rapidly restored cell division after water deficit. Indeed, during the deficit period, the rate of cell production in non-irrigated saplings was close to zero in T0 and T+day. Non-irrigated saplings showed fewer cells (temporary plateau) than irrigated saplings followed by a rapid increase in cell number (Fig. 4.3), which corresponded to a rapid rise in the cell production rate (Fig. 4.4). These results highlight the contrasting cases of tree-ring width and structure; the former being highly plastic and the latter very conservative. At T+night, the rate of cell production during water deficit did not decrease till zero, thus maintaining a low rate of production, allowing a faster increase in cell division after the water deficit period. At warmer night temperature, a higher number of mature cells was observed (+30%) compared with the other thermal conditions, suggesting the highest correlation between the rate of cell production and night temperature. The fast restoration of growth may be due to a physiological adjustment to maintain the flow of water uptake (Tan et al., 1992) as the leaf biomass of the plant (i.e. the transpiratory biomass) remains unchanged.
4.5.2 Xylem cell differentiation compensation under drought and warming
In non-irrigated saplings, a strong compensatory effect was revealed by the duration of the rate of xylogenesis processes, which were modulated during the water deficit period. While
the rates of enlargement and wall deposition decreased about 3 fold during water deficit, the durations of these processes increased 2-3 fold, thus mitigating the negative impact of water deficit on wood anatomy, especially on the lumen area. The existence of compensatory mechanisms that limit the impact of biotic stress on plants has been already demonstrated. For example, when defoliation occurs, growth is suppressed and growth compensation has also been proposed to sustain physiological process like photosynthesis, stomatal conductance and senescence (Collin et al., 2000, Striker et al., 2008, Iqbal et al., 2012). The occurrence of a compensatory effect could be caused by the necessity to maintain leaf efficiency and functionality, thus ensuring that enough water reaches the foliage for maintaining leaf physiological processes.
Turgor pressure constraints and carbon availability could explain this compensatory effect between duration and rate of xylogenesis processes. Turgor maintenance is required in all growth processes, from cell division to the deposition of cell wall polysaccharide (Proseus et al., 2000, Steppe et al., 2015). The observed drop in the rate of cell enlargement during water deficit corresponded to a water potential decrease, a direct effect of the decrease in osmotic potential because of solute accumulation in the living tissues (Major & Johnsen, 1999, Proseus et al., 2000). During short droughts, turgor pressure is maintained by an increase of osmotic concentrations or variations in the modulus of elasticity (Blake et al., 1991). The lack of adequate turgor pressure for fast cell enlargement was therefore probably compensated by an increase in the duration of the process. During drought, predawn and midday leaf water potential decreased dramatically to values close to -2.2 MPa (see Table 4.2), which drives an osmoregulatory response: under a ψpd of less than -1
MPa the concentration of raffinose increased proportionally with the decrease in ψpd for
osmoprotection and ROS scavenging (Deslauriers et al., 2014). These limits of osmoregulation could correspond to the moment when non-irrigated saplings applied a strong compensation between enlargement rate and duration to ensure the most optimal cell diameter.
Carbon constraints could also explain the compensatory effect occurring during cell wall formation. While drought decreased gas exchange during and after re-watering (gs and
Amax decline to zero at all thermal conditions, Table 4.2), higher day and night
temperatures led to higher hexose consumption (Deslauriers et al., 2014) due to increased respiration (Way & Oren, 2010). Reductions in the photosynthetic production thus imply a decrease in carbon allocation for growth. Carbohydrates play a central role in the modulation of xylogenesis (Ainsworth & Bush, 2011); indeed sugars represent the primary resource for cell division and wall deposition (Deslauriers et al., 2014, Giovannelli et al., 2007, Pantin et al., 2013). Because carbon was not completely depleted, sugars are more likely to be sequestered for osmoregulation and cannot fully sustain growth (Deslauriers et al., 2014, Pantin et al., 2013). Therefore, the non-availability of carbon for maintaining a high cell wall deposition rate was possibly compensated by an increase in process duration, ensuring more adequate deposition for the building of optimal cell walls.
We postulate that the observed compensation, represented by an increase in the duration over rate mitigated the drought impact on xylem anatomy. Cuny et al. (2014) highlighted the relative contribution of duration and rate of xylogenesis sub-processes in the resulting tree-ring anatomy: cell enlargement duration contributed to 75% of change in cell
diameter, while changes in cell wall thickness were principally attributed to changes in cell size (67%). In this study, cell diameter and lumen area were not modified, while cell wall thickness partially decreased. Indeed, the compensation of duration on rates of all the sub-processes of xylogenesis did not fully support cell wall deposition; this impact was evidenced in wood density by Balducci et al. (2015). The change in rate and duration of wall deposition contributes less (about 33%) to the wall thickness than cell size (Cuny et al., 2014). This confirmed that the compensation in cell enlargement occurs as a major driver in wood anatomy. We observed that water deficit reduced wall deposition rate first and more strongly than expansion rate, which means that a structural mechanism of compensation occurring in wood anatomy could prevent growth limitation. Under stressed conditions, the adaptation of the hydraulic system to drought involved the tree ring morphology. Indeed, under water deficit and warming, lighter value of wood density can reflect a lower carbon allocation for cell wall formation (Balducci et al., 2014).
4.6 CONCLUSION
In this study, we performed innovative analyses of the developing xylem and resulting wood anatomy in black spruce saplings grown under different water and thermal conditions, thus providing new insights into the influence of water stress and warming on plant development. The marked impact of drought and warming on cell production and the lower effect on wood anatomy is caused by dynamic processes during and after drought stress. Xylogenesis processes in black spruce cope with changing climate conditions to maintain an appropriate tree-ring anatomy. We demonstrate, for the first time, the existence of compensation mechanisms in response to abiotic stress in the process of wood formation. The compensation effects lead to a limited effect of multistress on xylem structure, a crucial aspect of plant functioning because xylem structure provides both mechanical stability and water transport. This study highlights the contrasting cases of tree-ring width and structure in saplings; the former being highly plastic and the latter very conservative. This strategy appears to be valuable for recovery after disturbance, but elucidating the compensatory mechanisms in conifers of the boreal forest is a priority for future research.
4.7 ACKNOWLEDGEMENTS
This study was funded by the Natural Sciences and Engineering Research Council of Canada and the Consortium Ouranos. We thank H. Morin, D. Gagnon, G. Savard, B. Allaire, C. Soucy, C. Bouchard, M. Beaulieu, M. Labrecque for their practical help and laboratory analyses. Additional thanks to A. Garside for checking the English text.
Table 4.1 Ecophysiological measurements of black spruce saplings before, during and after the water deficit at three thermal conditions (T0 control temperature; T+day, 6 °C higher daytime temperature; T+night, 6 °C higher night-time temperature).
Pre-dawn leaf water potential (Ψpd, MPa), CO2 assimilation (maximum photosynthesis rate, Amax, μmol m-2 s-1) and gas exchange
(stomatal conductance gs, mol m-2 s-1) are expressed in day of the year (DOY).
Year 2011
Irrigated Non-irrigated
Time (DOY) T0 T+day T+night T0 T+day T+night
Ψpd (MPa) Before (152) -0.50±0.10 -0.50±0.10 -0.48±0.02 -0.58±0.04 -0.4±0.10 -0.48±0.02 During (180) -0.50±0.10 -0.50±0.06 -0.58±0.06 -1.30±0.70 -1.09±0.80 -2.28±1.20 After (208) -0.40±0.08 -0.30±0.08 -0.28±0.05 -0.29±0.00 -0.28±0.05 -0.28 ±0.15 Amax Before (152) 7.41±4.20 8.34±4.50 6.13±0.06 7.15 ±2.00 9.42 ±5.40 6.38 ±0.05 (μmol m-2 s-1) During (180) 5.37±0.30 3.90±1.10 6.70±1.80 0.51 ±0.90 0.41 ±0.50 -0.03 ±1.00 After (208) 7.20±2.50 6.57±0.90 11.37±0.40 9.08 ±1.90 5.66 ±0.90 6.9 ±1.90 gs Before (152) 0.13±0.04 0.09±0.05 0.14±0.00 0.13 ±0.00 0.13 ±0.10 0.14 ±0.00 (mol m-2 s-1) During (180) 0.07±0.01 0.02±0.01 0.12±0.02 0.01 ±0.00 0.06 ±0.01 0.03 ±0.00 After (208) 0.06±0.03 0.05±0.02 0.07±0.00 0.07 ±0.03 0.04 ±0.01 0.06 ±0.02
Table 4.2 Means for rate of cell radial production (rC, µm day-1) in the cambial zone, rates
of enlargement (rE, days) and rate of wall deposition (rW µm2 day-1), for duration of
enlargement (dE, days) and duration of wall deposition (dW, days) in black spruce saplings
at three thermal conditions during the greenhouse experiment in 2011. Positive and negative values (% of change) are in bold and indicate positive and negative impact on rate
and duration between irrigation regimes, among thermal conditions.
Treatment mean rC % of change Irrigated Non-irrigated T0 0.34 0.27 -21% T+6day 0.39 0.36 -8% T+6night 0.43 0.31 -28% Water Irrigated Non-irrigated 0.38 0.32 -16% Temperature T0 0.31 T+day 0.38 23% T+night 0.37 20% Treatment mean rE % of change mean dE % of change Irrigated Non-irrigated Irrigated Non-irrigated T0 3.73 3.72 -1% 4.93 5.8 -15% T+6day 7.86 4.47 -43% 4.15 4.98 -21% T+6night 5.65 4.4 -22% 3.9 4.82 -24% Water Irrigated Non-irrigated Irrigated Non-irrigated 5.83 4.2 -28% 4.29 5.17 21% Temperature T0 3.72 T0 5.32 T+day 4.57 23% T+day 4.55 -15% T+night 5.12 38% T+night 4.29 -19%
Treatment mean rW % of change mean dW % of change Irrigated Non-irrigated Irrigated Non-irrigated T0 15 14.65 -3% 12.78 13.27 4% T+6day 16.2 17.67 9% 10.66 9.54 -10.50% T+6night 21.17 15.98 -24% 9.32 10.72 15% Water Irrigated Non-irrigated Irrigated Non-irrigated 17.68 16.24 -8% 10.79 11.01 2% Temperature T0 14.84 T0 13 T+day 16.91 14% T+day 10.12 -22% T+night 18.96 28% T+night 9.92 -24%
Table 4.3 Spearman correlations coefficients between the mean rates of cell differentiation (cell production rate by cambial zone, rC cells day-1;radial diameter enlargement rate, rE,
µm day-1, and wall deposition rate, rW , µm2 day-1) and daily mean temperature (°C) during
the greenhouse experiment in 2011. Thermal conditions are presented as control T0; temperature increase during the day, T+day; temperature increase during the night T+night.
Significant correlations (P≤0.05) are in bold.
Year 2011
Irrigated
Non-irrigated
T0 T+day T+night T0 T+day T+night
rC 0.48 0.34 0.52 0.47 0.49 0.37
rE 0.33 0.55 0.27 0.39 0.33 0.42
Figure 4.1 Mean of daytime (left figure) and night-time (right figure) temperatures experienced by black spruce saplings at the three thermal conditions during the greenhouse
Figure 4.2 Volumetric water content (VCW) of soil in irrigated (I) and non-irrigated saplings (NI) before, during and after the water deficit period (white, light grey and dark grey background) at three thermal conditions (T0 control temperature; T+day, 6 °C higher daytime temperature; T+night, 6 °C higher night-time temperature) during the greenhouse
Figure 4.3 Radial number of cambial (nC), enlargement (nE), lignification and wall thickening (nWT), mature (nM) and total cells (nTotal) were counted in black spruce saplings before, during and after the water deficit period (white, light grey and dark grey background). Blue and red curves indicate the number of cells in irrigated and non-irrigated
Figure 4.4 Rate of cell radial production (rC) in the cambial zone, rates of enlargement (rE)
and rate of wall deposition (rW), duration of enlargement (dE) and duration of wall
deposition (dW) as computed from generalized additive models (GAMs). Blue and red
curves indicate the number of cells in irrigated and non-irrigated saplings, respectively. White, light grey and dark grey background correspond to before, during and after the
Figure 4.5 Cell features of the tracheids produced by irrigated and non-irrigated black spruce saplings at three thermal conditions (T0 control temperature; T+day, 6 °C higher daytime temperature; T+night, 6 °C higher night-time temperature) before, during and after
the water deficit period. Blue and red curves indicate two irrigation regimes. Dark grey corresponds to cells with their entire enlargement (for curve of cell diameter) or their entire
4.8 REFERENCES
Abe H., Nakai T., Utsumi Y. & Kagawa A. (2003) Temporal water deficit and wood formation in Cryptomeria japonica. Tree Physiology, 23, 859–863.
Ainsworth E.A. & Bush D.R. (2011) Carbohydrate export from the leaf: a highly regulated process and target to enhance photosynthesis and productivity.(Update on Carbohydrate Export from the Leaf)(Report). Plant Physiology, 155, 64.
Balducci L., Deslauriers A., Giovannelli A., Beaulieu M., Delzon S., Rossi S. & Rathgeber C.B.K. (2015) How do drought and warming influence survival and wood traits of Picea mariana saplings? Journal of Experimental Botany, 66, 377-389.
Balducci L., Deslauriers A., Giovannelli A., Rossi S. & Rathgeber C.B.K. (2013) Effects of temperature and water deficit on cambial activity and woody ring features in Picea mariana saplings. Tree Physiology, 33, 1006–1017.
Begum S., Nakaba S., Oribe Y., Kubo T. & Funada R. (2010) Cambial sensitivity to rising temperatures by natural condition and artificial heating from late winter to early spring in the evergreen conifer Cryptomeria japonica. Trees, 24, 43–52.
Begum S., Nakaba S., Yamagishi Y., Oribe Y. & Funada R. (2013) Regulation of cambial activity in relation to environmental conditions: understanding the role of temperature in wood formation of trees. Physiologia Plantarum, 147, 46–54.
Bernier P.Y., Raulier F., Stenberg P. & Ung C.-H. (2001) Importance of needle age and shoot structure on canopy net photosynthesis of balsam fir (Abies balsamea): a spatially inexplicit modeling analysis. Tree Physiology, 21, 815–830.
Berta M., Giovannelli A., Potenza E., Traversi M.L. & Racchi M.L. (2009) Type 3 metallothioneins respond to water deficit in leaf and in the cambial zone of white poplar (Populus alba). Journal of Plant Physiology, 166, 521—530.
Blake T.J., Bevilacqua E. & Zwiazek J.J. (1991) Effects of repeated stress on turgor pressure and cell elasticity changes in black spruce seedlings. Canadian Journal of Forest Research, 21, 1329-1333.
Bogeat-Triboulot M.B., Brosche M., Renaut J., Jouve L., Le Thiec D., Fayyaz P., Vinocur B., Witters E., Laukens K., Teichmann T., Altman A., Hausman J.F., Polle A., Kangasjarvi J., Dreyer E. (2007) Gradual soil water depletion results in reversible changes of gene expression, protein profiles, ecophysiology, and growth performance in Populus euphratica, a poplar growing in arid regions. Plant Physiology, 143, 876-892.
Bonsal B.R., Zhang X., Vincent L.A. & Hogg W.D. (2001) Characteristics of daily and extreme temperatures over Canada. Journal of Climate, 14, 1959-1976.
Brönnimann S., Stickler A., Griesser T., Fischer A.M., Grant A., Ewen T., Zhou T.J., Schraner M., Rozanov E., Peter T. (2009) Variability of large-scale atmospheric circulation indices for the northern hemisphere during the past 100 years. Meteorologische Zeitschrift, 18, 379-396.
Camarero J.J., Olano J.M. & Parras A. (2010) Plastic bimodal xylogenesis in conifers from continental Mediterranean climates. New Phytologist, 185, 471–480.
Casati B. & De Elía R. (2014) Temperature Extremes from Canadian Regional Climate Model (CRCM) Climate Change Projections. Atmosphere-Ocean, DOI: 10.1080/07055900.2014.886179, 1-20.
Cuny H.E., Rathgeber C.B.K., Frank D., Fonti P. & Fournier M. (2014) Kinetics of tracheid development explain conifer tree-ring structure. New Phytologist, 203, 1231-1241. Cuny H.E., Rathgeber C.B.K., Lebourgeois F., Fortin M. & Fournier M. (2012) Life
strategies in intra-annual dynamics of wood formation: example of three conifer species in a temperate forest in north-east France. Tree Physiology, 32, 612–625. Cuny H.E., Rathgeber C.B.K., Senga Kiessé T., Hartmann F.P., Barbeito I. & Fournier M.
(2013) Generalized additive models reveal the intrinsic complexity of wood formation dynamics. Journal of Experimental Botany, 64, 1983-1994.
de Luis M., Novak K., Raventós J., Gričar J., Prislan P. & Čufar K. (2011) Cambial activity, wood formation and sapling survival of Pinus halepensis exposed to different irrigation regimes. Forest Ecology and Management, 262, 1630–1638. Denne M.P. & Dodd R.S. (1981) The environmental Control of Xylem Differentiation. In:
Xylem Cell Development, pp. 255.
Deslauriers A., Beaulieu M., Balducci L., Giovannelli A., Gagnon M.-J. & Rossi S. (2014) Impact of warming and drought on carbon balance related to wood formation in black spruce. Annals of Botany, 114, 335-345.
Donat M.G., Alexander L.V., Yang H., Durre I., Vose R., Dunn R.J.H., Willett K.M., Aguilar E., Brunet M., Caesar J., Hewitson B., Jack C., Klein Tank A.M.G., Kruger A.C., Marengo J., Peterson T.C., Renom M., Oria Rojas C., Rusticucci M., Salinger J., Elrayah A.S., Sekele S.S., Srivastava A.K., Trewin B., Villarroel C., Vincent L.A., Zhai P., Zhang X., Kitching S. (2013) Updated analyses of temperature and precipitation extreme indices since the beginning of the twentieth century: The HadEX2 dataset. Journal of Geophysical Research: Atmospheres, 118, 1-16.
Fonti P., Heller O., Cherubini P., Rigling A. & Arend M. (2013) Wood anatomical responses of oak saplings exposed to air warming and soil drought. Plant Biology (Stuttg), 15 Suppl 1, 210-219.
Fonti P. & Jansen S. (2012) Xylem plasticity in response to climate. New Phytologist, 195, 734-736.
Giovannelli A., Deslauriers A., Fragnelli G., Scaletti L., Castro G., Rossi S. & Crivellaro A. (2007) Evaluation of drought response of two poplar clones (Populus×canadensis Mönch ‘I-214’ and P. deltoides Marsh. ‘Dvina’) through high resolution analysis of stem growth. Journal of Experimental Botany, 58, 2673-2683. Gričar J., Rathgeber C.B.K. & Fonti P. (2011) Monitoring seasonal dynamics of wood
formation. Dendrochronologia, 29, 123-125.
Gričar J., Zupančič M., Čufar K., Koch G., Schmitt U. & Oven P. (2006) Effect of local heating and cooling on cambial activity and cell differentiation in the stem of Norway spruce (Picea abies). Annals of Botany, 97, 943-951.
Gruber A., Strobl S., Veit B. & Oberhuber W. (2010) Impact of drought on the temporal dynamics of wood formation in Pinus sylvestris. Tree Physiology, 30, 490-501.
Horáček P., Šlezingerová J. & Gandelová L. (2003) Analysis of cambial activity and formation of wood in Quercus robur under conditions of a floodplain forest. Journal of Forest Science, 49, 412-418.
Huang J., Tardif J.C., Bergeron Y., Denneler B., Berninger F. & Girardin M.P. (2010) Radial growth response of four dominant boreal tree species to climate along a latitudinal gradient in the eastern Canadian boreal forest. Global Change Biology, 16, 711-731.
IPCC (2013) Climate Change 2013: The Physical Science Basis. Contribution of Working Group I to the Fifth Assessment Report of the Intergovernmental Panel on Climate Change [Stocker, T.F., D. Qin, G.-K. Plattner, M. Tignor, S.K. Allen, J. Boschung, A. Nauels, Y. Xia, V. Bex and P.M. Midgley (eds.)]. pp. 1535. Cambridge University Press, Cambridge, UK and New York, NY, USA.
Kranner I., Minibayeva F.V., Beckett R.P. & Seal C.E. (2010) What is stress? Concepts, definitions and applications in seed science. New Phytologist, 188, 655-673.
Lachenbruch B. & McCulloh K.A. (2014) Traits, properties, and performance: how woody plants combine hydraulic and mechanical functions in a cell, tissue, or whole plant. New Phytologist, 204, 747-764.
Major J.E. & Johnsen K.H. (1999) Shoot water relations of mature black spruce families displaying a genotype × environment interaction in growth rate. II. Temporal trends and response to varying soil water conditions. Tree Physiology, 19, 375--382. Moser L., Fonti P., Büntgen U., Esper J., Luterbacher J., Franzen J. & Frank D. (2010)
Timing and duration of European larch growing season along altitudinal gradients in the Swiss Alps. Tree Physiology, 30, 225-233.
Muller B., Pantin F., Génard M., Turc O., Freixes S., Piques M. & Gibon Y. (2011) Water deficits uncouple growth from photosynthesis, increase C content, and modify the relationships between C and growth in sink organs. Journal of Experimental Botany, 62, 1715-1729.
Oberhuber W. & Gruber A. (2010) Climatic influences on intra-annual stem radial increment of Pinus sylvestris (L.) exposed to drought. Trees - Structure and Function, 24, 887-898.
Oribe Y., Funada R., Shibagaki M. & Kubo T. (2001) Cambial reactivation in locally heated stems of the evergreen conifer Abies sachalinensis (Schmidt) masters. Planta, 212, 684-691.
Pantin F., Monnet F., Jannaud D., Costa J.M., Renaud J., Muller B., Simonneau T., Genty B. (2013) The dual effect of abscisic acid on stomata. New Phytologist, 197, 65-72. Peng C., Ma Z., Lei X., Zhu Q., Chen H., Wang W., Liu S., Li W., Fang X., Zhou X.
(2011) A drought-induced pervasive increase in tree mortality across Canada’s boreal forests. Nature, 1, 467–471.
Perkins S.E., Alexander L.V. & Nairn J.R. (2012) Increasing frequency, intensity and duration of observed global heatwaves and warm spells. Geophysical Research Letters, 39, L20714.
Price D.T., Alfaro R.I., Brown K.J., Flannigan M.D., Fleming R.A., Hogg E.H., Girardin M.P., Lakusta T., Johnston M., McKenney D.W., Pedlar J.H., Stratton T., Sturrock R.N., Thompson I.D., Trofymow J.A., Venier L.A. (2013) Anticipating the
consequences of climate change for Canada’s boreal forest ecosystems. Environmental Reviews, 21, 322–365.
Proseus T.E., Zhu G. & Boyer J.S. (2000) Turgor, temperature and the growth of plant cells: using Chara corallina as a model system. Journal of Experimental Botany, 51, 1481-1494.
Quinn G. & Keough M. (2002) Experimental Design and Data Analysis for Biologists. Cambridge University Press, Cambridge, UK.
Rathgeber C.B.K., Decoux V. & Leban J.-M. (2006) Linking intra-tree-ring wood density variations and tracheid anatomical characteristics in Douglas fir (Pseudotsuga menziesii (Mirb.) Franco). Annals of Forest Science, 63, 699–706.
Richet N., Afif D., Tozo K., Pollet B., Maillard P., Huber F., Priault P., Banvoy J., Gross P., Dizengremel P., Lapierre C., Perre P., Cabane M. (2012) Elevated CO2 and/or
ozone modify lignification in the wood of poplars (Populus tremula x alba). Journal of Experimental Botany, 63, 4291-4301.
Rossi S., Deslauriers A. & Anfodillo T. (2006) Assessment of cambial activity and xylogenesis by microsamplings tree species: an example at the alpine timberline. IAWA Journal, 27, 383–394.
Rossi S., Simard S., Rathgeber C.B.K., Deslauriers A. & De Zan C. (2009) Effects of a 20-day-long dry period on cambial and apical meristem growth in Abies balsamea seedlings. Trees - Structure and Function, 23, 85-93.
Savidge R. (2001) Intrinsic regulation of cambial growth. In: J. Plant Growth Regul., pp. 52-77.
Seneviratne S.I., Nicholls N., Easterling D., Goodess C.M., Kanae S., Kossin J., Luo Y., Marengo J., McInnes K., Rahimi M., Reichstein M., Sorteberg A., Vera C., Zhang X. (2012) Changes in climate extremes and their impacts on the natural physical environment. In: IPCC Special Report on Extremes, 109-230.
Skene D. (1972) The kinetics of tracheid development in Tsuga canadensis carr. And its relation to tree vigour. Annals of Botany, 36, 179-187.
Steppe K., Sterck F. & Deslauriers A. (2015) Diel growth dynamics in tree stems: linking anatomy and ecophysiology. Trends Plant Sci. DOI: http://dx.doi.org/10.1016/j.tplants.2015.03.015.
Topp G.C., Zebchuk W.D., Davis J.L. & Bailey W.G. (1984) The measurement of soil water content using a portable TDR hand probe. Canadian Journal of Soil Science, 64, 313-321.
Vieira J., Rossi S., Campelo F., Freitas H. & Nabais C. (2013) Seasonal and daily cycles of stem radial variation of Pinus pinaster in a drought-prone environment. Agricultural and Forest Meteorology, 180, 173– 181.
Villarini G., Smith J.A. & Vecchi G.A. (2013) Changing frequency of heavy rainfall over the central United States. Journal of Climate, 26, 351-357.
Vincent L.A., Wang X.L., Milewska E.J., Wan H., Yang F. & Swail V. (2012) A second generation of homogenized Canadian monthly surface air temperature for climate trend analysis. Journal of Geophysical Research, 117.
Wang X.L., Feng Y. & Vincent L.A. (2013) Observed Changes in One-in-20 Year Extremes of Canadian Surface Air Temperatures. Atmosphere-Ocean, 52, 1-10.
Way D.A. & Oren R. (2010) Differential responses to changes in growth temperature between trees from different functional groups and biomes: a review and synthesis of data. Tree Physiology, 30, 669–688.
Wood S.N. (2006) Generalized Additive Models: an introduction with R, Boca Raton, FL: Chapman and Hall/CRC.
Wood S.N. & Augustin N.H. (2002) GAMs with integrated model selection using penalized regression splines and applications to environmental modelling. Ecological Modelling, 157, 157-177.