ISSN 1239-6095 (print) ISSN 1797-2469 (online) Helsinki 8 April 2016
Editor in charge of this article: Jukka Pumpanen
Black-spruce–lichen woodlands growth and carbon
drawdown potentials as revealed by mature stands
Boris Dufour
1)*, Jean-François Boucher
1), Pascal Tremblay
1), Daniel Mailly
2)and Daniel Lord
1)1) Université du Québec à Chicoutimi, Département des Sciences fondamentales, 555 boul. de l’Université, Chicoutimi (Québec) G7H 2B1, Canada (*corresponding author’s e-mail: boris_dufour@ uqac.ca)
2) Ministère de l’Économie, de l’Innovation et des Exportations, Direction du soutien aux organisations, 900 Place d’Youville, Québec (Québec) G1R 3P7, Canada
Received 28 Jan 2015, final version received 24 Oct. 2015, accepted 27 Oct. 2015
Dufour B., Boucher J.-F., Tremblay P., Mailly D. & Lord D. 2016: Black-spruce–lichen woodlands growth and carbon drawdown potentials as revealed by mature stands. Boreal Env. Res. 21: 71–86.
The afforestation of widely distributed boreal open woodlands such as lichen woodlands (LWs) could provide both a restoration of the closed-crown forest structure in the boreal forest and a mitigation measure against global warming. By comparing natural, mature stands of LW with their dense counterparts — black-spruce–feathermoss stands as a plan-tation surrogate — this study aims to validate the long-term LW growth support capacity for a high tree density and their carbon sequestration potential after afforestation. Our results reveal that the site potential of LWs can be either lower or equivalent to that of dense stands. This finding contradicts the paradigm of systematic lower tree growth in LWs. The site potential of LWs can be assessed by dominant tree volume at 50 years. This study also shows that the CBM-CFS3 model can simulate the conservative net carbon bal-ance of afforested LW, and, as such, can help reduce uncertainties regarding the long-term net carbon drawdown of afforested LWs.
Introduction
The accounting of the comprehensive impact of actions in the land-use, land-use change, and forestry (LULUCF) sector requires an accu-rate determination of the real net C drawdown from the atmosphere via biological sequestra-tion, using stand-based calculations for project-level accounting (IPCC 2003, Nabuurs et al. 2007). The closed-crown black-spruce–feather-moss (BSFM) forest dominates the continuous boreal forest in the province of Quebec (MRN 2003). While black spruce (Picea mariana), the main tree species in this zone, is generally
well adapted to wildfires (Viereck and John-ston 1990), post-fire regeneration failure can sometimes occur, resulting in the conversion of closed-crown BSFM to open woodlands (Payette 1992, Gagnon and Morin 2001, Jasinski and Payette 2005), such as lichen woodlands (LWs), which are very common in the boreal zone (Hustich 1966, Girard et al. 2008). There is cur-rently no evidence of natural redensification of LWs, i.e., a shift to closed-crown BSFM stands (Payette 1992, Jasinski and Payette 2005). The phenomenon is thus considered as irreversible. The causes for absence of natural redensification seem to be the scarcity of seed trees (Jasinski and
Payette 2005), poor seed germination on lichen mats (Morneau and Payette 1989, Sedia and Ehrenfeld 2003, Girard et al. 2009), and inter-ference from ericaceous shrubs (Thiffault and Jobidon 2006). It has been shown that between 1950 and 2002, 9% of BSFM stands and other closed-crown stands in Quebec’s boreal forest were converted to LW after wildfires (Girard et
al. 2008), indicating a net forest cover loss has
occurred, given the irreversibility of the phe-nomenon. The latest Quebec forest inventory (2002) reveals that approximately 7% (1.6 M ha) of the spruce-moss bioclimatic domain (within the forest management limits) was covered by open woodlands (3rd decennial forest inventory of Quebec’s Ministère des Ressources naturelles, MRN).
This progressive transition from closed-crown to open-forest stands has two important consequences from which this study arises. First, there might be a loss of productive forest (Côté
et al. 2013). Second, there may be a permanent
decrease of a potential carbon sink, not simply a transitory reduction, such as that occurs when a regenerative disturbance occurs (Kurz et al. 2008, Amiro et al. 2010, Dymond et al. 2010) . Given that regeneration failures responsible for the BSFM to LW transitions are caused by wild-fires that occur when the stand was left almost seedless by a previous disturbance (Payette et
al. 2000, Jasinski and Payette 2005, Girard et al. 2009, Brown and Johnstone 2012) and that
global warming scenarios suggest an increased impact from natural disturbances in the boreal region (Flannigan et al. 2005, Kurz et al. 2008, Amiro et al. 2009), this natural long-term open-ing of the boreal forest could result in a posi-tive feedback loop, thereby decreasing potential C sequestration and fuelling global warming further (Bony et al. 2006, Weaver et al. 2007, Heimann and Reichstein 2008, Matthews et al. 2009, Frank et al. 2010). However, the affores-tation of open boreal woodlands such as LWs could result in a restoration of the closed-crown forest structure in the boreal forest (Payette 1992, Gagnon and Morin 2001, Jasinski and Payette 2005) and provide a mitigation measure against anthropogenic global warming (Nabuurs
et al. 2007, Gaboury et al. 2009, Montenegro et al. 2009, Boucher et al. 2012).
Field data for sites having undergone LW afforestation do exist, however are limited in length (15 years of growth) as the studied planta-tions were established in 2000–2001 (Hébert et
al. 2006, Hébert et al. 2014). The initial results
from these sites suggest a slightly lower growth on planted LW as compared with planted BSFM, independent of abiotic conditions (spatially blocked in a split-plot design). This observation may be related to a lower soil temperature in LW due to a higher albedo for the lichen in these stands relative to that of feather-moss in BSFMs, as there is no detected nutritional effect (Hébert
et al. 2014) nor water status difference (Hébert et al. 2006). If this scenario is true, it is logical
to ask how growth would change over a longer period as a LW plantation grows and the albedo is reduced as the canopy closes. Planted trees in the LW may also be released from their competi-tion with the well-established shrub species, over this longer period.
However, there are no accurate long-term field measurements of growth and carbon balance in Canada’s afforested LW. Gaboury et al. (2009) simulated this balance, estimating the potential net C drawdown at 77 t C ha–1 for a
70-year-old black spruce plantation in boreal Quebec. A follow-up of these estimates, using a different modelling approach, provided a new set of net C drawdown values for boreal afforestation sce-narios, ranging from 58 to 97 t C ha–1 (after 70
years) depending on whether larch, black spruce, or jack pine was the planted species (Boucher
et al. 2012). Other studies used only general
assumptions that are difficult to apply to LW and show highly variable mean C drawdown values (Table 1). Bernier et al. (2011) studied LWs, but they assessed representative natural stands as the afforested scenario, not plantation surrogates, so this might explain the lower 21–42 t C ha–1
esti-mates relative to Gaboury et al. (2009). Nonethe-less, given this discrepancy in estimates and the fact that the value of 77 t C ha–1 of Gaboury et al.
(2009) is a simulated value, more precise long-term field data are required.
LW and BSFM within the North American closed-crown boreal forest are often co-occur-ring stand types that share similar site condi-tions in terms of climate, soil deposits, drainage, slope, aspect and time elapsed since a last
distur-bance (Payette 1992, Riverin and Gagnon 1996, Gagnon and Morin 2001, Jasinski and Payette 2005). Therefore, pairs of mature LW and BSFM stands established at those sites offer an opportu-nity to compare the site potential between these stand types, independent of abiotic conditions as evaluation occurs at tree-level. If tree-level site potential is shown to be comparable between both stand types, it could be assumed that site productivity is a matter of stem density. Fire-established, mature BSFM stands could then be considered as surrogates for afforested LW, as the higher stand productivity of BSFM should only be due to the much lower tree density in LW (Skovsgaard and Vanclay 2008, Madec et
al. 2012, Côté et al. 2013). Given this, data from
these BSFM could provide a suitable long-term validation of the C stocks and dynamics simu-lated so far for LW afforestation projects.
Spruce budworm outbreaks threaten conifer stands of the continuous boreal forest but are not as lethal for black spruce as for balsam fir (Nealis and Regniere 2004, Hennigar et al. 2008, Pothier et al. 2012). However, black spruce defoliation by budworms has been identified as a factor reducing growth for these trees (Tremblay
et al. 2011, Krause et al. 2012). Furthermore,
this budworm defoliation is a disturbance that reduces the LW seedbank thereby favouring the shift from BSFM to LW (Payette et al. 2000, Simard and Payette 2005, Girard et al. 2009). To date, the differing impacts of spruce budworm outbreaks for BSFM and LW remains unknown.
Given that the existing afforested LWs are only 15 years old (Hébert et al. 2014), BSFM that share similar abiotic conditions to the LW may be considered as plausible surrogates of mature afforested LW and provide a valid test for the long-term C stocking potential of
affor-ested LW. Testing this hypothesis first requires confirming that the tree-level growth potential of LW and BSFM is similar on comparable sites. Once confirmed, other objectives can use data from BSFM to validate the simulated C dynamics and stocking of afforested LW. The first objective aims to compare forest C dynam-ics using generic yield tables with C dynamdynam-ics using new yield tables based on field measure-ments of BSFM stands having similar attributes as LW but utilizing a stem density similar to that of plantations. The second objective aims to compare field measurements of carbon stocks at maturity with the published literature and simulated values (to validate the use of available simulation models). Finally, as spruce budworm would be expected to affect the way that LW and BSFM growth is compared, a last objective aims to relate budworm effects on spruce growth to variations of site potential.
Material and methods
Study area and sampling design
The study area is located in the continuous boreal forest subzone of Quebec’s boreal veg-etation zone, which includes two bioclimatic domains: the spruce–moss and balsam-fir–white-birch (MRN 2003). The first domain, which is also the northernmost one, is extensively domi-nated by black spruce, often growing in pure stands. Forest dynamics are characterized by fires occurring in cycles extending eastward, as such jack pine can dominate in places where fires are frequent and balsam fir is generally found in areas where fires are relatively scarce. In the second domain, the main stand type is
Table 1. Net C drawdown assumptions used in high-latitude afforestation studies.
Net C drawdown (t C ha–1) Region considered Reference
21–42 Boreal Quebec (Canada) Bernier et al. (2011)
60 Boreal Canada Betts (2000)
50–75 Boreal Canada Betts et al. (2007)
55 Boreal latitudes Claussen et al. (2001)
100 Global Gibbard et al. (2005)
dominated by conifers (balsam fir and white spruce) in association with white birch. The fire cycle is generally longer than that of the spruce– moss domain, but places exist where fires are rather frequent, allowing black-spruce and jack-pine-dominated stands to occur. LWs are very common throughout the continuous boreal forest, representing 54% of the 1.6 M ha open woodlands. A patchy distribution of LWs spreads from north to south throughout the subzone (i.e., across both domains), although decreasing in extent moving southwards (Girard et al. 2008).
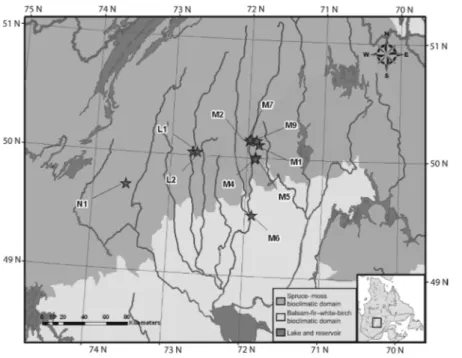
In 2003–2004, a randomized complete block design (Quinn and Keough 2002) was estab-lished in the continuous boreal forest subzone (Fig. 1). Each of the ten blocks embeds two plots established on adjacent but differing stand types (BSFM and LW). Ecoforestry maps were used to select candidate pairs, matching stands of a block in terms of vegetation, tree age, aspect, slope, as well as surficial deposit type and its thickness. Field measurements and observations validated the match for each pair (Table 2). Tree cover density was confirmed as ≥ 80% for BSFM and < 40% for LW. The latter’s tree cover is higher than that in the case study by Gaboury et al. (2009), which was < 25%, as a compromise had to be established owing to the difficulty in finding very low cover LWs growing next to BSFMs on
a same site and originating from the same distur-bance. The occurrence of less contrasted pairs, i.e. using 40% tree cover as the maximum value, was high enough to match the needs for this study, considering all the logistical restrictions. Conformity to the chosen criteria was validated in the field and only pairs matching these criteria were selected, ensuring that only the vegetation dynamics (tree density and growth patterns) were different between stands within each pair (block).
Every selected BSFM stand was dominated by black spruce having an even-aged structure and showed a high stem density and a closed canopy with a dense mat of feather mosses (Pleurozium schreberi, Ptillium
crista-castren-sis, Hylocomium splendens, Polytrichum sp.).
Eri ca ceous shrubs (Ledum groenlandicum,
Kal-mia angustifolia, Vaccinium angustifolium)
were sometimes present, covering up to 20% of the ground surface. Selected LWs were open stands dominated by black spruce, their forest floor being more than 40% covered with lichens (Cladina stellaris, C. rangiferina and C. mitis) and more than 25% with ericaceous shrubs.
Sampling
A 400-m2 circular sampling plot was established Fig. 1. Locations of blocks
Table 2
. Characteristics, pairwise
ANOV
AR, and stand type comparison of the 20 studied stands.
Block Stand Composition a Surficial Deposit Forest Slope Drainage Age Site Dominant Mean Density Spruce Basal Volume Dominants & percentage deposit thickness floor (%) (years) b index Vol50 (m 3) b DBH (stems ha –1) c density area (m 3 ha –1) c Vol. of basal area (cm) thickness (m) b (cm) c (stems ha –1) c (m 2) c Age ¥ stand (cm) p > F d L1 LW BS 65; JP 35 Glacial > 100 35 14 Mod. 75.7 10.2 0.0525 5.7 700 525 8.1 28.54 0.0002 L1 BSFM BS 84; TA 13; JP 3 Glacial 50–100 15 35 Well 77.3 13.9 0.1262 12.2 2550 2125 42.3 226.40 L2 LW BS 81; WB 19 Glacial 25–50 10 0 Mod. 77.3 6.3 0.0215 3.4 75 75 0.9 2.62 0.0001 L2 BSFM BS 100 Glacial 50–100 10 5 Mod. 76.7 9.9 0.0938 10.7 2850 2825 42.4 199.55 M1 LW BS 100 Glacial > 100 11 16 Mod. 87.7 9.8 0.0685 6.5 650 650 8.4 30.42 0.0280 M1 BSFM BS 88; BF 10; EL 2 Glacial > 100 16 20 Mod. 86.7 10.6 0.0509 7.6 2675 2375 32.6 133.59 M2 LW BS 100 Glacial > 100 12 8 Mod. 80.7 9.3 0.0601 5.6 425 425 6.5 27.98 0.0106 M2 BSFM BS 80; WB 20 Glacial 25–50 6 23 Well 80.7 14.3 0.2107 15.5 1625 1075 40.4 254.85 M4 LW BS 100 Glacial 50–100 6 23 Well 69.3 9.1 0.0620 6.3 275 275 5.6 26.25 0.1 170 M4 BSFM BS 99; BA 1% Glacial 25–50 5 28 Well 75.7 11.7 0.0942 11.2 2300 2250 41.4 230.27 M5 LW BS 100 Glacial 25–50 11 16 Mod. 71.0 8.5 0.0555 6.8 575 575 7.2 24.82 0.0281 M5 BSFM BS 99; WB 1% Glacial 25–50 4 30 Well 76.7 11.2 0.1454 9.8 2650 2600 44.8 232.92 M6 LW BS 75; JP 19; TA 6 Fluvio-glacial > 100 11 7 Well 60.3 13.5 0.1682 6.1 525 400 11.8 64.29 0.4996 M6 BSFM BS 75; TA 25 Fluvio-glacial > 100 9 6 Well 60.3 15.9 0.1839 13.5 2300 1775 41.7 250.58 M7 LW BS 97; TA 3 Glacial 25–50 20 46 Well 81.5 11.0 0.0723 4.8 850 825 10.9 40.77 0.1343 M7 BSFM BS 92; TA 5; WB 3 Glacial < 50 (outcrops) 20 33 Well 83.0 13.1 0.0950 11.8 2725 2425 41.0 201.42 M9 LW BS 100 Glacial 25–50 12 13 Well 87.0 10.6 0.0986 5.3 775 775 13.7 60.23 0.1735 M9 BSFM BS 100 Glacial 50–100 12 14 Well 89.7 12.3 0.1073 12.7 3375 3375 51.9 264.37 N1 LW BS 91; JP 9 Fluvio-glacial > 100 4 9 Mod. 89.3 10.8 0.0758 5.4 1125 1075 14.7 61.92 0.01 15 N1 BSFM BS 93; BF 6; WB 1 Glacial 50–100 7 12 Mod. 95.3 12.6 0.1 171 12.9 2825 2550 50.9 310.05 Mean e LW 15.2 77.9 9.9 0.0735 5.59 598 550 8.79 36.78 BSFM 20.6 80.2 12.6 0.1225 11.79 2588 2350 42.95 230.40 Dif f. 5.4 2.3 2.7 0.049 6.2 1990 1800 34.16 193.62 p > χ 2 0.2894 0.6495 0.0052 0.0191 0.0002 0.0002 0.0001 0.0002 0.0002 a) BS = black spruce; JP = jack pine; T A = trembling aspen; WB = white birch; BF = balsam fir; EL = eastern larch; BA = black ash.
b) Mean from the three harvested dominant trees. V
ol50
refers to the mean tree volume of dominants at 50 years.
c) Mean of all the commercial trees in the plot (DBH > 9 cm). d) Results
of block by block ANOV AR, within-subject the Greenhouse-Geisser test. V alues set in boldface indicate significant dif ference ( α = 0.05) in volume growth between BSFM and L W . e) p > χ 2 1 refers to a Wilcoxon mean comparison between L W and BSFM. V alues set in boldface indicate significant dif ference (α = 0.05).
in each of the 20 stands. Diameter at breast height (1.3 m, DBH) was measured on every tree using a caliper. Three individual, dominant black spruce trees were felled in order to assess the growth potential of the site (Pardé and Bouchon 1988, Mailly and Gaudreault 2005). These trees had to display a single stem (no fork), no obvi-ous leaf area reduction, no decay and no sign of juvenile growth suppression. Veteran trees were also avoided. Stem discs were sampled at stump height (0 m), 0.3 m, 0.6 m, 1.0 m, 1.3 m, 2 m, and at each successive complete metre in order to conduct stem analysis. Discs were then taken to the laboratory and rubbed with fine sandpaper to obtain a clear reading surface.
Four cross-oriented radius paths were marked, according to cardinal point direction, on each of the sanded face of discs sampled at 0 to 1.0 m stump height. The same procedure was used for the discs collected above 1.0 m stump height but with only two opposite radius paths. The year of the last completely formed ring was established from the date of field sampling and the occurrence of latewood. From this informa-tion, the year corresponding to the first ring on each disc was determined, counting down from the last ring using a binocular microscope at a magnification up to 100¥. Ring widths along each radius path were measured using the Win-Dendro™ software (Regent Instruments, Quebec City, Canada) coupled to a high-resolution digital scanner. Tree rings that were difficult to measure were analyzed using a binocular microscope at 100¥ as well as a dendrometric table. Measure-ments between the paths of a disc, discs of a tree, trees of a stand and between stands were cross-dated using Cofecha software (Holmes 1983) to ensure that every tree was aged correctly.
Stem analysis data processing
Height growth was computed from the stem anal-ysis data following Carmean’s method (Dyer and Bailey 1987) allowing extrapolation of cross area and volume between sections and development of increment time-series. Cumulative volumes by age series were compared individually in each block, performing univariate repeated analysis of variance (ANOVAR) to compare growth patterns
between stands (BSFM vs. LW) for each block. Since the sphericity assumption of the variance-covariance matrix is unlikely met, degrees of freedom for the F-test were adjusted based on the Greenhouse-Geisser ε, which is known to make the test much more conservative (Quinn and Keough 2002). Age, site index (height at 50 years) and volume at 50 years were obtained from stem analysis and a global comparison between BSFM and LW was performed with a Wilcoxon non-parametric test, using blocks as observa-tions. All other univariate tests were performed this way. This non-parametric test was preferred although the assumptions for parametric testing were generally fulfilled, because it is likely more robust with a small number of observations (n = 10 per stand type).
As spruce budworm outbreaks are known to affect black spruce in the study area (Hardy
et al. 1986, Tremblay et al. 2011), the effect
of outbreaks on the growth of the harvested dominant trees was quantified. To do so, the
Impact routine from the dendrochronological
program library (http://ltrr.arizona.edu/research/ software) was used. It calculates the percentage of growth reduction by dividing the mean annual volume increment during the event by the mean value during a reference period. For the outbreak growth reduction period, the mean volume incre-ment from 1976 to 1979 (Morin and Laprise 1990) was used whereas the six previous years (1970–1975) served as the reference period. Using these measurements of outbreak impact as response variable, an ANOVA was performed to check for the effect of stand type.
Stand volume calculation
Stem density, DBH and mean basal area were calculated from merchantable tree size (DBH > 9 cm). These data were used for plot-level volume calculation performed with the Arte-mis-2009 simulator (ver. 2.5.1), running on the Capsis 4.2.2 platform (http://capsis.cirad.fr/), which estimates individual tree height, taking into account species and stand-specific char-acteristics such as climate (Fortin et al. 2009, Fortin and Langevin 2012). It computes volume at tree level and integrates at plot level,
account-ing for errors associated with the use of esti-mated height (Fortin et al. 2007).
Carbon stock evaluation
DBH measurements of all woody stems reach-ing 1.3 m high were used for determinreach-ing the carbon stock sequestered in trees. Individual tree biomass was computed using species-specific equations, taken from: (1) Fradette (2013) for black spruce and jack pine total biomass in LW, (2) Tremblay et al. (2006) for above-ground biomass of Sorbus sp. in both stand types, and (3) Lambert et al. (2005) for all other above-ground biomass equations. In the latter cases, root biomass was calculated from above-ground biomass using equations from Li et al. (2003). Carbon stocks for both stand types were cal-culated as half of these total dry mass (IPCC 2003). The same allometric biomass equations were also used for calculating total biomass of the above-mentioned dominant trees sampled for stem analysis. DBH values at 50 years (dry wood DBH) were used to have comparable data of the whole tree growth potential for both stand types.
Carbon stock simulation
In order to compare the carbon stock dynamics from the natural BSFM in this study with that from a LW afforestation simulation, the affores-tation scenario from Gaboury et al. (2009) was repeated, but using the Carbon Budget Model of the Canadian Forest Sector (CBM-CFS3; Kurz et
al. 2009) instead of the CO2FIX carbon model.
First, an initial growth period of a dense natural black spruce stand having a site index of 12 m using natural stand yield tables (MRN 2000) was simulated for 70 years, followed by a fire which shifted the stand to a LW. A natural development of this LW was then simulated for 75 years, using a site index of 9 m at low density leading finally to a clear-cut, leaving debris at stump level (tree-length logging). Scenarios were then specifically simulated from this common starting point.
For the Gaboury et al. (2009) afforestation scenario, a growth and yield table of black spruce plantation having a site index of 6 m (at 25
years) and a density of 2000 stems ha–1 was
used (MRN 2000). For all other simulations, site-specific growth and yield tables were constructed as follows. From the mean cumulative volume of the three dominant trees, a Richards growth func-tion (Richards 1959) was fit to the data due to the occurrence of a break in the last years (up to five) before the mean age, as the mean computation was reduced from three to two samples. These series were transformed into ratios of the volume at the age of the stand at sampling time, i.e. the mean age of the three felled dominant trees. Ratios were multiplied by the stand volume at sampling age calculated by the Artemis model as described above, so that the yield curve matches the merchantable volume measured in the plot.
Results
Stand characteristics
The stand pairs all dominated by black spruce, were very uniform in terms of vegetation com-position, soil characteristics, and age (Table 2). They were all established on glacial deposits, of either till or fluvio-glacial sediments. An appar-ent deposit mismatch can be observed in the N1 stand pair owing to the map codification, but a soil investigation in the field revealed that deposit thickness, as well as soil horizon thick-ness and texture, were comparable. The tree density in the BSFM stands ranged from 1625 to 3375 stems ha–1 with a mean of 2588 ± 456 (SD)
stems ha–1. The LW tree density was much lower,
ranging from 75 to 1125 stems ha–1 and a mean
of 598 ± 298 (SD) stems ha–1. Generally
speak-ing, tree-level productivity indices were lower in open stands, by 2.7 ± 1.2 (SD) m for site index and 0.049 ± 0.049 (SD) m3 ha–1 for dominant
tree volume at 50 years, suggesting a lower site potential in LW.
Growth and yield
The ANOVAR performed block by block on the cumulative volume growth revealed that site potential is not always different between LW and BSFM stands (Table 2). Four blocks (M4,
M6, M7 and M9) showed similar growth of dominant trees in both stands while growth was different among the other blocks. This differ-ence allowed for defining two groups based on the growth tendency between stands of each block. The “diverging” group showed volume growth curves to diverge throughout the
meas-ured period, as annual volume increments from the two stands deviated from one another for almost the first 40 years before reaching a plateau, thereafter keeping a constant differ-ence (Fig. 2a). The second “converging” group showed volume increments to be slightly lower for the LW in the first 30 years before
becom-Fig. 2. Mean growth development by age of dominant black spruce growing in two groups (converging and
ing equal to that for BSFM at about 40 years, making the total volume growth curves parallel (Fig. 2b). Differences among these groups were also apparent in the height growth component; the height increment of the LWs being lower in the diverging group, making cumulative height curves of both stand types deviate in a continual manner (Fig. 2c). For the converging group, height increment was lower for LW at the begin-ning but equal at 25 years, making cumulative height curves parallel (Fig. 2d). However, the difference among groups was striking in terms of basal area. Here again, the stands in the diverging group deviated in a continual manner (Fig. 2e), while in the converging group, basal area annual increment of the LW was lower than for the BSFM in the first 25 years but caught up and exceeded BSFM trees for the last 35 years (Fig. 2f). Cumulative volume development did not differ between the two groups for the BSFMs (ANOVAR inter-subject Group effect F = 0.0015, df = 1, p = 0.9692; intra-subject Age ¥ Group effect F = 0.1006, Greenhouse-Geisser df = 1.0879, p = 0.7747), while there was a significant difference for the LWs (ANOVAR inter-subject Group effect F = 10.8742, df = 1,
p = 0.0027; intra-subject Age ¥ Group effect F
= 14.5974, Greenhouse-Geisser df = 1.1015, p = 0.0005), showing that the converging/diverging group distinction is due to differences in LW site potential alone. The total biomass of dominant trees at 50 years also differed between BSFM and diverging LW (Wilcoxon χ2
1 = 18.6397, p <
0.0001), but not between BSFM and converging LW (Wilcoxon χ2
1 = 0.4987, p = 0.4801).
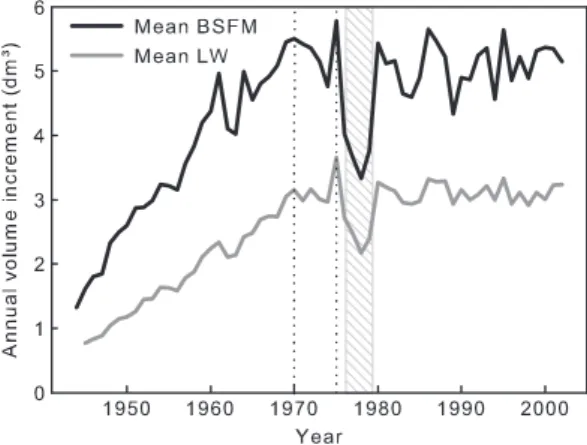
Spruce budworm outbreaks affected black spruce growth in the studied area, with an obvious sign of growth reduction during the last outbreak period in both stand types (Fig. 3). Owing to the grouping of blocks (converging vs. diverging), the statistical analysis of spruce budworm out-break impact was adapted: a split-plot ANOVA was run instead of the originally planned rand-omized complete block ANOVA. Blocks were nested in the group factor and stand type was the factor replicated in each block. The block factor was randomized and interaction between groups and stand types was also tested. The split-plot ANOVA (Table 3) revealed that volume incre-ments during the outbreak were significantly
influenced by stand type but not by the divergence level between BSFM and LW (groups). Mean growth increment for each stand type showed a stronger relative impact of spruce budworm in BSFM (Fig. 3). On average, BSFM annual growth increment during the 4-year budworm reduction period was 70% of the preceding 6-year period, while it was 80% in LW. This percentage was also negatively correlated with tree density in LW (Pearson’s r = –0.744, p = 0.0136) but not in BSFM (Pearson’s r = 0.222, p = 0.5375).
Carbon stocks
On average, BSFM stands stock over four times more carbon in tree biomass than LWs when all species are considered (Table 4). The same ratio applies when accounting for only black spruce, which represents 92% of total biomass carbon
Fig. 3. Mean annual volume increment of dominant
black spruce growing in LW and BSFM. The grey shaded period refers to a growth reduction related to a spruce budworm outbreak, while the period between dotted lines is the reference period used for calculating the impacts from the outbreak.
Table 3. Summary of a split-plot ANOVA showing the
tested fixed effects (REML) on the percentage of volume growth during the spruce budworm impact period.
Source df F-ratio p > F
Group 1 0.1731 0.6883
Stand type 1 6.1732 0.0166
stock in LW and 84% in BSFM. A comparison between the simulated black spruce biomass carbon stock and measurements revealed that CBM-CFS3 overestimated biomass carbon by 7.1% in LW but has an underestimate of 74% for the lowest tree density LW (L2, 75 trees ha–1).
In BSFM, the model underestimated biomass carbon by 14.2%.
The afforestation simulation scenario, using the same assumptions and yield tables as Gaboury et al. (2009), followed a slightly higher carbon stock growth curve than the one using yield tables based on the BSFM carbon stocks measured in the field (Fig. 4). During the first 70 years of development, which is the same period as studied by Gaboury et al. (2009), carbon stock for the afforestation scenario begins and ends within the 95% confidence interval of the BSFM mean, but it is slightly over these limits in the middle portion of the curve.
Discussion
LW growth potential
In this study, growth indicators used to compare site potential of LW and BSFM revealed that LW are generally less productive at the tree level. Due to the similarities between the two adjacent stand types in terms of site characteristics (soil depos-its, drainage, slope, aspect, time elapsed since the last disturbance), the lower site potential in LW than in BSFM is unlikely to be explained by these site characteristics. This study, however, delves deeper into the question of the intrinsic lower productivity of LWs, with new insights
Table 4. Biomass carbon stock measured in the field versus simulated values from CBM-CFS3 scenarios at the
age of sampling (see Table 2). Abbreviations: LW: lichen woodlands; BS: black spruce; BSFM: black spruce–feath-ermoss.
Block LW biomass C stocks (t ha–1) BSFM biomass C stocks (t ha–1)
All BS BS Simulated All BS BS Simulated
species measured simulated – measured species measured simulated – measured
measured BS (%) measured BS (%) L1 28 22 21 –5 116 88 76 –14 L2 19 19 5 –74 101 99 80 –19 M1 25 25 26 4 88 76 55 –28 M2 21 21 25 19 131 83 85 2 M4 14 14 23 64 107 100 87 –13 M5 23 23 23 0 119 112 89 –21 M6 31 21 32 52 124 75 73 –3 M7 31 30 31 3 107 92 77 –16 M9 34 34 37 9 122 122 97 –20 N1 39 36 35 –3 125 114 101 –11 Mean 26.5 24.5 25.8 7.1 114.0 96.1 82.0 –14.2 SD 7.5 6.9 9.1 37.0 13.1 16.2 13.1 8.9
Fig. 4. Total carbon stock of BSFMs in this study
(“site-specific yield tables”) along with the carbon stock of planted LW, as hypothesized in Gaboury et al. (2009, “generic yield tables”) and simulated with CBM-CFS3. Vertical bars are 95% confidence intervals.
revealed by looking at the growth and yield over decades. It shows that LW lags behind BSFM for the first 30 years at all sites, in agreement with studies looking at the short-term establishment phase of regeneration following silvicultural treatments and centered on ericaceous shrubs impacts (Mallik 1993, Thiffault et al. 2004, 2005, Thiffault and Jobidon 2006, Hébert et al. 2010a, 2010b). However, two growth patterns are pos-sible thereafter: either volume increment contin-ues to diverge for another 10 years, when LW tree growth remains approximately half of that found in BSFM, or it starts to converge until the disparity is substantially reduced after another decade, followed by a period of parallel growth. In this latter converging group, the difference in cumulative volume between both stand types is small, the volume of dominant trees in LW being 90% of that for trees in BSFM at 60 years; this difference is expected to decrease thereafter as the absolute difference of 15 dm3 remains
con-stant from year to year. In the diverging group, the volume of dominant trees in LW at 60 years is 47% of that for dominants in BSFM, and the disparity widens continuously. This finding of two subgroups of LWs, based on long-term site potential, suggests that site productivity cannot be assessed based solely on tree density, but also requires long-term growth patterns (Payette 1992, Riverin and Gagnon 1996, Côté et al. 2013).
Detailed growth analysis of stand types from the converging group revealed noticeable mor-phological differences between dominant trees growing in LW and BSFM. In this group, domi-nant trees from both stand types produced a similar stem volume, indicating equivalent site potential. One could argue that BSFM potential was underestimated as a higher tree density and competition may reduce dominant volume growth. However, LW growth potential may also be underestimated, as stem analysis neglects root volume, and there is evidence that black spruce root growth (Vincent et al. 2009) and total volume (Fradette 2013) increase even as tree density decreases. The present study addressed this tradeoff. The dominant tree biomass at 50 years, determined using allometric equations that includes roots, confirms that trees in productive LWs grow as fast as those in BSFMs. Besides, the morphological distribution of converging
BSFMs and LWs stem volume was different; from 50 years onwards, dominant trees in LW were shorter but their basal area was greater. As a result, while 50-year dominant tree volume was equal between stand types, mean measured site index at this age was 11 m in LW but 13 m in BSFM. The site index therefore seems to under-estimate site potential in LW, at least in those stands of the converging group.
In a search for explanations for the differential site potential among LWs, the impact of the last spruce budworm outbreak was investigated. How-ever, there was no significant difference between stand groups (diverging vs. converging) in the magnitude of the growth reduction. As mentioned previously, differences between groups can be observed as early as at 20–30 years, but on aver-age the outbreak occurred at 51 years of stand aver-age. As such, we conclude that the spruce budworm outbreak had no influence on the convergence or divergence patterns between the growth of trees in LW and those in BSFM. However, the split-plot ANOVA revealed that the percentage of growth during the outbreak was affected by the stand type, with the growth reduction being relatively smaller in LW than in BSFM. Density seems to be the driver of this relationship, but in an asymptotic way, since it only had a significant effect on the density range of LWs, and not in that of BSFMs. Although it was not initially an objective of this study, this is probably the first time that an effect of stand tree density on the severity of a spruce budworm outbreak was observed. According to Dymond et al. (2010), future (currently occurring) spruce budworm outbreaks will be an important issue for the carbon dynamics of eastern Canadian forests in the near future. No other causes for this different site potential in LWs could be unraveled in this study, but possible avenues related to vari-able stressful growth conditions of open canopy micro-climates include hydraulic limitations, pho-toinhibition, and frost risks (Bazzaz and Carlson 1982, Grime et al. 1986, Bazzaz and Wayne 1994, Pearcy and Sims 1994, Groot 1999, Osmond et al. 1999, Archibold et al. 2000, Sperry 2000).
Carbon stocks and sequestration rates
in LWs can occasionally be as high as that for plantation-density BSFM stands, i.e. 40% of all LWs in this study. Therefore, the latter may be considered valid surrogates for elevated site potential afforested LWs, meaning that tree den-sity is the main differentiating factor between productive LWs and BSFM stands in terms of C stocking. This is also supported by the fact that natural BSFMs, with a tree density com-parable to that in plantations, do not present an optimized tree distribution (as in plantations) nor do they benefit from the favourable growth conditions associated with scarification during the juvenile growth phase (Hébert et al. 2006). In addition, planted seedlings are produced from seed orchards or seeds harvested from trees spe-cifically selected for their high growth potential. Furthermore, BSFMs in this study had an even-aged structure that therefore excludes the pres-ence of older trees and their associated carbon stock. However, older trees would be present in LW that was not harvested prior to tree plant-ing; this understory planting scenario should be the primary prescribed treatment mode as suggested by Boucher et al. (2012) and (Hébert
et al. 2014). Altogether, these features prevent
possible overestimates when comparing BSFM stand growth with that of afforested LWs having an inherently low site potential and constitutes a conservative comparison with afforested LWs that have a high site potential.
Our results indicate that growth rates used in the simulated sequestration rate for afforested black spruce (this study) as well as in previ-ous simulations by Gaboury et al. (2009) and Boucher et al. (2012) were conservative, as the predicted 195 m3 ha–1 at 80 years (MRN 2000) in
planted LWs with black spruce is clearly lower than the 230 m3 ha–1 measured in this study
with natural BSFM stands of the same age. To our knowledge, it is the first time that measured growth yields of natural BSFM stands provide support to the use of generic growth yield tables for plantations. Growth yield being a strong determinant of C sequestration rate (Gaboury et
al. 2009), these measured tree volumes in natural
BSFM stands further validate the conservative approach used in the simulated C accountings for afforested LWs (Fig. 4, Gaboury et al. 2009, Boucher et al. 2012).
More field validation of the simulations pre-sented in Gaboury et al. (2009) and Boucher et
al. (2012), which also further support the
con-servative approach therein, comes from compari-sons with measured carbon stocks in the bio-mass through use of specific allometric equa-tions (Lambert et al. 2005, Fradette 2013) in the present study (Table 4). The average difference between both scenarios (intact LWs and surro-gates of plantations with BSFM stands) resulted in net carbon stocks (114.0 – 26.5 = 87.5 t C ha–1,
SD = 12.5) somewhat higher than those stemming from the simulations of Gaboury et al. (2009) and Boucher et al. (2012) that produced values at maturity of between 60 and 70 t C ha–1. New
simulations of carbon stocks based on measured tree growth patterns indicate that compared with measured values, the amount of carbon stocked in the biomass of 80 year-old LWs is overestimated by 7% with the CMB-CFS3 simulations, while simulated carbon stocks in BSFMs are underes-timated by 14%. This simulated versus measured biomass carbon stock comparison, altogether with the measured growth yields, also demonstrates the suitability of using CBM-CFS3 along with the generic yield tables for evaluating the net carbon balance of LW afforestation projects.
Implications for high-latitude afforestation
This study is the first to provide a measured estimate of carbon stock in mature black-spruce stands that have a stem density in the same range as that of plantations. It suggests that previous estimates, not using appropriate BSFM surro-gate, may underestimate carbon stocks in affor-ested LWs. For example, the measured carbon of tree biomass was on average 114.0 ± 13.1 (SD) t ha–1 at a mean age of 80 years (density cover
> 80%), while it was 51.2 t ha–1 in Bernier et al.
(2011) (density cover 40%–60%). As our CBM-CFS3 simulations reached 135 years without showing any carbon stock peak, the C stocks measured in this study should still increase for decades as forest ages beyond 80 years.
While the financial cost of an eventual affor-estation program might be an issue (Madec et al. 2012, Tremblay et al. 2013), it would be advised
to account for probable intrinsic site conditions. This study shows that site potential in boreal LWs is variable, with two marked growth rate groups. What makes a LW potentially productive or not is currently unknown, but this study provides clues as to how to identify high potential LWs in order to prioritize them over less productive sites. Site index alone is a less accurate indicator than the dominant tree merchantable volume at 50 years, as the site index underestimates the wood volume growth potential and could lead to mistakenly rejecting a productive LW for afforestation. The differentiation of both productive and unproduc-tive groups is clear, as high potential LW trees had a volume of about 100 dm3 at 50 years, while
low potential trees had a volume of 50 dm3.
Also, there is a tendency for the total basal area to be higher in the converging group (10.5 vs. 7.6 m2 ha–1), suggesting a denser tree cover
(Jen-nings et al. 1999) that may help to mitigate the albedo-related forcing effect, which appears to be stronger when afforestation occurs on the most open LWs (Bernier et al. 2011).
This study supports the use of CBM-CFS3 as an appropriate tool for predicting carbon balance from LW afforestation projects. Although predic-tions were revealed to be more or less accurate in highly productive BSFMs, such as the ones in this study (230 m3 ha–1 at 80 years) as well
as in very low density LWs, the predictions still support conservative management strategies. Given that the quality of growth and yield data is also an issue (Mansuy et al. 2013), this study shows that CBM-CFS3 can be adequately fed by generic yield tables, as the modelled output of predicted carbon stocking for the afforestation scenario fell within the carbon stocking range of a natural BSFM stand.
Conclusions
Site potential of lichen woodlands (LWs) can be either lower or equivalent to that in dense black-spruce–feathermoss stands (BFSMs), thus contradicting the paradigm of systematic lower tree growth in the former. Stem analysis from dominant trees revealed that the annual volume increment in LW was comparable to that in BSFM at some sites, while it was lower
at others. The future development of an effi-cient indicator for site potential, aiming to iden-tify the most productive LWs for afforestation, would help in optimizing carbon drawdown in forest management. This study also validated the use of generic black-spruce yield tables for assumptions related to growth when simulating C dynamics in LW afforestation projects. These simulations seem, in fact, to be rather conserva-tive and, as such, the carbon drawdown from boreal afforestation might be greater than that suggested by the models.
Given the potentially large availability of high-latitude LWs in North America and Russia (Shvidenko et al. 1997, Gaboury et al. 2009, Boucher et al. 2012), these findings can help push the concept of high-latitude afforestation closer to being an environmentally and economi-cally efficient action for C offsetting (Boucher et
al. 2012). However, other uncertainties related
to high-latitude afforestation still needs to be addressed, in particular those associated with albedo change impacts, variations in volatile organic compound production, and the net present value of a given afforestation project (Bernier et al. 2011, Boucher et al. 2012, Ehn et
al. 2014). But one of the most recognized issue,
the reversal risk associated to wildfires, is better depicted in the light of this study. Knowing that low growth rate may worsens the impacts of fire losses (Mansuy et al. 2013), it shows that some of the LWs — for the least those that have a high site potential — should not be more impacted by fire than planted BSFMs, since their growth potentials are similar. This finds even more sup-port in recent work suggesting that the higher density afforested LWs may be less susceptible to fires than open LWs (Cavard et al. 2015).
Acknowledgements
This work was supported by The Fonds québécois de la recherche sur la nature et les technologies (grant to D. Lord), a Collaborative Research and Development Grant to J.-F. Boucher from the Natural Sciences and Engineering Research Council of Canada, and the Carbone Boréal program at UQAC. Authors would like to thank, for their technical help: Isabelle Auger, Sylvain Cayouette, Isabelle Côté, Nathalie Fantin, Simon Gaboury, François Girard, Esteban Gonzalez, Stephen Kull, Guillaume Moreau, Jean-François Simard and Denis Walsh. Thanks also to the Boreal Environment Research
journal editors and three anonymous reviewers for their com-ments which greatly improved the quality of the paper.
References
Amiro B.D., Cantin A., Flannigan M.D. & de Groot W.J. 2009. Future emissions from Canadian boreal forest fires. Canadian Journal of Forest Research 39: 383–395. Amiro B.D., Barr A.G., Barr J.G., Black T.A., Bracho R., Brown M., Chen J., Clark K.L., Davis K.J., Desai A.R., Dore S., Engel V., Fuentes J.D., Goldstein A.H., Goulden M.L., Kolb T.E., Lavigne M.B., Law B.E., Margolis H.A., Martin T., McCaughey J.H., Misson L., Montes-Helu M., Noormets A., Randerson J.T., Starr G. & Xiao J. 2010. Ecosystem carbon dioxide fluxes after disturbance in forests of North America. Journal of Geophysical Research, Biogeosciences 115, G00k02, doi:10.1029/2010jg001390.
Archibold O.W., Acton C. & Ripley E.A. 2000. Effect of site preparation on soil properties and vegetation cover, and the growth and survival of white spruce (Picea glauca) seedlings, in Saskatchewan. Forest Ecology and Man-agement 131: 127–141.
Bazzaz F.A. & Carlson R.W. 1982. Photosynthetic acclima-tion to variability in the light environment of early and late successional plants. Oecologia 54: 313–316. Bazzaz F.A. & Wayne P.M. 1994. Coping with
environ-mental heterogeneity: The physiological ecology of tree seedling regeneration across the gap–understory continuum. In: Caldwell M.M. & Pearcy R.W. (eds.), Exploitation of environmental heterogeneity by plants. Ecophysiological processes above- and belowground, Academic Press Inc., USA, pp. 349–390.
Bernier P.Y., Desjardins R.L., Karimi-Zindashty Y., Worth D., Beaudoin A., Luo Y. & Wang S. 2011. Boreal lichen woodlands: a possible negative feedback to cli-mate change in eastern North America. Agricultural and Forest Meteorology 151: 521–528.
Betts R.A. 2000. Offset of the potential carbon sink from boreal forestation by decreases in surface albedo. Nature 408: 187–190.
Betts R.A., Falloon P.D., Goldewijk K.K. & Ramankutty N. 2007. Biogeophysical effects of land use on climate: model simulations of radiative forcing and large-scale temperature change. Agricultural and Forest Meteorol-ogy 142: 216–233.
Bony S., Colman R., Kattsov V.M., Allan R.P., Bretherton C.S., Dufresne J.-L., Hall A., Hallegatte S., Holland M.M., Ingram W., Randall D.A., Soden B.J., Tselioudis G. & Webb M.J. 2006. How well do we understand and evaluate climate change feedback processes? Journal of Climate 19: 3445–3482.
Boucher J.-F., Tremblay P., Gaboury S. & Villeneuve C. 2012. Can boreal afforestation help offset incompress-ible GHG emissions from Canadian industries? Process Safety and Environmental Protection 90: 459–466. Brown C.D. & Johnstone J.F. 2012. Once burned, twice shy:
repeat fires reduce seed availability and alter substrate
constraints on Picea mariana regeneration. Forest Ecol-ogy and Management 266: 34–41.
Cavard X., Boucher J.F. & Bergeron Y. 2015. Vegetation and topography interact with weather to drive the spa-tial distribution of wildfires in the eastern boreal forest of Canada. International Journal of Wildland Fire 24: 391–406.
Claussen M., Brovkin V. & Ganopolski A. 2001. Biogeo-physical versus biogeochemical feedbacks of large-scale land cover change. Geophysical Research Letters 28: 1011–1014.
Côté D., Girard F., Hebert F., Bouchard S., Gagnon R. & Lord D. 2013. Is the closed-crown boreal forest resil-ient after successive stand disturbances? A quantitative demonstration from a case study. Journal of Vegetation Science 24: 664–674.
Dyer M.E. & Bailey R.L. 1987. A test of six methods for estimating true heights from stem analysis data. Forest Science 33: 3–13.
Dymond C.C., Neilson E.T., Stinson G., Porter K., MacLean D.A., Gray D.R., Campagna M. & Kurz W.A. 2010. Future spruce budworm outbreak may create a carbon source in eastern Canadian forests. Ecosystems 13: 917– 931.
Ehn M., Thornton J.A., Kleist E., Sipila M., Junninen H., Pullinen I., Springer M., Rubach F., Tillmann R., Lee B., Lopez-Hilfiker F., Andres S., Acir I.-H., Rissanen M., Jokinen T., Schobesberger S., Kangasluoma J., Kont-kanen J., Nieminen T., Kurten T., Nielsen L.B., Jor-gensen S., Kjaergaard H.G., Canagaratna M., Maso M.D., Berndt T., Petaja T., Wahner A., Kerminen V.-M., Kulmala M., Worsnop D.R., Wildt J. & Mentel T.F. 2014. A large source of low-volatility secondary organic aerosol. Nature 506: 476–479.
Flannigan M.D., Logan K.A., Amiro B.D., Skinner W.R. & Stocks B.J. 2005. Future area burned in Canada. Cli-matic Change 72: 1–16.
Fortin M. & Langevin L. 2012. Stochastic or deterministic single-tree models: is there any difference in growth pre-dictions? Annals of Forest Science 69: 271–282. Fortin M., DeBlois J., Bernier S. & Blais G. 2007. Mise au
point d’un tarif de cubage général pour les forêts québé-coises : une approche pour mieux évaluer l’incertitude associée aux previsions. The Forestry Chronicle 83: 754–765.
Fortin M., Bernier S., Saucier J.-P. & Labbé F. 2009. Une relation hauteur-diamètre tenant compte de l’influence de la station et du climat pour 20 espèces commerciales du Québec. Ministère des Ressources naturelles, Gou-vernement du Québec, Québec.
Fradette O. 2013. Croissance des stocks de carbone dix ans après boisement de terrains dénudés boréaux. M.Sc. thesis, Département des sciences fondamentales, Univer-sité du Québec à Chicoutimi (UQAC).
Frank D.C., Esper J., Raible C.C., Buentgen U., Trouet V., Stocker B. & Joos F. 2010. Ensemble reconstruction constraints on the global carbon cycle sensitivity to cli-mate. Nature 463: 527–530.
Gaboury S., Boucher J.-F., Villeneuve C., Lord D. & Gagnon R. 2009. Estimating the net carbon balance of boreal
open woodland afforestation: a case-study in Quebec’s closed-crown boreal forest. Forest Ecology and Man-agement 257: 483–494.
Gagnon R. & Morin H. 2001. Les forêts d’épinette noire du Québec: dynamique, perturbations et biodiversité. Le Naturaliste Canadien 125: 26–35.
Gibbard S., Caldeira K., Bala G., Phillips T.J. & Wick-ett M. 2005. Climate effects of global land cover change. Geophysical Research Letters 32, L23705, doi: 10.1029/2005gl024550.
Girard F., Payette S. & Gagnon R. 2008. Rapid expansion of lichen woodlands within the closed-crown boreal forest zone over the last 50 years caused by stand dis-turbances in eastern Canada. Journal of Biogeography 35: 529–537.
Girard F., Payette S. & Gagnon R. 2009. Origin of the lichen-spruce woodland in the closed-crown forest zone of eastern Canada. Global Ecology and Biogeography 18: 291–303.
Grime J.P., Crick J.C. & Rincon J.E. 1986. The ecological significance of plasticity. Symposia of the Society for Experimental Biology 40: 5–29.
Groot A. 1999. Effects of shelter and competition on the early growth of planted white spruce (Picea glauca). Canadian Journal of Forest Research 29: 1002–1014. Hardy Y., Mainville M. & Schmitt D.M. 1986. An atlas of
spruce budworm defoliation in eastern North America 1938–1980. United States Department of Agriculture, Forest Service.
Hébert F., Boucher J.-F., Bernier P.Y. & Lord D. 2006. Growth response and water relations of 3-year-old planted black spruce and jack pine seedlings in site pre-pared lichen woodlands. Forest Ecology and Manage-ment 223: 226–236.
Hébert F., Thiffault N., Ruel J.-C. & Munson A.D. 2010a. Comparative physiological responses of Rhododendron groenlandicum and regenerating Picea mariana fol-lowing partial canopy removal in northeastern Quebec, Canada. Canadian Journal of Forest Research 40: 1791–1802.
Hébert F., Thiffault N., Ruel J.-C. & Munson A.D. 2010b. Ericaceous shrubs affect black spruce physiology inde-pendently from inherent site fertility. Forest Ecology and Management 260: 219–228.
Hébert F., Boucher J.F., Walsh D., Tremblay P., Côté D. & Lord D. 2014. Black spruce growth and survival in boreal open woodlands 10 years following mechanical site preparation and planting. Forestry 87: 277–286. Heimann M. & Reichstein M. 2008. Terrestrial ecosystem
carbon dynamics and climate feedbacks. Nature 451: 289–292.
Hennigar C.R., MacLean D.A., Quiring D.T. & Kershaw J.A.Jr. 2008. Dffferences in spruce budworm defolia-tion among balsam fir and white, red, and black spruce. Forest Science 54: 158–166.
Holmes R.L. 1983. Computer-assisted quality control in tree-ring dating and measurement. Tree-ring Bulletin 43: 69–78.
Hustich I. 1966. On the forest-tundra and the northern tree-lines. Annales Universitatis Turkuensis Series A2 36:
7–47.
IPCC 2003. Good practice guidance for land use, land-use change and forestry. IPCC National Greenhouse Gas Inventories Programme, Hayama, Japan.
Jasinski J.P.P. & Payette S. 2005. The creation of alterna-tive stable states in the southern boreal forest, Quebec, Canada. Ecological Monographs 75: 561–583.
Jennings S.B., Brown N.D. & Sheil D. 1999. Assessing forest canopies and understorey illumination: canopy closure, canopy cover and other measures. Forestry 72: 59–73. Krause C., Luszczynski B., Morin H., Rossi S. & Plourde
P.Y. 2012. Timing of growth reductions in black spruce stem and branches during the 1970s spruce budworm outbreak. Canadian Journal of Forest Research 42: 1220–1227.
Kurz W.A., Stinson G., Rampley G.J., Dymond C.C. & Neil-son E.T. 2008. Risk of natural disturbances makes future contribution of Canada’s forests to the global carbon cycle highly uncertain. Proceedings of the National Academy of Sciences of the United States of America 105: 1551–1555.
Kurz W.A., Dymond C.C., White T.M., Stinson G., Shaw C.H., Rampley G.J., Smyth C., Simpson B.N., Neilson E.T., Tyofymow J.A., Metsaranta J. & Apps M.J. 2009. CBM-CFS3: a model of carbon-dynamics in forestry and land-use change implementing IPCC standards. Ecological Modelling 220: 480–504.
Lambert M.C., Ung C.H. & Raulier F. 2005. Canadian national tree aboveground biomass equations. Canadian Journal of Forest Research 35: 1996–2018.
Li Z., Kurz W.A., Apps M.J. & Beukema S.J. 2003. Below-ground biomass dynamics in the Carbon Budget Model of the Canadian Forest Sector: recent improvements and implications for the estimation of NPP and NEP. Cana-dian Journal of Forest Research 33: 126–136.
Madec C., Walsh D., Lord D., Tremblay P., Boucher J.-F. & Bouchard S. 2012. Afforestation of black spruce lichen woodlands by natural seeding. Northern Journal of Applied Forestry 29: 191–196.
Mailly D. & Gaudreault M. 2005. Growth intercept models for black spruce, jack pine and balsam fir in Quebec. The Forestry Chronicle 81: 104–113.
Mallik A.U. 1993. Ecology of a forest weed of Newfound-land — vegetative regeneration strategy of Kalmia-angustifolia. Canadian Journal of Botany 71: 161–166. Mansuy N., Gauthier S. & Bergeron Y. 2013. Afforestation
opportunities when stand productivity is driven by a high risk of natural disturbance: a review of the open lichen woodland in the eastern boreal forest of Canada. Mitigation and Adaptation Strategies for Global Change 18: 245–264.
Matthews H.D., Gillett N.P., Stott P.A. & Zickfeld K. 2009. The proportionality of global warming to cumulative carbon emissions. Nature 459: 829–832.
Montenegro A., Eby M., Mu Q., Mulligan M., Weaver A.J., Wiebe E.C. & Zhao M. 2009. The net carbon drawdown of small scale afforestation from satellite observations. Global and Planetary Change 69: 195–204.
Morin H. & Laprise D. 1990. Histoire récente des épidémies de la Tordeuse des bourgeons de l’épinette au nord du
lac Saint-Jean (Québec): une analyse dendrochronolo-gique. Canadian Journal of Forest Research 20: 1–8. Morneau C. & Payette S. 1989. Postfire lichen spruce
wood-land recovery at the limit of the boreal forest in northern Quebec. Canadian Journal of Botany 67: 2770–2782. MRN 2000. Mise à jour — Manuel d’aménagement forestier
— Annexe 1. Ministère des Ressources naturelles, Gou-vernement du Québec, Québec.
MRN 2003. Vegetation zones and bioclimatic domains in Québec. Ministère des Ressources naturelles, Gouverne-ment du Québec, Québec.
Nabuurs G.J., Masera O., Andrasko K., Benitez-Ponce P., Boer R., Dutschke M., Elsiddig E., Ford-Robertson J., Frumhoff P., Karjalainen T., Krankina O., Kurz W.A., Matsumoto M., Oyhantcabal W., Ravindranath N.H., Sanz Sanchez M.J. & Zhang X. 2007. Forestry. In: Metz B., Davidson O.R., Bosch P.R., Dave R. & Meyer L.A. (eds.), Climate change 2007: mitigation, Contribution of Working Group III to the Fourth Assessment Report of the Intergovernmental Panel on Climate Change, Cam-bridge University Press, CamCam-bridge, UK, pp. 541–584. Nealis V.G. & Regniere J. 2004. Insect–host relationships
influencing disturbance by the spruce budworm in a boreal mixedwood forest. Canadian Journal of Forest Research 34: 1870–1882.
Osmond C.B., Anderson J.M., Ball M.C. & Egerton J.J.G. 1999. Compromising efficiency: the molecular ecology of light-resource utilization in plants. In: Press M.C., Scholes J.D. & Barker M.G. (eds.), 39th Symposium of the British Ecological Society, Blackwell Science, York University, York, England, pp. 1–24.
Pardé J. & Bouchon J. 1988. Dendrométrie, 2e édition. ENGREF, Nancy, France.
Payette S. 1992. Fire as a controlling process in the North American boreal forest. In: Shugart H.H., Leemans R. & Bonan G.B. (eds.), A systems analysis of the global boreal forest, Cambridge University Press, Cambridge, UK, pp. 144–169.
Payette S., Bhiry N., Delwaide A. & Simard M. 2000. Origin of the lichen woodland at its southern range limit in east-ern Canada: the catastrophic impact of insect defoliators and fire on the spruce-moss forest. Canadian Journal of Forest Research 30: 288–305.
Pearcy R.W. & Sims D.A. 1994. Photosynthetic acclimation to changing light environments: Scaling from the leaf to the whole plant. In: Caldwell M.M. & Pearcy R.W. (eds.), Exploitation of environmental heterogeneity by plants. Ecophysiological processes above- and below-ground, Academic Press Inc., USA, pp. 145–174. Pothier D., Elie J.G., Auger I., Mailly D. & Gaudreault M.
2012. Spruce budworm-caused mortality to balsam fir and black spruce in pure and mixed conifer stands. Forest Science 58: 24–33.
Quinn G.P. & Keough M.J. 2002. Experimental design and data analysis for biologists. Cambridge University Press, Cambridge, UK.
Richards F.J. 1959. A flexible growth function for empirical use. Journal of Experimental Botany 10: 290–300.
Riverin S. & Gagnon R. 1996. Dynamics of the regeneration of a lichen-spruce woodland in a black spruce feather-moss forest of the northern section of Saguenay-Lac-Saint-Jean. Canadian Journal of Forest Research 26: 1504–1509.
Sedia E.G. & Ehrenfeld J.G. 2003. Lichens and mosses promote alternate stable plant communities in the New Jersey Pinelands. Oikos 100: 447–458.
Shvidenko A., Nilsson S. & Roshkov V. 1997. Possibilities for increased carbon sequestration through the imple-mentation of rational forest management in Russia. Water Air and Soil Pollution 94: 137–162.
Simard M. & Payette S. 2005. Reduction of black spruce seed bank by spruce budworm infestation compromises postfire stand regeneration. Canadian Journal of Forest Research 35: 1686–1696.
Skovsgaard J.P. & Vanclay J.K. 2008. Forest site productiv-ity: a review of the evolution of dendrometric concepts for even-aged stands. Forestry 81: 13–31.
Sperry J.S. 2000. Hydraulic constraints on plant gas exchange. Agricultural and Forest Meteorology 104: 13–23.
Thiffault N. & Jobidon R. 2006. How to shift unproduc-tive Kalmia angustifolia–Rhododendron groenlandicum heath to productive conifer plantation. Canadian Jour-nal of Forest Research 36: 2364–2376.
Thiffault N., Titus B.D. & Munson A.D. 2004. Black spruce seedlings in a Kalmia–Vaccinium association: microsite manipulation to explore interactions in the field. Cana-dian Journal of Forest Research 34: 1657–1668. Thiffault N., Titus B.D. & Munson A.D. 2005. Silvicultural
options to promote seedling establishment on Kalmia– Vaccinium-dominated sites. Scandinavian Journal of Forest Research 20: 110–121.
Tremblay M.J., Rossi S. & Morin H. 2011. Growth dynamics of black spruce in stands located between the 51st and 52nd parallels in the boreal forest of Quebec, Canada. Canadian Journal of Forest Research 41: 1769–1778. Tremblay P., Boucher J.F., Tremblay M. & Lord D. 2013.
Afforestation of boreal open woodlands: early perfor-mance and ecophysiology of planted black spruce seed-lings. Forests 4: 433–454.
Tremblay S., Périé C. & Ouimet R. 2006. Changes in organic carbon storage in a 50 year white spruce plantation chronosequence established on fallow land in Quebec. Canadian Journal of Forest Research 36: 2713–2723. Viereck L.A. & Johnston W.F. 1990. Picea mariana (Mill.)
B.S.P. In: Burns R.M. & Honkala B.H. (eds.), Silvics of North America. Volume 1. Conifers, United States Department of Agriculture, Washington DC, pp. 227– 237.
Vincent M., Krause C. & Zhang S.Y. 2009. Radial growth response of black spruce roots and stems to commercial thinning in the boreal forest. Forestry 82: 557–571. Weaver A.J., Zickfeld K., Montenegro A. & Eby M. 2007.
Long term climate implications of 2050 emission reduc-tion targets. Geophysical Research Letters 34, L19703, doi: 10.1029/2007gl031018.