1
Self-assembly by multi-drop evaporation of carbon-nanotube droplets on a polycarbonate substrate
H. Machrafi1,2,*, C. Minetti1, P.C. Dauby2, C.S. Iorio1
1Service Chimie-Physique, Université libre de Bruxelles, Brussels, Belgium 2Thermodynamics of Irreversible Phenomena, Université de Liège, Liège, Belgium
*Corresponding author, e-mail: H.Machrafi@ulg.ac.be & Hatim.Machrafi@ulb.ac.be
Abstract
Carbon nanotubes are allowed to self-assemble by depositing a droplet of a water dispersion thereof and letting it evaporate on a polycarbonate substrate. The effect of the number of droplets, evaporated on the same deposition spot, on the self-assembly density is assessed to be more than proportional for the first five depositions. The obtained nanoporous nanostructures are further tested for their electrical resistance and wettability. Two concentrations are used. It is found that a higher concentration and more importantly a higher number of droplet depositions causes the electrical resistance to decrease up to four orders of magnitude and the static contact angle to decrease more than three times. The contact angle hysteresis also increases due to an increasing advancing contact angle and a decreasing receding one. This is explained by the degree of coverage of the substrate by the carbon nanotubes as is also shown by scanning electron microscope images. A better coverage is suggested to cause more pinning for an advancing droplet and a higher capillary force for a receding droplet.
Keywords: Multi-drop evaporation, Carbon nanotube droplets, Self-assembled nanostructure, Electrical resistance, Contact angle, Wettability, Contact angle hysteresis
Introduction
Self-assembly has many applications. It is applied in the medical sector [1]. It can also be used for energy storage [2] or in membrane technology [3]. As a principle, the deposition of micro- and nanoparticles on a substrate is relevant for manufacturing different kinds of coatings [4], but also to prepare micro-and nanowires [5] and to deposit complicated organized biological structures, such as DNA [6,7]. There are several ways to achieve particle deposition, such as dip coating, sedimentation and electrostatic assembly. Convective deposition and more particularly drop evaporation are convenient ways to deposit micro- and nanoparticles [8]. The amount of fluid used is minimized, possibly inducing economic advantages, and the outcome can easily be controlled, by choosing initial parameters [9].
The interest lies in creating patterned structures out of evaporating drops, which can be of use for energetic and medical applications. The deposited patterns that are left by the evaporated colloidal drops can present a multiplicity of structures, such as the ring structure [10], a central bump [11], a uniform deposit [12], or more complex structures such as multiple rings [13] and hexagonal arrays [5]. This variety of patterns reflects the multiscale attractive forces and transport phenomena taking place during the droplet evaporation. As for the fluid dynamics, several mechanisms play an important role, depending on whether a droplet is deposited directly on the substrate or dropped from a certain height. If droplet impact is associated, the fluid dynamics are determined by the Reynolds and Weber number of the droplet impact [9], as well as the impact angle, interfacial deformation or break-up. Marangoni forces, wetting characteristics and evaporation at the free surface are other types of mechanisms that influence the fluid dynamics. The heat transfer, not only associated with the evaporation (cooling) but also with conduction from the substrate, is coupled to the fluid dynamics and the two influence each other in a complex manner. Mass transfer also occurs, either by diffusion of the vapor of the liquid around the drop, by convection-diffusion of particles in the drop or by particles interactions with the substrate surface. If the radial flow is strong, it will carry particles
2
towards the pinned wetting line, where evaporation is the highest, forming the so-called coffee-ring [10,14]. If thermal Marangoni forces are more important, a particle accumulation can take place around the center of the evaporated drop [15]. Uniform depositing can also occur by self-assembly [12,16]. It is worthy to note that the interaction between the particles and the substrate can play an important role in the final shape of the patterns [16].
Self-assembly in evaporating nanofluid droplets has already been investigated and has been reasonably well investigated [17-21]. However, the methods used in these studies can demand for a high concentration of nanoparticles in the deposited droplets. Although a certain tendency to agglomerate is beneficial to the self-assembly process, this can lead to too much aggregation of the particles even before they adhere to the substrate. A great part of the self-assembly can thus take place in the liquid leading to agglomerates of different uncontrollable sizes, which causes uneven layers of particles on the substrate. In order to avoid this, the concentration should be low. However, this would lead to insufficient coverage of the substrate. A solution to this problem is self-assembly by evaporating multiple nanofluid droplets at the same place, one after the other. Although, this is a promising solution, it is still an open field, and the subject of this paper. Before any theoretical or parametrical work can be performed, we need first to have an idea of how the particle self-assembly affects some material properties that are of large interest: we choose to measure experimentally the electrical resistance and the wetting behavior through the static contact angle as well as the advancing and receding contact angles (contact angle hysteresis). The nanofluid in this paper is a dispersion of carbon nanotubes in water with two different concentrations, and the droplets are deposited on a polycarbonate substrate. In order to understand better the observed behaviours, the nanofluid and deposited nanotubes are respectively characterized by particle size distribution and scanning electron microscopy. This work should also give some insight on whether a certain wetting behavior or electric conduction can be attained by either changing the nanofluid concentration or rather by changing the number of evaporated droplets containing that same nanofluid.
Experimental
Multi-drop setup and self-assembly process
We propose to perform our multi-drop experiment by depositing droplets that contain nanotubes and let them evaporate at room temperature. The Marangoni instability in the droplet is rather strong for the dimensions used in this work (25 µl) [22] and we can expect that at these dimensions the motion in the droplet will be triggered as soon as the droplet is deposited. This implies that the timescale of droplet spreading, , (we have deposited the droplet in such a way as to avoid splashing, so that only the spreading phenomenon is of importance here) should be in the same order of magnitude as or smaller than that of thermocapillarity, (Marangoni effect). The thermocapillary (Marangoni) timescale can be obtained from the definition of the Marangoni number ≡ ∆ ≡ . Here, is the temperature-induced surface tension gradient (typically, but not always, a negative number, but we will take the absolute number here for the purposes of this work) along the droplet’s surface. Furthermore, is the droplet radius, ∆ is the global temperature difference along the droplet’s surface (perpendicular to the evaporation direction), is the dynamic viscosity ( = , with the kinematic viscosity and the density) and is the thermal diffusivity. Using the usual thermal and viscous timescales, the thermocapillary timescale can be easily found to be
=
| |∆ . (1)
The timescale of droplet spreading is taken from [23]:
3 We can extract from this the ratio =
| |∆ . Using material properties for water ( = 7.28 ∗
10 N/m [9] at ambient temperature and = −1.54 ∗ 10 N/mK [24]) give the value ≈
∆ . Typically, for evaporating water droplets, ∆ = (1) − (10) K [25], so that typically =
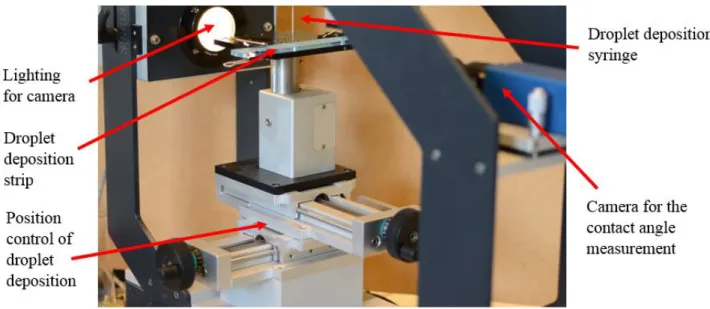
(1) − (10). This means that the Marangoni timescale is estimated to be of the order of magnitude of that of the droplet spreading or one order larger. Therefore, we can state safely that Marangoni instability will be triggered as soon as (just for information, Eq. (1) gives us an estimation of the Marangoni timescale for a 25µl droplet: ≈ (10 ) ms) or shortly after the deposition of the droplet ( ≈ 13 ms). Pattern formation induced by the Marangoni mechanism will therefore not be so much influenced by droplet spreading. After deposition, the nanotubes will then move along and create a certain pattern on the substrate after the evaporation process. Single drop evaporation has been studied previously [9]. In this work, we continue to deposit another droplet on the same spot, which evaporates again. This is repeated several times. In this way a certain self-assembled structure is obtained. We use two concentrations for our nanofluid: 1 and 2 g/l. Fig. 1 shows a picture of the multi-drop experiment, where 17 spots for droplet deposition are available one next to another. So, we will have nanotube depositions by evaporating one nanotube-containing droplet on the first spot, two on the second spot, three on the third one, …, up to seventeen on the seventeenth spot.
Figure 1: Picture of the multi-drop experimental setup with seventeen droplet deposition spots on a deposition strip (see Fig. 5)
The position of the droplet is controlled by a motor with a precision of 0,01 mm. The droplets are deposited by a syringe with a size such that it creates droplets with a volume of 25 µl on “elevated spots” on the polycarbonate substrate with a diameter of 6 mm. The droplets are deposited on these elevated spots to create a pinning behavior, which allows avoiding uncontrolled spreading of the nanofluid droplets, guaranteeing approximately the same spherical form (so that we can be sure that the obtained results are caused by the difference in concentration and amount of deposited drops) and assuring the ability to concentrate the nanotubes on a small controlled surface to facilitate self-assembly. The droplets are illuminated by a light source so that a camera from the other side (by means of a detecting software) can measure the contact angle. The principle of the droplet deposition is shown in Fig. 2, where only three droplet deposition spots are shown, for convenience.
4
Figure 2: Schematic representation of the self-assembly process.
Schematically, the procedure is as follows: (a) we deposit a certain number of droplets next to each other; (b) after evaporation, the nanotubes stick to the polycarbonate substrate; we add another droplet, except for the left spot; (c) after evaporation, a thicker deposition is obtained on the second and third spot from the left; we add again another droplet, except for the first two spots; (d) after evaporation, the third spot from the left shows an even thicker deposition. This can then be repeated as much as wanted. In this work, we repeat the procedure to a maximum of seventeen times. Note that each consequent droplet does not necessarily deposit the nanotubes on previously deposited nanotubes, but can fill empty spots (where the substrate is still open to the air) from previous depositions.
Measurements
Characterization of particle and self-assembly morphology
We characterize the morphology of the carbon nanotubes by means of two methods: particle size analysis and Scanning Electron Microscopy (SEM).
The particle size distribution is measured by using a Shimadzu (SALD 7500) nano particle size analyser. This measurement is based on laser diffraction spectroscopy. The nanotubes are dispersed in water with a certain concentration without any dispersion agent, allowing therefore the formation of colloids (for the self-assembly) during the multi-drop experiments.
The Scanning Electron Microscope is used to visualize at different zooms the structuration of the deposited carbon nanotubes in order to assess the created densities. The deposited nanotubes are first sputter-coated in gold and then placed on a graphite support into a specimen chamber before reproducing the images.
Electrical resistance
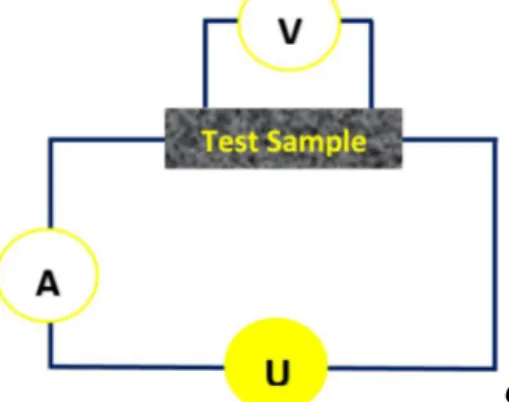
Fig. 3 illustrates the principal coupling scheme for the four-point resistance-measuring method.
Figure 3: Principle coupling scheme for four-point resistance measurement setup. The four-point probe consists of a current source, , with current, , measured by an ampèremeter,
. The four-point method is more reliable than the two-point method (where the voltage is measured directly over the measuring probes) for measurements on surfaces. By passing a current through the two outer probes, the voltage, , is measured through the inner probes, where all the probes touch the sample to be tested. The electrical resistance that is measured is called the sheet resistance, , and is given by [26]:
5
Wettability
After having deposited the carbon nanotubes by droplet evaporation, it is the purpose to measure the extent to which this deposition influences the wettability of the substrate. To this end, we place droplets of testing fluids on the deposition spots that are already previously covered (except, of course, the untreated substrate) by a certain amount of carbon nanotubes (depending on the number of depositions). The static contact angle will be measured by the static sessile drop method and the advancing and receding contact angles by the dynamic sessile drop method. The contact angles are determined using a goniometer (Drop Shape Analysis System, DSA100, Krüss GmbH), equipped with a micro-syringe steel needle of 0.5-mm diameter. For static contact angle measurements, the syringe needle was positioned 0.2 mm from the surface of the colloidal film, and a droplet of 1 µl of the testing liquid was deposited at the center of the carbon-nanotube-covered elevated spots, far from the border. This, in order to avoid pinning behavior and allow the static contact angle to be solely dependent on the testing liquid and the covered substrate. For the receding and advancing contact angles the same experimental setup is used, applying positive and negative pressures on the drop by the syringe, whilst it is deposited on the substrate. We use as testing liquid water and ethylene glycol. After deposition, the drop shape was monitored with a digital camera, and the contact angle was determined. To determine the contact angle, the drop contour was mathematically described by the Young–Laplace equation using DSA100, and the contact angle was determined as the slope of the contour line at the three-phase contact point.
Results and discussion
Morphology and characterization
The 1 g/l carbon nanotubes dispersion is put through a Shimadzu (SALD 7500) nano particle size analyser. Fig. 4 shows the particle size distribution.
Figure 4: Particle size distribution of carbon nanotubes.
We can see from Fig. 4 that the size distribution is rather narrow, with an average particle size of 27 nm with a deviation of +/- 6 nm. Another peak arose around 1 µm (not shown here), which corresponds to the length of the nanotubes. We are, however, rather interested in the diameter of the agglomerated nanotubes. The nanotubes before dispersion have a diameter of 2 to 5 nm. So the result from Fig. 4 shows that agglomeration takes place, which is favorable to the self-assembly process. Fig. 5 shows a top-view image of the seventeen evaporated droplets, where it can be nicely seen how
0 5 10 15 20 25 0 10 20 30 40 50 60 N u m b er o f p ar ti cl es [ % ] Particle size [nm]
6
the spots get darker and darker from left to right. This corresponds by a better surface coverage of the substrate by the carbon nanotubes. In order to know whether the coverage of the deposition is regular, Scanning Electron Microscope (SEM) images are taken for the first five droplet deposition.
Figure 5: Top-view image showing the remnants of an incremental amount of deposited carbon nanotube droplets from left to right.
Figs. 6 to 8 show the SEM results of the self-assembled structures of the deposited carbon nanotubes with magnifications of, respectively, 800 x, 50.000 x and 250.000 x. Each figure presents images after one, two, three and five evaporated drops, respectively.
Figure 6: SEM images (800 x) of the self-assembly of carbon nanotubes after evaporation of one, two, three and five drops.
Figure 7: SEM images (50.000 x) of the self-assembly of carbon nanotubes after evaporation of one, two, three and five drops.
7
Figure 8: SEM images (250.000 x) of the self-assembly of carbon nanotubes after evaporation of one, two, three and five drops.
Figs. 6 to 8 show that after evaporation of one droplet, a certain pattern of deposited nanotubes (shown in lighter contrast) is identifiable, although a great part of the substrate (shown in darker contrast) is still uncovered. After two evaporated droplets, the difference is noticeable. After three evaporated droplets, the results show a clear difference, presenting a nanoporous structure. Fig. 6 shows that not only the substrate is more covered, but also a higher density of nanotubes is obtained. After five drops, it can be seen that the drop already causes a self-assembled dense structure, which is even denser after five evaporated drops. Fig. 7 shows, furthermore, that more and more nanotubes (white spots) form small colloids, which indicates that colloidal forces become more important after more droplets are evaporated. Fig. 8 shows clearly the denser structure approaching a sort of nanoporous structure. Altogether, Figs. 6-8 show that, despite the dense structure, some spots of the substrate are still not fully covered. It is interesting to investigate what influence this coverage can have on the electric resistance and wettability.
Electrical resistance
The probe is placed on three different spots and the measurements are repeated twice. An average value is calculated with an error ranging from 50% to 10% for an amount of deposited droplets ranging from 1 to 17. The large error at a low amount of deposited droplets is probably due to the unequal depositing of the carbon nanotubes on the substrate. Therefore, depending on where the measurement is taken, different electric resistance values can be found. The sheet resistance as a function of the amount of deposited droplets is presented in Fig. 9.
8
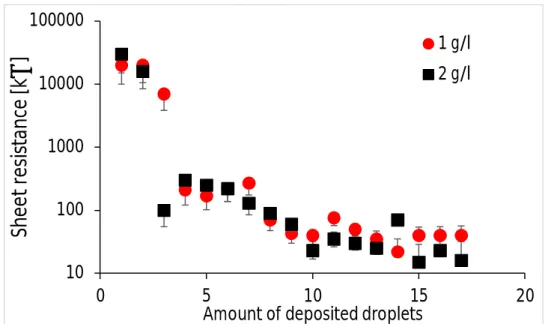
Figure 9: Sheet resistance as a function of the amount of deposited droplets for two concentrations of carbon nanotubes dispersions.
We can cee that in general the electrical resistance decreases when the number of deposited droplets increases. This is quite understandable, since for few deposited droplets the surface is not fully covered by the carbon nanotubes. This can also be seen in Figs. 6-8, where even at five droplets a bit of the substrate is still visible. Most of the electric resistance decrease occurs during the deposition of the first five droplets, which corresponds to the large change in self-assembly density observed in Figs. 6-8. Nonetheless, the substrate coverage is not optimal and more droplet depositing is needed. As the number of deposited droplets increases, the coverage of the substrate becomes better and better and a better electrical conductivity is obtained, which is observed here as a decreasing sheet resistance. From Fig. 9, it appears also that after 13 deposited droplets the sheet resistance hardly decreases, but seems to attain some kind of plateau. Fig. 9 also shows that a higher concentration gives generally rise to a lower sheet resistance. This is obviously also due to a better coverage of the substrate.
Wettability
When “deposited droplet” is mentioned, this refers to the self-assembled carbon nanotubes left behind by the evaporated droplets as shown as example in Fig. 5. In order to measure the influence of the amount of deposited droplets on the wettability of the substrate, we inject a droplet of 1 µl of the so-called “testing liquid” on the self-assembled structures. The measurements are made using water on the substrate and repeated by using ethylene glycol on the substrate. Two readings were taken at different places of the sample surface and the measurements are repeated twice. An average was determined and the error in the measurement of the contact angle was found to be ± 5° for water as the testing fluid and ± 2° for ethylene glycol as the testing fluid. Figs. 10 and 11 show the measured static contact angle for the testing liquids water and ethylene glycol, respectively, as a function of the amount of deposited droplets.
10 100 1000 10000 100000 0 5 10 15 20
Sh
eet
r
es
is
ta
n
ce
[k
Ω
]
Amount of deposited droplets 1 g/l 2 g/l
9
Figure 10: Contact angle of water on the substrate as a function of the amount of deposited droplets for two concentrations of carbon nanotubes dispersions.
Figure 11: Contact angle of ethylene glycol on the substrate as a function of the amount of deposited droplets for two concentrations of carbon nanotubes dispersions.
In Fig. 10, the “0” on the x-axis stands for a pure polycarbonate surface. It shows a contact angle around 78°, which corresponds nicely to the value reported in the literature, i.e. 81° [27]. The static contact angle for ethylene glycol on polycarbonate of 53° also corresponds well with an averaged contact angle of 56°, found by [28] using dynamic contact angle measurements. Figs. 10 and 11 show that an increasing amount of deposited droplets, i.e. a higher/better coverage of the substrate by the carbon nanotubes, leads to a considerable decrease of the static contact angle of the testing fluids (albeit water or ethylene glycol). For the same reasons as mentioned for the electrical resistance, a higher concentration leads to lower static contact angles, although the difference is rather small for water as the testing liquid. Furthermore, the largest contact angle decrease for water as the testing fluid is observed for the first five droplets, going as low as around 35-40°. We can get a further decrease of the contact angle down to less than 25° by increasing the amount of deposited droplets. This seems to be approximately the same for both concentrations of the deposited droplets. As for
10 20 30 40 50 60 70 80 0 5 10 15 20
C
o
n
tac
t
an
gl
e
[°
]
Amount of deposited droplets
1 g/l 2 g/l Substrate 10 15 20 25 30 35 40 45 50 55 60 0 5 10 15 20
C
o
n
ta
ct
a
n
gl
e
[°
]
Amount of deposited droplets 1 g/l 2 g/l Substrate
10
ethylene glycol as the testing fluid, it appears that the decrease of the contact angle as a function of the amount of deposited droplets is approximately linear until around 12 droplets, going down to around 25° and 15° for the lower and higher concentrations of the deposited droplets. After about 13 deposited droplets, we can see that for both the testing liquids the static contact angle hardly changes. Interestingly, this corresponds to the same amount of deposited droplets for which the electrical resistance did not change significantly anymore, and is related to a full coverage of the substrate.
We are also interested in the contact angle hysteresis as a function of the amount of deposited droplets. Acknowledging that the advancing and receding contact angle can be measured in many ways and that the uniqueness of such contact angles is questioned [29], we still measure them to have a qualitative idea of their behaviors when the substrate is covered by nanoparticles. For this purpose, Fig. 12 shows the advancing and receding contact angles corresponding to a part of the experiments presented in Figs. 10-11.
Figure 12: Receding and advancing contact angles of (a) water and (b) ethylene glycol on the polycarbonate substrate as a function of the amount of deposited droplets of carbon nanotubes
(concentration 1 g/l).
First of all, we note that the advancing and receding contact angles, respectively, 81° and 55° for water and 65° and 32° for ethylene glycol on polycarbonate surface correspond nicely with those reported in the [28], i.e. 90° and 63° for water and 64° and 34° for ethylene glycol on polycarbonate surface. Fig. 12 shows furthermore that on increasing the amount of deposited droplets, the advancing contact angle increases slightly, while the receding contact angle decreases considerably. The contact angle hysteresis for water is more affected (increasing) than that for ethylene glycol on increasing the amount of deposited droplets. It can be suggested that during an advancing contact angle, a higher coverage of nanoparticles on the substrate causes more pinning, so that the advancing contact angle increases. However, when the droplet is receding, the capillary forces that are higher with a higher coverage (due to a formed nanoporous structure) cause the receding contact angle to decrease.
Conclusions
In this work, water droplets containing carbon nanotubes are evaporated on a polycarbonate substrate in order to form self-assembled nanoporous nanostructures. The morphology of the nanotubes is characterized by a nanoparticle size distribution and scanning electron microscopy (SEM). The particle size distribution appears to be rather narrow and an average value of 27 nm is found for the nanotube diameter, which indicates a tendency towards agglomeration, knowing that the diameter of a single nanotube is around 2-5 nm. The SEM images have shown that the density of the created structures increases with the number of droplets, more pronouncedly for the first five deposited droplets. The material properties of the obtained structures are tested for their electrical resistance and wettability. 10 20 30 40 50 60 70 80 90 100 0 5 10 15 20 C on ta ct a n gl e [° ]
Amount of deposited droplets Static contact angle Advancing contact angle Receding contact angle
10 20 30 40 50 60 70 80 90 100 0 5 10 15 20 C on ta ct a n gl e [° ]
Amount of deposited droplets Static contact angle Advancing contact angle Receding contact angle
11
The first five deposited droplets are, corresponding to the density observations, responsible for the large decrease in both the electrical resistance and static contact angle. The electrical resistance decreased from 300 MΩ, which is simply the maximum value observable by the probe, to around 20 kΩ, which is a decrease of at least 4 orders of magnitude. The static contact angle decreased from 78° to around 25° for water as the testing liquid, regardless the concentration of the deposited droplet. However, for ethylene glycol as the testing liquid, the static contact angle went from 53° to 25° or 15°, for lower and higher concentrations of the deposited droplets, respectively. A higher concentration of the deposited carbon nanotubes seems to emphasize the decrease of the electrical resistance. The same holds for the static contact angle, although this difference is more pronounced for ethylene glycol as the testing liquid. The explanation could be linked to a better coverage of the substrate as the SEM images show. As for the advancing and receding contact angles, it appeared that the former increases and the latter decreases on increasing the number of deposited droplets. The contact angle hysteresis increased thereby, being more pronounced for water than for ethylene glycol. A better coverage causes more pinning for an advancing droplet and higher capillary forces for a receding droplet.
The effect of a higher concentration in a deposited droplet not only brings about a better coverage of the substrate, but also a higher evaporation rate. This is explained by [30] to be caused by a better pinning of the deposited droplet (so that the well-known high evaporation at the triple line remains in action) as well as by an increase of the thermal conductivity due to the nanoparticles. The higher coverage will also lead to a higher porosity and higher electrical conductivity. So it seems that there is a link between high evaporation rates and high porosity and electrical conductivity.
Other findings in the literature have shown that UV-treatment decreases the static contact angle of water on polycarbonate to a bit more than 60° [31]. A decrease to around 45° for the static contact angle of water on polycarbonate is reported in [32], but using rather a surface irradiation treatment with N, Ar or Xe of the polycarbonate surface. The multi-drop method is less costly and less energy-consuming. This work shows that a simple and low-cost procedure is capable of obtaining nanostructures whilst attaining considerable decreases in the electrical resistance and the static contact angle that are comparable to the findings in the literature.
Acknowledgements
We thank Ir. Patrick Queeckers and Ir. Jean-Charles Dupin for technical assistance. The authors acknowledge financial support from BelSPo through the MAP Drop Evaporation programme at ESA. H.M., C.M. and C.S.I. acknowledge financial support from Graphene Flagship.
References
[1] Adams L, Oki A, Grady T, McWhinney H, Luo Z (2009) Preparation and characterization of sulfonic acid-functionalized single-walled carbon nanotubes. Physica E 41:723-728.
[2] Bufon CCB, González JDC, Thurmer DJ, Grimm D, Bauer M, Schmidt OG (2010) Self-assembled ultra-compact energy storage elements based on hybrid nanomembranes. Nano Letters 10:2506-2510.
[3] Wang W, Lee T, Reed MA (2003) Electronic transport in self-assembled alkanethiol monolayers. Physica E 19:117-125.
[4] Prevo BG, Kuncicky DM, Velev OD (2007) Engineered deposition of coatings from nano- and microparticles: A brief review of convective assembly at high volume fraction. Colloids and Surfaces A: Physicochemical and Engineering Aspects 311(1-3):2-10.
[5] Maillard M, Motte L, Pileni MP (2001) Rings and hexagons made of nanocrystals. Advanced Materials 13(3):200-204.
[6] Wang D, Liu S, Trummer BJ, Deng C, Wang A (2002) Carbohydrate microarrays for the recognition of cross reactive molecular markers of microbes and host cells. Nature biotechnology 20:275-281.
12
[7] Smalyukh II, Zribi OV, Butler JC, Lavrentovich OD, Wong GCL (2006) Structure and dynamics of liquid crystalline pattern formation in drying droplets of DNA. Physical Review Letters 96:177801.
[8] Chen K, Stoianov SV, Bangerter J, Robinson HD (2010) Restricted meniscus convective self-assembly. Journal of Colloid and Interface Science 344(2):315-320.
[9] Grishaev V, Iorio CS, Dubois F, Amirfazli A (2015) Complex drop impact morphology. Langmuir 31:9833-9844.
[10] Deegan RD, Bakajin O, Dupont TF, Huber G, Nagel SR, Witten TA (1997) Capillary flow as the cause of ring stains from dried liquid drops. Nature 389:827-829.
[11] Bhardwaj R, Fang X, Attinger D (2009) Pattern formation during the evaporation of a colloidal nanoliter drop: a numerical and experimental study. New Journal of Physics 11:075020. [12] Sommer AP, Franke R (2003) Biomimicry patterns with Nanosphere Suspensions. Nano Letters 3(5):573.
[13] Truskett VN, Stebe KJ (2003) Influence of surfactants on an evaporating drop: fluorescence images and particle deposition patterns. Langmuir 19:8271-8279.
[14] Deegan RD (2000) Pattern formation in drying drops. Physical Review E 61:475-485. [15] Hu H, Larson RG (2006) Marangoni effect reversed coffee-ring depositions. Journal of Physical Chemistry B 110:7090-7094.
[16] Kokornaczyk MO, Dinelli G, Marotti I, Benedettelli S, Nani D, Betti L (2011) Self-organized crystallization patterns from evaporating droplets of common wheat grain leakages as a potential tool for quality analysis. The Scientific World Journal 11: 1712-1725.
[17] Park J, Moon J (2006) Control of colloidal particle deposit patterns within picoliter droplets ejected by inkjet printing. Langmuir 22:3506-3513.
[18] Sommer AP, Cehreli M, Akca K, Sirin T, Piskin E (2005) Superadhesion: attachment of nanobacteria to tissues - model simulation. Crystal Growth and Design 5(1):21-23.
[19] Andreeva LV, Koshkin AV, Lebedev-Stepanov PV, Petrov AN, Alfimov MV (2007) Driving forces of the solute self-organization in an evaporating liquid droplet. Colloids and Surfaces A: Physicochem. Eng. Aspects 300:300-306.
[20] Onoda G, Somasundaran P (1987) Two- and one-dimensional flocculation of silica spheres on substrates. Journal of Colloid and Interface Science 118(1):169-175.
[21] Xiao J, Bhardway R, Attinger D (2011) Manufacturing self-assembled coatings of micro- and nano-particles by controlled evaporation of drops and thin films. Proc. of SPIE 8031:80310X, p. 1-11.
[22] Machrafi H, Rednikov A, Colinet P, Dauby PC (2015) Importance of wave-number dependence of Biot numbers in one-sided models of evaporative Marangoni instability: horizontal layer and spherical droplet. Physical Review E 91:053018.
[23] Schiaffino S, Sonin AA (1997) Molten droplet deposition and solidification at low Weber numbers. Phys. Fluids 9:3172.
[24] Ivall J, Renault-Crispo JS, Coulombe S, Servio P (2016) Ice-dependent liquid-phase convective cells during the melting of frozen sessile droplets containing water and multiwall carbon nanotubes. Int. J. Heat Mass Transf. 101:27-37.
[25] Dash S, Garimella SV (2014) Droplet evaporation on heated hydrophobic and superhydrophobic surfaces. Physical Review E 89: 042402
[26] Smits FM (1958) Measurement of sheet resistivities with the four-point probe. Bell System Technical Journal 34:711-718.
[27] Rangharajan KK, Kwak KJ, Conlisk AT, Wu Y, Prakash S (2015) Effect of surface
modification on interfacial nanobubble morphology and contact line tension. Soft Matter 11: 5214-5223.
[28] Ruiz-Cabello FJ, Rodríguez-Valverde MA, Cabrerizo-Vilchez MA (2011) contact angle hysteresis on polymer surfaces: an experimental study. Journal of Adhesion Science and Technology 25:2039-2049.
13
[29] Pittoni PG, Lin CH, Yu TS, Lin SY (2014) On the uniqueness of the receding contact angle: effects of substrate roughness and humidity on evaporation of water drops. Langmuir
30:9346−9354.
[30] Zhong X, Duan F (2014) Evaporation of sessile droplets affected by graphite nanoparticles and binary base fluids. J. Phys. Chem. B 118:13636-13645.
[31] Subedi DP, Tyata RB, Rimal D (2009) Effect of UV-treatment on the wettability of polycarbonate. K.U. Journal of Science, Engineering and Technology 5:37-41.
[32] Lee CY, Kil JK (2008) Hydrophilic property by contact angle change of ion implanted polycarbonate. Review of Scientific Instruments 79:02C508.