Cell-based description of ventricular
contraction in a model of the human
cardiovascular system
S. Kosta∗J. Negroni∗∗ E. Lascano ∗∗ P. C. Dauby∗ ∗University of Liege, GIGA - Cardiovascular Sciences, Belgium
(e-mail: sarah.kosta@ulg.ac.be).
∗∗Department of Comparative Cellular and Molecular Biology, Favaloro University, Buenos Aires, Argentina
Abstract: A multiscale model of the cardiovascular system (CVS) is presented. Hemodynamics is described by a lumped parameter model, while heart contraction is described at the cellular scale. An electrophysiological model and a mechanical model were coupled and adjusted so that the pressure and volume of both ventricles are linked to the force and length of a half-sarcomere. Particular attention was paid to the extremal values of the sarcomere length, which must keep physiological values. This model is able to reproduce healthy behavior, preload variations experiments, and ventricular failure.
Keywords: Mathematical models - Physiological models - Multiscale models - Cardiovascular system - Sarcomere contraction
1. INTRODUCTION
Mathematical models of biological systems have become a powerful tool for cardiovascular sciences. These models allow for a variety of studies that are generally difficult to implement experimentally. A model of the whole car-diovascular system (CVS) basically needs a mathematical description of the following two components:
• The hemodynamics of the systemic and pulmonary circulation
• The active contraction of the heart
The hemodynamics, i.e. the blood flow evolution in-side the blood vessels, is described here with a lumped-parameter model. The heart contraction is often decribed with ad hoc models, like the varying elastance model. Such macroscopic models are not based on the cardiac tissue properties and can not reproduce behaviors that arise from the microscopic scale. In this work we use a cardiac cell contraction model that we connect to the organ scale in order to get a multiscale model of the human CVS. The purpose of this model is to link macroscopic proper-ties to the microscopic behaviors they originate from, a correlation impossible to establish with phenomenological models.
2. METHODS
Our lumped-parameters model of the CVS consists of a 6-chamber model, two of which being able of active contraction (Burkhoff and Tyberg (1993)). A schematic representation of this model is depicted on Fig. 1.
? P.C.D. acknowledges travel financial support from F.R.S.-FNRS.
Rmt PlvVlv LV PaoVao Aorta PvcVvc Vena cava PrvVrv RV PpaVpa PA PpuVpu PU Rav Rtc Rpv Rsys Rpul Active contraction
Fig. 1. Diagram of the 6-chamber hemodynamic model: left ventricle (LV), right ventricle (RV), pulmonary artery (PA), pulmonary vein (PU), aorta (AO), vena cava (VC).
2.1 Flow in the CVS
The flow inside the systemic and pulmonary circulation can be written as:
Q(t) =Pi(t) − P o(t)
R (1)
where Piis the pressure at the entrance of the chamber, P o the pressure at the exit, and R is the hydraulic resistance of the blood vessels.
The four cardiac valves (mitral, aortic, tricuspid, and pul-monary) act as diodes and allow for the unidirectionnality of the flow.
2.2 Passive chambers
The aorta (AO), vena cava (VC), pulmonary artery (PA), and pulmonary vein (PU) are considered as passive cham-ber (unable of active contraction). The pressure-volume relationship in these chambers is written as:
P (t) = E · V (t) (2)
where E is the elastance of the corresponding chamber. Finally, the chamber volume changes are described by the following differential equation:
dV
dt = Qin− Qout (3)
where Qinand Qout are the flows that respectively enters and leaves the chamber.
2.3 Active chambers
Cell model The left and right ventricles are capable of active contractions, which are described at the cellular scale. Cardiac cells are excitable and contractile. We use the electrophysiological model of ten Tusscher and Panfilov (2006) to describe the ionic currents across the cell membrane and the mechanical model of Negroni and Lascano (2008) to describe the contraction. The cellular force is derived from the contraction of a half-sarcomere (basic unit of cell contraction), as shown on Fig. 2.
Thick filament
Thin filament Parallel element
Fig. 2. Sarcomere contraction model (adapted from Ne-groni and Lascano (2008)). Left : Representation of a half-sarcomere of length L. Lmis the total length and allows to account for the compliant (elastic) ends of the muscle. Right : Calcium kinetics.
Myosin heads (also called crossbridges) of the thick fila-ment attach to the thin filafila-ment and initiate the muscular contraction. This model describes the behavior of an equiv-alent crossbridge that represents all the crossbridges of the half-thick filament. It is assimilated to a linear spring of horizontal elongation h. The active force is proportionnal to this elongation. A parallel elastic element is added to account for the passive force of the muscle.
Calcium kinetics is described with a 5-state model rep-resented on Fig. 2 (two states from the original paper were merged into one, see Negroni et al. (2015)) . A tro-ponin system (TS) is composed of three adjacent trotro-ponin- troponin-tropomyosin units and can fix three calcium ions in one step (TSCa3). Then three crossbridges can attach to the actin molecules in a weak pre-power stroke state (TSCa∼3), then in a state where they are able to develop a power
stroke (TSCa∗3). Finally the three calcium ions can detach (TS∗) and the crossbridges eventually detach to end the cycle. The active force is also proportionnal to the con-centrations of the three states with attached crossbridges (TSCa∼3, TSCa∗3, and TS∗). Troponin currents were added in the equation governing calcium concentration from the Ten Tusscher and Panfilov model, thus linking the elec-trophysiology and the mechanical contraction of the cell. We then had to reduce the total cytosolic calcium buffer concentration to 100 µM provided that the buffering due to troponin was taken into account in the calcium kinetics described previously.
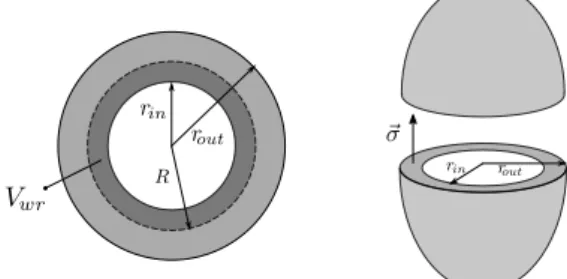
Ventricle model To connect the force Fm and total length Lm of the half-sarcomere to the pressure and volume of the active chamber, both ventricles are simply considered as spheres, as shown on Fig. 3.
Fig. 3. Spherical ventricle model. Left : Top view of the ventricle. N sarcomeres are aligned along a circle of radius R (dotted black). Right : Both ventricles are assimilated to thin spheres. The wall stress σ is related to the force produced by the sarcomeres and allows for the calculus of the pressure inside the ventricle. As already done by Shim et al. (2007), we assume that N half-sarcomeres of total rest length Lm0are aligned along a circle of radius R0:
Lm0= 2πR0
N . (4)
This radius was chosen so that the total half-sarcomere length Lm during a heartbeat varies between physiologi-cally relevant extremes, i.e. between 0.98 and 1.115 µm (Rodriguez et al. (1992)). There is indeed an impor-tant (yet not fully elucidated) relationship between the force and the length of the cardiac muscle. This leads to important properties at the organ scale, especially the Franck-Starling mechanism. Thus it was essential to get the correct interval of variation for Lm in our multiscale model.
The blood volume inside the ventricle is given by:
Vint= 4 3πrin
3. (5)
During a heartbeat, this volume varies according equation (3). Thus Lmis given by:
Lm= 2πR
N (6)
Vint+ Vwr= 4 3πR
3. (7)
In this relation, Vwr is the constant volume of the incom-pressible wall included between rint (at the beginning of diastole) and R.
Now we have to connect the pressure P inside the ventric-ular cavity to the force F produced by the half-sarcomeres. We assume that many contractile units are distributed homogeneously in all directions on the ventricular wall (Shim et al. (2007)), so that the wall stress σ can be considered uniform. With a constant wall stress σ, the equilibrium of the two hemispheres of the ventricles gives the following expression of the pressure inside the active chambers:
P = σ(rout 2 rin2
− 1) (8)
where σ is given by:
σ = F
A (9)
with F the force and A the cross-sectional area.
The mechanical contraction model actually provides Fm, the force normalized with respect to the muscle cross-sectional area measured at a defined reference state, Ar:
Fm= F Ar
. (10)
Assuming that muscle units have constant volume, we also have:
Lr· Ar= Lm· A (11)
where Lr is the total sarcomere length at the reference aera Ar.
From (9) - (11) , we can obtain the pressure-force relation of our multiscale model :
P = 7.5 Fm Lm Lr (rout 2 rin2 − 1) + γ(Vin− V0)3. (12) The 7.5 factor stands for the units change (pressure is expressed in mmHg) and the last term is a passive pressure that accounts globally for the elastic properties of the tissue surrounding the ventricle (γ is the stiffness and V0 is the unstressed volume).
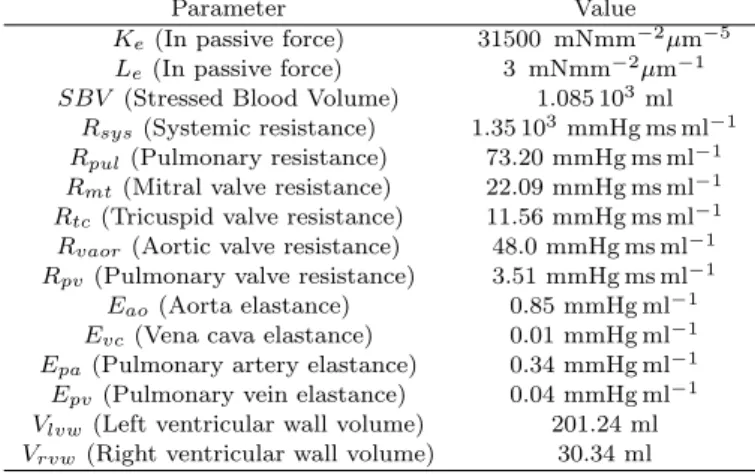
The multiscale model presented above depends on many parameters, which can be split into microscopic (or cel-lular) parameters and macroscopic (or hemodynamic) pa-rameters. The hemodynamic parameters (resistances and elastances of passive chambers, wall thickness of the ventri-cles) were optimized so that the following quantities range around human physiological values: systolic pressure (for both ventricles), amplitude of the aortic pressure, ampli-tude of the pulmonary artery pressure, systolic volume (for both ventricles), and stroke volume. The values of the cellular parameters can be obtained in the original
papers in which the electrophysiological model and the contractile model were developed (ten Tusscher and Pan-filov (2006); Negroni and Lascano (2008)). However, when these values of the cellular parameters are used in the complete multiscale model of the CVS, the ventricular pressure calculated at the end of diastole (filling phase of the ventricle) was found too high, while the systolic pres-sure (ejecting phase of the ventricle) was too low compared to physiological values. This difficulty originates from the too simple geometrical description of the ventricles, which are here considered as spheres. In a real heart, bundles of cardiac fibers are actually wrapped around the ventricular cavity so that the ventricle is also twisted in a very complex way during contraction. Of course the spherical model of ventricles presented above cannot take into account this aspect of contraction and an adaptation of the values of some parameters was necessary to compensate for the simplicity of the model. From (8), it is easy to understand that the systolic pressure, which is related to the maximum active force generated in the sarcomeres, can be increased by increasing the ventricle wall thickness. However, since the diastolic pressure, which is related to the passive force in the myocytes, also increases with the wall thickness, we had to drastically reduce the intensity of the sarcomere passive force in order to recover physiological diastolic pressures. In summary, the price to pay for the spherical model of the ventricles is a value of the wall thickness which is higher than standard physiological values and an important reduction factor to apply to the cellular parameter measuring the passive force of the sarcomere. All other cellular parameters keep however their original values, except for the total cytosolic calcium buffer concen-tration, as explained previously. The adjusted parameters are summarized in Table 1.
Table 1. Adjusted parameters
Parameter Value Ke(In passive force) 31500 mNmm−2µm−5
Le(In passive force) 3 mNmm−2µm−1
SBV (Stressed Blood Volume) 1.085 103 ml
Rsys(Systemic resistance) 1.35 103mmHg ms ml−1
Rpul(Pulmonary resistance) 73.20 mmHg ms ml−1
Rmt(Mitral valve resistance) 22.09 mmHg ms ml−1
Rtc(Tricuspid valve resistance) 11.56 mmHg ms ml−1
Rvaor(Aortic valve resistance) 48.0 mmHg ms ml−1
Rpv (Pulmonary valve resistance) 3.51 mmHg ms ml−1
Eao(Aorta elastance) 0.85 mmHg ml−1
Evc(Vena cava elastance) 0.01 mmHg ml−1
Epa(Pulmonary artery elastance) 0.34 mmHg ml−1
Epv (Pulmonary vein elastance) 0.04 mmHg ml−1
Vlvw(Left ventricular wall volume) 201.24 ml
Vrvw (Right ventricular wall volume) 30.34 ml
3. RESULTS
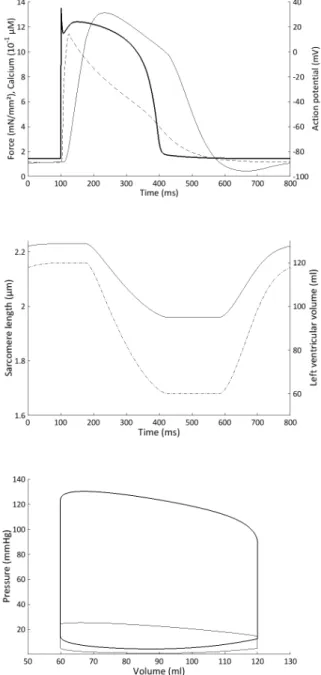
We first simulated a baseline situation corresponding to a healthy individual. Some important microscopic variables are presented on Fig. 4 with their corresponding macro-scopic variables. The action potential, the intracellular calcium, and the force time evolutions are correctly repro-duced. It is important to stress that the sarcomere length lies between physiological values (Rodriguez et al. (1992)).
The pressure-volume loops are also correctly reproduced. Some hemodynamic variables are also shown on Fig. 5.
Fig. 4. Top panel: Action potential (bold), normalized force (normal), and intracellular calcium (dashed) time evolution during one heartbeat in the left ven-tricle. Middle panel: Sarcomere length (normal) and left ventricular volume (dash-dotted) time evolution during the same heartbeat. Bottom panel: Pressure-volume loop in the left (bold) and right (normal) ventricle during the same heartbeat.
We also simulated a preload variation experiment. To mimic the inflation of a Fogarty balloon, which is a current way of reducing preload, we have increased tricuspid valve resistance, thus allowing less blood to enter the right ventricle. The consequences on the pressure-volume loops on both ventricles are presented on Fig. 6. It is worth emphasizing that the upper left corners of the PV-loops are not exactly located on a straight line, as often postulated when varying elastance models of contraction are used.
Fig. 5. Hemodynamic variables. The top two curves rep-resent the flow through the aortic valve (normal) and through the pulmonary valve (dotted) during one heartbeat. Left ventricular pressure (bold), aortic pressure (dashed), right ventricular pressure (normal) and pulmonary pressure (dash-dotted) are also repre-sented.
Fig. 6. Pressure-volume loops in the left and right ventricle during a decrease in preload in the right ventricle. Eventually, we simulated a case of ventricular failure. It has been shown that heart failure symptoms originate at the cellular scale (Beuckelmann et al. (1992, 1993); Wang and Hill (2010)). Alterations in ionic currents and calcium handling lead to a prolonged action potential, a lower peak of intracellular calcium, and a lower force. Reduction in current densities of the inward rectifier K+ current and the transient outward K+current, increased activity of the Na+/Ca2+ exchanger and a reduced Ca2+ sequestration by the sarcoplasmic reticulum were implemented in our model. Our multiscale model is then able to connect these cellular altered properties to the hemodynamics variables, as shown on Fig. 7.
4. DISCUSSION
We have developed a multiscale model of the human CVS based on the ten Tusscher and Panfilov model of electro-physiology, the Negroni and Lascano model of sarcomere contraction, and a lumped parameter model of hemody-namics.
The ventricle model is quite simple compared to other works (Arts et al. (1991), Bovendeerd et al. (1992)), but this approach was chosen for its low computational cost. The aim of our work is to connect two scales of cardiac
Fig. 7. Ventricular failure (dashed) versus normal ventricle. From top to bottom: action potential, intracellular calcium, normalized force, pressure-volume loops.
contraction and study the correlation of microscopic and macroscopic variables inside a complete CVS model. This implies the computation of many heart beats in a row, which is the reason we choose a simple spherical ventricle model. Our results, on the other hand, correlate well with experimental data. Our multiscale model can account for a healthy behavior as shown in Fig. 4 and 5. More importantly, it is also able to reproduce pathological behaviors that originate at the cellular scale, like heart failure, and the consequences on the whole CVS. It is also able to reproduce basic hemodynamic experiments like preload variations.
Our approach in building this multiscale model was similar to Shim et al. (2007) but with four major differences: we carefully choose the volume Vwr from Fig. 3 so that the sarcomere length ranges between extremal physiological values. The pressure-force relationship derived in (8) was also different from the one used by Shim et al. (2007). We also used the last version from the mechanical model of Negroni and Lascano (2008). Eventually, we used our model to reproduce heart failure symptoms.
ACKNOWLEDGEMENTS
Th. Desaive and A. Pironet are cordially acknowledged for comments and advice, especially in the identification of the hemodynamic parameters.
REFERENCES
Beuckelmann, D. J., Nabauer, M., and Erdmann, E. (1992). Intracellular calcium handling in isolated ven-tricular myocytes from patients with terminal heart failure. Circulation, 85, 1046-1055.
Beuckelmann, D. J., Nabauer, M., and Erdmann, E. (1993). Alterations of K+ currents in isolated human ventricular myocytes from patients with terminal heart failure. Circ. Res., 73, 379-385.
Burkhoff, D., and Tyberg, J. V. (1993). Why does pul-monary venous pressure rise after onset of LV dysfunc-tion: a theoretical analysis. Am J Physiol Heart Circ Physiol, 265, H1819-H1828.
Negroni, J. A., and Lascano, E. C. (2008). Simulation of steady state and transient cardiac muscle response experiments with a Huxley-based contraction model. J Mol Cell Cardiol, 45, 300-312.
Negroni, J. A., Morotti, S., Lascano, E. C., Gomes, A. V, Grandi, E., Puglisi, J. L., and Bers, D. M. (2015). β-adrenergic effects on cardiac myofilaments and contrac-tion in an integrated rabbit ventricular myocyte model. J. Mol. Cell. Cardiol. 81, 162?75. J Mol Cell Cardiol, 81, 162-175.
Rodriguez, E. K. et al. (1992). A method to reconstruct myocardial sarcomere lengths and orientations at trans-mural sites in beating canine hearts. Am J Physiol Heart Circ Physiol, 263, H293-H306.
Shim, E. B., Amano, A., Takahata, T., Shimayoshi, T., and Noma, A. (2007). The cross-bridge dynamics during ventricular contraction predicted by coupling the cardiac cell model with a circulation model. J Physiol Sci, 57, 275-285.
Ten Tusscher, K. H. W. J., and Panfilov, A. V. (2006). Alternans and spiral breakup in a human ventricular
tissue model. Am J Physiol Heart Circ Physiol, 291, H1088-H1100.
Wang, Y., and Hill, J. A. (2010). Electrophysiological remodeling in heart failure. J. Mol. Cell. Cardiol, 48, 619-632.