CHARACTERISING URBAN MORPHOLOGY WITH SPECTRAL
UNMIXING AND SPATIAL METRICS: A CASE STUDY ON
DUBLIN
Frank Canters1, Tim Van de Voorde1, Marc Binard2, Yves Cornet2
1Cartography and GIS Research Group, Dept. of Geography, Vrije Universiteit Brussel Pleinlaan, 2 – B1050 Brussels, Belgium
2Unité de Géomatique, Dept. of Geography, Université de Liège Allée du 6 Août, 17 – B4000 Liège, Belgium
Abstract
In today’s urbanising world, effective urban management and planning strategies are needed to temper the impact of urban change processes on the natural and human environment. To develop and monitor such strategies, and to assess their spatial impact, analysing changes in urban structure is essential. Data from earth observation satellites provide regular information on urban development and, as such, may contribute to the mapping and monitoring of cities and the modelling of urban dynamics. Especially images of medium resolution (Landsat, SPOT, …), which are cheap, widely available and often part of extensive historic archives, offer a wealth of information that may be useful for urban monitoring purposes. The lower resolution of this type of imagery, however, hampers the study of urban morphology and change processes at a more detailed, intra-urban level. Spectral unmixing approaches, which allow characterising land-cover distribution at sub-pixel level, may partly compensate for this lack of spatial detail, and may render medium-resolution imagery more useful for urban studies. The main research question addressed in this paper is how medium-resolution imagery could be used to describe urban morphology, by combining spectral unmixing approaches with spatial metrics. Spatial metrics derived from satellite imagery may be useful to quantify structural characteristics of expanding cities, and may provide indications of functional land use. In this study, we develop a set of urban metrics for use on continuous sealed surface data produced by sub-pixel classification of Landsat ETM+ imagery. Two sub-pixel classification approaches are examined for that purpose. In a first approach, we use a linear spectral mixture model with a vegetation and a non-vegetation endmember to deconvolve each pixel’s spectrum into fractional abundances of the two end member spectra, which are determined by visualising mixture space with principal component analysis. In a second approach, we use a linear regression model to estimate the proportion of vegetation cover within each Landsat pixel. In both approaches, an urban mask is used to indicate pixels belonging to urban land cover. Only pixels within the urban mask are subjected to sub-pixel classification. We hereby assume that the urban area does not contain bare soil and that the area of a pixel not covered by vegetation fully consists of sealed surface cover. The resulting sealed surface proportion map is then used to characterise urban morphology and land use by
means of the shape of the cumulative frequency distribution of the estimated sealed surface fractions within a building block. A transformed logistic function is fitted to this distribution with a least-squares approach to obtain function parameters that are used as variables in a supervised classification approach, together with spatially explicit metrics (spatial variance and Moran’s I).
Our study demonstrates that images from medium resolution sensors can be used to characterise intra-urban morphology, and that the structure of a building block as described by the proposed metrics gives an indication of its membership to certain morphological/functional urban classes. In future research we will incorporate socio-economic data in the metric analysis to further improve the distinction of urban land-use categories. The spatial metrics approach developed in this study will be used in experiments to improve the calibration of the MOLAND urban growth model, which is currently calibrated with historical land-use maps available for approximately 10-year intervals.
Introduction
More than half of the world’s population lives in urbanised areas, and in the future cities will house an increasing number of people in both absolute and relative terms (Martine, 2008). While spatial expansion of cities is a natural consequence of demographic and economic trends and changes in lifestyle on which local and regional policy-makers have seemingly little grasp, local policy should be concerned about how population growth is translated into spatial patterns of urban growth. Urban sprawl and increased soil sealing provide symptomatic evidence for the fact that many European and North-American cities grow faster spatially than demographically. A study of the European Environment Agency confirms this by reporting that European cities have expanded on average by 78% since the mid-1950s, while during the same period the population increased by only 33% (EAA, 2006). This dilution of the urban fabric has both direct and indirect impacts on the environment and the well-being of urban residents. For instance, uncontrolled sprawl increases energy consumption, pollution and greenhouse gas emissions, demands more transport infrastructure, may lead to increased flood risks and encroaches on natural landscapes. Effective urban management and planning strategies at different levels of government are therefore essential to temper the environmental consequences of urban land consumption. To develop and monitor such strategies and to assess their spatial impact, analysing and characterising changes in urban structure is important. Data from earth observation satellites provide regular information on urban development and could in that way contribute to mapping and monitoring structural characteristics of expanding cities. A rather novel approach in this research area is to describe urban form by means of spatial metrics, i.e. quantitative measures of spatial pattern and composition that have recently shown considerable potential for structural analysis of urban environments (Herold, et al., 2005; Torrens, 2008). Spatial metrics derived from satellite imagery may also help to describe the morphological characteristics of urban areas and their changes through time (Ji, et al., 2006). Because previous studies have demonstrated a relationship between the spatial
structure of the built-up environment and its functional characteristics (Barr & Barnsley, 1997), quantifications of urban morphology through spatial metrics can also be related to land use.
Despite the currently available high resolution satellite images, which provide increasingly detailed information about urban surface materials, most of the historic archive imagery consists of medium resolution (MR) data such as from the Landsat or SPOT programmes. Therefore, to study urban growth patterns over a time-span that exceeds the availability of high resolution imagery, spatial metrics that succeed in capturing structural information from images with a pixel size of 20 meters or more should be used. In this study, we aim to characterise urban structure and land use in the Greater Dublin area by developing spatial metrics for use on continuous sealed surface data produced by sub-pixel classification of Landsat images. The spatial metrics are calculated for building blocks that are homogeneous in terms of land use, and are used as variables that enable us to allocate each block to a particular morphological / functional urban class. The proposed approach makes it possible to tap into the extensive historic archives of MR images to characterise urban growth patterns at a reasonably detailed level, on an intra-urban basis and at low cost.
Study area and data
The study area for this research is Dublin, the political and economical capital of Ireland and home to over 40% of the country’s population. Dublin experienced rapid urban expansion in the 1980’s and 1990’s, fuelled by the building of new roads that drove residential and commercial development rapidly outward into the urban fringe (Kitchen, 2002).
A Landsat TM image (path 206, row 23) acquired on May 24th 2001 was used to derive a sealed surface map for the study area. The image was geometrically co-registered to the Irish Grid projection system and the raw digital numbers were converted to exoatmospheric reflectance according to the formulas and calibration parameters presented by The Landsat 7 Users Handbook (Irish, 2009). An existing high resolution land-cover map, derived from a Quickbird image acquired on August 4th 2003, was used to obtain reference data for training and validation of the sub-pixel classifiers. Homogeneous blocks for structural analysis were defined by overlaying a TeleAtlas road database for the area with the European MOLAND land-use map of 2000.
Deriving continuous sealed surface data
The downside of using MR data for urban analysis is the relatively low spatial resolution, which limits the level of structural detail that can be resolved from the imagery, and which may also lead to low mapping accuracies because the sensor’s instantaneous field of view (IFOV) often contains different types of land cover. To overcome this drawback we applied spectral unmixing, a technique that relates a pixel’s spectrum to fractions of its surface constituents. One of the most common methods to approach this problem is linear spectral mixture analysis (LSMA), whereby a pixel’s
observed reflectance is modelled as a linear combination of spectrally pure “endmember” reflectances (van der Meer, 1999). LSMA has recently received quite some attention in studies that aim to characterise urban environments (Rashed, et al., 2005). Some of these studies resort to the components of the Vegetation, Impervious surface and Soil (VIS) model proposed by Ridd (1995) to represent the endmembers of the LSMA model. However, not all pure vegetation, man-made impervious surface or soil pixels necessarily occupy well-defined, extreme positions in feature space and can, as such, not directly be used as endmembers for linear unmixing. One reason for this is that pure pixels are spectrally variable because of brightness differences, even though they may represent a similar surface type. This problem can be dealt with by applying brightness normalisation prior to the unmixing (Wu, 2004). Another reason is spectral confusion between VIS components, such as dry bare soils and bright sealed surfaces, which in some cases take up similar positions in feature space.
While some authors did succeed in defining a soil endmember for their study area (e.g. Phinn, et al., 2002), this was not possible for the Dublin case. We therefore decided to use a sub-pixel classification approach in which soil is not used as a separate surface component. Because the distinction between urban and non-urban surface cover (sealed surfaces versus bare soil) cannot be explicitly made in that case, a mask was developed to indicate pixels belonging to urban land cover prior to performing the unmixing. The urban masks were created through unsupervised classification, and were subsequently enhanced by a knowledge-based post-classification approach (Van de Voorde, et al., 2007, 2009). Within the bounds of the urban mask, it was assumed that no bare soil occurs. Hence a pixel’s sealed surface fraction can be considered as the complement of the vegetation fraction. Only pixels within the urban mask were subjected to sub-pixel analysis. Two sub-pixel classification models were compared: LSMA with a vegetation and a non-vegetation endmember, and a simple linear regression model that estimates the proportion of vegetation cover for each pixel.
To define the regression model and for validating both models, reference samples were randomly selected from the part of the Landsat image that overlaps the high resolution land-cover classification derived from the Quickbird image. Pixels in the sample set that were suspected to have undergone changes in vegetation cover between the acquisition dates of the Landsat image and the Quickbird image were filtered out by a temporal filtering technique based on iterative linear regression between NDVI values (Van de Voorde, et al., in press).
Characterising urban structure with spatial metrics
Spatial metrics are calculated within a spatial domain, i.e. a relatively homogeneous spatial entity that represents a basic landscape element. The definition of the spatial domain directly influences the metrics and will depend on the aims of the study and the characteristics of the landscape (Herold et al., 2005). In this study, the spatial domain was defined by intersecting a detailed road network with the MOLAND land-use map of 2000. Entities smaller than 1 ha were topologically removed by merging them with
neighbouring blocks because they were too small compared to the image resolution and therefore contained too few pixels for reliable metric analysis. This resulted in a vector layer consisting of 5767 blocks, all relatively homogeneous in terms of land use for the year 2000.
A simple but effective approach to relate the sub-pixel sealed surface proportions within a spatial entity to urban morphology is to calculate the percentage sealed surface cover for each block, i.e. the mean of the per-pixel sealed surface fractions. This provides a variable that expresses built-up density at block level. Based on this variable we produced a built-up density map by dividing the blocks into 4 classes according to their degree of soil sealing: 0-10%, 10-50%, 50-80% and more than 80% (fig. 1, right). The definition of these four classes is based on criteria used in the MOLAND scheme to distinguish non-urban land, discontinuous sparse residential urban fabric, discontinuous residential urban fabric and continuous residential urban fabric. With the resulting map, the study area was stratified according to its built-up density. Blocks with less than 10% sealed surfaces were labelled as non-urban land (fallow land, large vegetated areas, sea, etc.). Blocks with more than 80% sealed surface cover were considered as continuous, dense urban fabric which cannot be characterised further in terms of morphology. The remaining 3494 blocks with 10%-80% sealed surface cover, which belong to different morphological / functional land-use types, such as sparse residential areas or industrial zones with empty, vegetated plots, that cannot be distinguished based on the average sealed surface cover only, were subjected to further analysis.
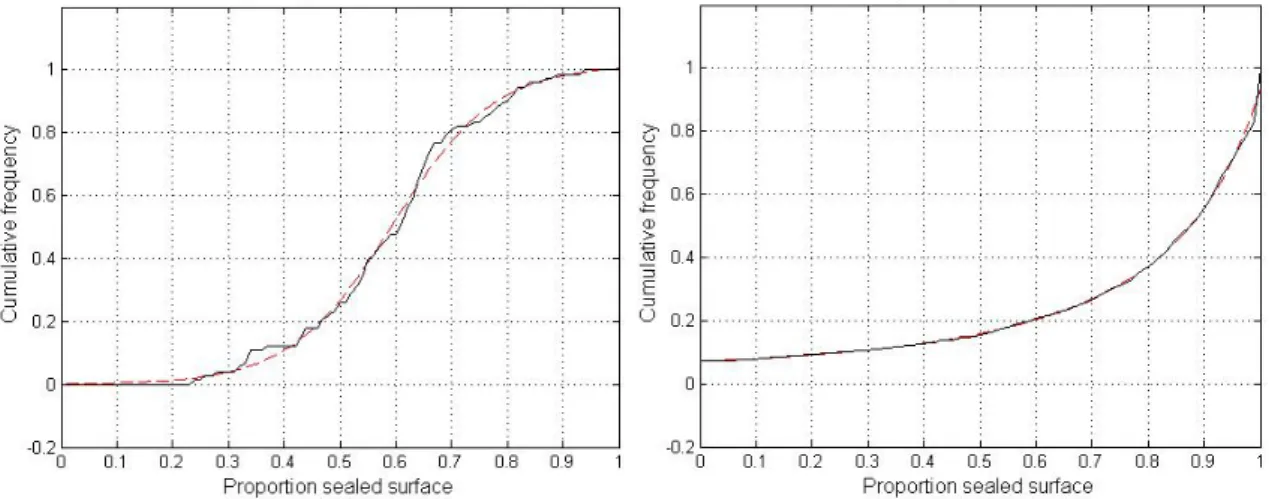
To characterise these blocks in more detail, we examined the cumulative frequency distribution (CFD) of the proportion sealed surface cover of the Landsat pixels within the blocks. Our assumption at this stage was that the shape of this distribution function should be related to the morphological characteristics of the block it represents, which also proved to be the case. Low and medium density residential land-use blocks, for instance, contain many mixed sealed surface-vegetation pixels because the buildings are small compared to the image resolution. The abundance of these mixed pixels is reflected by a sigmoid shaped CFD, whereas the predominance of pure sealed surface pixels, typical for industrial zones, results in a more exponentially shaped CFD (fig. 2). To express the CFD’s shape quantitatively, a function was fitted using a nonlinear least-squares approach. The function’s parameters express the shape of the CFD and, as such, can be linked to the morphological characteristics of different urban land-use classes. Consider the following logistic function:
f i e f P − + = 1 1 ) ( (1)
where Pi(f) is the predicted cumulative frequency within block i of impervious surface fraction f. The point of inflection for this function is 0.5 at a value for f of 0. This basic form can be generalised to allow numerical fitting to a sigmoid shaped CFD, as well as
a CFD shape that is typical of non-residential areas by using the convex part of the function, left of the point of inflection only. For this purpose, the basic form is scaled and translated along the x and y axes:
(2) γ α β +δ + = −( + ) 1 1 ) ( f i e f P
where α and γ are the scaling parameters of the x and y axis respectively, and β and δ the translation parameters. In our analysis, we were only concerned with the part of the function domain and range that falls within the box defined by the interval 0 ≤ f ≤ 1 and 0 ≤ Pi(f) ≤ 1.
Because the function parameters only represent the block’s composition in terms of sealed surface pixels, additionally two spatially explicit metrics were used as classification variables: spatial variance and Moran’s I.
To develop a morphology-based land-use map, the function parameters and spatially explicit metrics were used as variables in a supervised classification based on a multiple layer perceptron (MLP) neural network. To train the classifier, a random learning sample of about 100 blocks was selected for each of 3 major urban classes that were obtained by aggregation of more detailed land-use classes in the MOLAND scheme: urban green (comprised of urban parks, sports and leisure facilities), residential areas, and non-residential areas (comprised of industrial zones, commercial areas and public or private services). The classifier was then applied to all building blocks with 10-80% sealed surface cover. Its performance was assessed by comparing the predicted class memberships of an independent validation sample to the MOLAND land-use map, taking into account the size of the building blocks. The latter was achieved by putting an area based weight on each block in the error calculation. The reasoning behind this weighting is that misclassifying small blocks is considered less severe than misclassifying large blocks in producing the final land-use map.
Results and discussion
The accuracy of the sealed surface proportions predicted by the regression model and by LSMA was assessed with a temporally filtered validation sample that consisted of 2500 ETM+ pixels, for which the reference proportions were determined from downsampling the land-cover classification derived from the Quickbird image. The mean absolute error, calculated from the validation sample by averaging the absolute differences between the observed and predicted proportions, tells us that on average an error of 0.10 (or 10%) is made by the regression analysis in the estimation of the sealed surface fraction within each pixel. This is slightly better than the error of 13% made by applying the LSMA approach. Also in terms of error bias, i.e. the tendency of the model to over or underestimate sealed surface fractions, linear regression analysis performs best. The regression model has a bias very close to 0%. This means that overestimations on certain pixels are compensated by underestimations on others, a useful property if the per-pixel proportions are spatially aggregated. LSMA, on the other hand, lead to a
stronger bias, with the model showing a tendency to overestimate the sealed surface fractions within the pixels. This result is not surprising given the vulnerability of the LSMA model to the choice of endmembers compared to the least-squares optimisation of the regression model. Combined with the urban mask, the sealed surface proportions estimated by linear regression provide a sealed surface map for the study area (fig. 1, left), from which the spatial metrics were derived. The average sealed surface cover for each of the building blocks can also be calculated from it. This results in a map that is useful to visualise the built-up density within the study area (fig. 1, right). It clearly shows the urban gradient: from a compact and dense city centre to a low density, sprawled sub-urban zone.
Figure 1. Per-pixel sealed surface proportions estimated with linear regression analysis from a Landsat 7 ETM+ image of May 24th 2001 (left) and derived urban density map (right). Hatched pattern indicates cloud cover.
To further characterise the building blocks, equation (2) was fitted to the cumulative frequency distribution of each block. Figure 2 shows typical examples for blocks with industrial and residential land use. For industrial land use (fig. 2, right), the CFD takes an exponential form, because the sealed surface cover of the pixels within such blocks is either high or low. For residential land use (fig. 2, left), the CFD is S-shaped because of the abundance of mixed sealed/vegetation pixels. The shape of the fitted function is reflected by the function parameters and represents discriminatory information which is useful for land-use classification.
The overall accuracy of the MLP classification is 86% without using spatially explicit variables (table 1). Only a marginal overall improvement is noted if spatial variance and Moran’s I are included. The relatively large difference between the area weighted and non area weighted results indicates that smaller blocks have a bigger chance of being wrongly classified. This is related to the increasing uncertainty of the relation between the CFD’s shape and a blocks’ morphology if less pixels are present.
Figure 2. Morphology of a low density residential block (left) and an industrial block (right) expressed by the shape of curves numerically fitted (red) to the cumulative frequency distribution of sealed surface pixels (black) for the Landsat image of 2001.
MOLAND land use class Scenario I Scenario II
Producer’s acc User’s acc Producer’s acc User’s acc
Residential 71% (74%) 79% (68%) 72% (71%) 83% (72%)
Non residential 93% (80%) 89% (80%) 91% (81%) 92% (80%)
Green 77% (71%) 83% (77%) 84% (69%) 71% (70%)
Overall area weighted (non area weighted)
86% (76%) 87% (75%)
Table 1. Accuracy of the MLP-based land-use classification with only the function parameters as variables (scenario I), and with both function parameters and spatially explicit metrics (scenario II).
A more detailed morphological land-use map may be obtained if the MLP classification of blocks into three main land-use types is combined with the built-up density map (fig. 3). This map represents the urban structure of Dublin rather well: a dense CBD, sparse residential areas south towards the Wicklow mountains and to the northwest (Clonsilla, Hartstown), and industrial estates near the M50 motorway (Broomhill, Ballymount, Park West).
Conclusions
In this research, the cumulative frequency distribution of sealed surface proportions obtained through spectral unmixing of Landsat ETM+ pixels was used to characterise urban morphology within building blocks.
Figure 3. Morphological land-use map of Dublin derived from a map of sealed surface proportions.
A linear regression model, spatially constrained by an urban mask, was found to be the most reliable approach to derive per-pixel sealed surface fractions. The shape of the frequency distribution of these fractions within blocks defined by the intersection of road network data and the MOLAND land-use map was quantified by the parameters of a fitted transformed logistic function. This function constitutes a type of spatial metric that exploits the advantages of continuous land-cover data, obtained through spectral unmixing of medium resolution satellite imagery.
Our approach showed promising results when applied to distinguish general land-use types with clearly distinct morphological characteristics, such as residential versus non-residential land. In combination with building block density information derived from the sealed surface map, it is possible to distinguish different residential and non-residential morphologies. Using spatially explicit metrics (spatial variance, Moran’s I) in conjunction with the parameters of the fitted function did not significantly improve the results. A further distinction among functional land-use types such as commercial land and services was less successful. For that purpose, ancillary socio-economic data would be required.
Acknowledgment
The research presented in this paper was supported by the Belgian Science Policy Office in the frame of the STEREO II programme - project SR/00/105.
References
Martine, G., 2008. The State of the World Population 2007. New York: United Nations Population Fund.
European Environment Agency (EAA), 2006. Urban Sprawl in Europe – the Ignored Challenge. Brussels: OOPEC, EAA report 10.
Herold, M., Couclelis, H., Clarke, K.C., 2005. The role of spatial metrics in the analysis and modelling of urban land use change. Comput. Environ. Urban,29 , pp. 369-399. Barr, S., Barnsley, M., 1997. A region-based, graph-theoretic data model for the
inference of second-order thematic information from remotely sensed images. Int. J. Geogr. Inf. Sci.,11, pp. 555-576.
Irish, R.R., 2009. Landsat 7 Science Data Users Handbook. [e-book] Greenbelt (MD): NASA, http://landsathandbook.gsfc.nasa.gov/handbook/handbook_toc.html.
van der Meer, F., 1999. Image classification through spectral unmixing. In Stein, A, van der Meer, F., Gorte, B. eds. Spatial Statistics for Remote Sensing. Dordrecht: Kluwer Academic Publishers, pp. 185-193.
Kitchen, P., 2002. Identifying changes of urban social change in Dublin – 1986 to 1996. Irish Geogr., 35, pp. 156-174.
Phinn, S.,Stanford, M., Scarth, P., Murray, A.T., Shyy, P.T., 2002. Monitoring the composition of urban environments based on the vegetation-impervious-soil (VIS) model by subpixel analysis techniques. Int. J. Remote Sens., 23, pp. 4131-4153. Rashed, T., Weeks, J.R., Stow, D. Fugate, D., 2005. Measuring temporal composition of
urban morphology through spectral mixture analysis: towards a soft approach of change analysis in crowded cities. Int. J. Remote Sens.,26, pp. 699-718.
Ridd, M.K., 1995. Exploring a V–I–S (Vegetation–Impervious Surface–Soil) model for urban ecosystem analysis through remote sensing - Comparative anatomy for cities. Int. J. Remote Sens., 16, pp. 2165- 2185.
Torrens, P.M., 2008. A toolkit for measuring sprawl. Applied Spatial Analysis,1, pp. 5-36.
Ji, W., Ma, J., Twibell, R.W., Underhill, K., 2006. Characterising urban sprawl using multi-stage remote sensing images and landscape metrics. Comput. Environ. Urban, 30, pp. 861-879.
Van de Voorde, De Roeck, T., Canters, F., in press. A comparison of two spectral mixture modelling approaches for impervious surface mapping in urban areas. Int. J. Remote Sens.
Van de Voorde, T., De Genst, W., Canters, F., 2007. Improving pixel-based VHR land-cover classifications of urban areas with post-classification techniques. Photogramm. Eng. Remote Sens., 73, pp. 1017-1027.
Van de Voorde, T, Demarchi, L., Canters, F., 2009. Multi-temporal spectral unmixing to characterise change in the urban spatial structure of the Greater Dublin area. In 28th EARSeL Symposium and Workshops: Remote Sensing for a Changing Europe. Istanbul, Turkey 2-5 June 2008. Millpress: Rotterdam.
Wu, C., 2004. Normalized spectral mixture analysis for monitoring urban composition using ETM+ imagery. Remote Sens. Environ., 93, pp. 480-492.