SONDERDRUCK
AUSZeitsdlrift für
Geomorphologie Annals of Geomorphology-
Annales de GéomorphologieNeue Folge Band
13, 1969r}{efu
3, Seite267-2SG
Yerlag Gebrüder Borntraeger,1
Berlin-
7
StuttgartPrinted
in
GermanvSome enalyses
of
the COz
content of
the
air
in
five
Polish
ceves
by
C. Ex,
S.Gu.rvsre,
L.
Keszovsxr, A. Konxrccrr,
ï:,ï.
*"
,îil:].,
,
",",
"
Zusammenfassung. Analysen, angefertigt im April 7967
aû
der sdrlesisdren Hodrflâdre und in der westlidren Tatra, zeiger^ hâufig sehr geringe COz-Gehaltein
den Grotten, teilweise sogargeringer als der mittlere Gehalt der freien
Luft;
die geringsten §0erte sôeinenin
Kâltegebieten aufzutreten.Die in Sdrlesien untersuôte Grotte (330 m
NN)
zeigt wâhrend der Sdrneesdrmelze hôherenCO2-Anteil als die Grotten der Tatra (1OOO-12OOm
NN).
Die Ursadre dieses Untersdriedes ist zum einen wahrsdreinlidr abhângig von dem Nadrlassen der pflanzlidren Aktivitât mitzunehmen-der Hôhe (besonders im Frühlingsanfang), zum anderen aber audr davon, da8 bei der
Sdrnee-sdrmelze das §7asser, das
in
die Hohlrâume dringt, keine bemerkenswerten Mengen anco2
enthâlt' im Gegensatz zur allgemeinen Ansidrt-
und vielleidrt audr entgegen dem Normalfall. Es ist bekannt, dafl kâlteres '§ÿ'asser mehr COz aufnehmen kann als wâ.rmeresl aus dieserRclation darf aber nidrt allgemein gesdrlossen werden, da8 kaltes Klima oder ein rauher '§Tinter
Karst-fôrdernd sind. Unsere Analysen der Luft in den Grotten der Tatra weisen einen besonders
niedrigen COz-Gehalt nadr. Das COz war daher zur
Zeit
der Beobadrtungen, selbst bei erhôh-ten Lôsungskoeffizienerhôh-ten, nur in sehr geringer Menge verfügbar.Résumé. Des analyses faites en aÿri11967 sur le plateau de Silésie et dans les Tatras occiden-tales monrent des teneurs en COz fréquemment très faibles dans les grottes, parfois même plus
faibles que
la
teneur moyenne àl'air
libre; les chiffres les plus bas semblent en relation avec des milieux froids.La grotte étudiée en Silésie (alt. 330 m) a des teneurs plus élevées que les grottes étudiées
dans les Tatras (alt. 1000 à 1200 m), au moment de la fonte des neiges. La cause de cette diffé-rence réside probablement en partie dans
la
diminution avec l'altitude de l'activité végétalc(particulièrement au début du printemps), mais aussi dans le
fait
que, au moment de ta fontedes neiges, les eaux arrivant dans les cavités
n'y
dégagent pas de quantités notables de COz, contrairement à l'opinion généralement admise-
et peut-être contrairement au cas général.On sait que plus une eâu est froide, plus le coefficient de dissolution du CO2
y
est élevé;268
Er,
Gtr,rvsre, Kaszovsrr, Konvrrcrt, Or,rrsrxowe aod Org-sn:ôwxefavorisent forcément la karstification. Nos analyses ont en effet mis ea évi,l-.ce dans
l'air
des grortes de Tarra des teneurs en CO2 particulièrement modestes.I:
gzz czrbooijue, même avecun coefficient de dissolution élevé, n'était donc disponible eu m«>ætrt dcs observations qu'en
quantité très restreinte.
Streszczcnie. Analizy, wykonane w kwietniu 1967 roku na \flyiynic 3
§+Éi
i
TatradrZadtod-niô,
wykazaly, ite zasvartoSé CO2 s, powietrzu jaskiri jest czçsto bardzoEle.
Czasem jest onaniisza
ôd
(redniej zawartoSci COzw
wolnym powietrzu.Naj.ii-c
ÿen(Éci zdaj4 siç byézwi4zane ze 6rodowiskiem zimnym.
zawarto!é
coz
qr poï/ietizu jaskiri na(
sl4sku/
wysokoSé 33op
npo
I
jest-wyisza od zawartoici CO2
w
powiËtrzu jaskirî tatrzaÉskichw
czasie topnienir iDicgu/
vysoko§é1000-1200m npm l.Przyczyrr4tej r6inicy jest prawdopodobnie nie rylko spadc&
attfvnoici
I
szcze' gdlnie wc-zesn4 wiosn4/
io6lin wraz ze wzrosrem .!ÿysokoici npg., lecz-T. f.t, ie
w okresieiopnienia Snielu wydiielanie COz z w6d dostaj4cyô siç do j"rknô
ittt
nira-rzne. To ostatnie srwierdzenie jàrt sp.zecznez
ogilnq opini4 na ten temat'i
moir
byé nizAodDez
naiczçéciejobserwowanymi przypadkami. §tiadomo, L"
iÂ
niitt^ jest temperatura wody, tym wyizszy jest rspdlczTnnik tozp,tszal-noici COz; nie moiemy jednat na podstawie tej zaleinoSci wnioskoreé, 2c hardzo zimny
kli-mar, lub bardzo mrolna
iima
mrrsi sprzyjaé zjawiskom krasowym-V næy oaej
naszeana-lizy
wykazalyw
jaskiniadr tattzariskid, niewielkie zawaræici CO2v
povietrzu, co jestnie-*ip1;*i"
wfnikiem slabej aktywno6ci biologicznej roSlin, a wiçc bardzo niskiei produkcji COzlr'ri, ,"4li"i.
Gaz ten, mimo wysokiego wsp6lczynnika rozpuszczalnoici,v
okresieprzeprowad-ianydr badari wystgpowal w ograniczonydr ilo§ciadr.
It
is
in
a
caveof
the
SilesianUpland
and
in four
cavesof
thePolish Tatra
Mts thai
somefourty
analysesof
CÔzin air
were carriedout
betrseen the7
andrhe
12.4.67.
îhey
were vrofked
our
by
an
electrolytic
methodwith
a field
devicecon-trived
bÿ
H.
KoePn (1952)
and
recently
describedby
C.Er,
F.DErcoun
and F.VnrssrN
(1968).All
the'analÿtical
results arelisted
in-fine in
the tablesA to E
and
mostof
them areplotted
on thefigures
1to
3.[.
The caves investigatedA.
JashiniaDzwonnica
1.
Thecaoeis
locatedat
Olsztyn
(Eastof
Czçstochowa),in
thenorthern-Part
of
the SilesianUpland.
some 330m
above sea-level.The
cave is anarrow
and simplegallery,
abouiT0In
long,
with
few
drambers andveryfew
late'll
passages;.alot
àf
splêndid moonmilk
côrrers thewalls. This
cave is abrandr
of
thelarger
Tow-arri;Cave
Systemwhic}
honeycombs oneof
the residualhills of
Upper
Jurassicmassive limestone.
2.
Meteorological
conditions. During the
analyses,the weather was
rainy-; theair
æmperatureoutside
vÿas 60C at
1m
height;
at
4m
insideand
30cm
abovethe
floôr
of
the
descending entrancegallery,
the
temperaturewas
only
4.5oC;
Some analyses of the COz content of the air in five Polish caves 269 j
(,
rq -ô o (ü d d èo ê. E dÈ
E d o oo
Q ÿ 14 Ua
}1 H jo
ô
x
! o ôo È.\ É9 o6 Jd o; '+ .9N9v
ÉEl N.oo
d9 '_E s HE -Va -.: ! æv lL6 êThe
temperatureat the
very
endof
the
cave vras
measured
the
18.4.67:
7
30 C.
These figures shosrthat cold air
v/as entering
along
thelower
part of
the gallery, and caveair
was goingout
alohg theceiling (normal vrinter
air
circulation
in
this type
of
caves: seefig.
1).3.
Tbe CO,
gradients.
Fig.
1clear-ly
shows thehorizontal gradient
ofCOr;
this
gas
is
more
and
more
abundanrtoward
the endof
thecave,rangingfrom
0.41to
2.47mg CO2/l air.
'
In
the
bulk
of
the
cave, rhe
meanvalues is between
1
and, 2mgll.
The
values
seemto
lower
in
the biggestd:amber
of
the
cave. Moreover
the
values are higher
in
the
upper
part
of
thegallery
thai
nearby thefioor.
this
is
dueto
the
winter air circulation, srill
prevailing
in
the caveinApril
1967tcold
air
entering_below
is
coming
from
the free atmosphere,at
a moment where theplants
activity
isvery
reduced.Air
stag-nant
nearby the ceiling is
sincea
longértime in
the
cave,and
probably
enrichld
in
CO2
by
fissuresin-the
cave
ceiling,going
up to
the soil and
its
confined ai-mosphere,and
by
which
water
is
perco-lating.
Another
possible causeof
gradientv/as
suggesredby
Prof.Z. Czrppr:
the escapeof
CO,
correlative
to
the
forma-tion
of
moonmilk. This
is very
likely.
but,
being unaware
of
the quântity ôf
moonmilk produced
by
timè
unir,
wecannot
appreciatethe importance
of
the releasingof
CO, by
this
means (seeA.
MesoN-§flrureus, 1959); particularly,
we
are ignorant
of
the
respective
in-fluences
of
a
physical
escapeof
CO, in
the atmosphereof
the caveby
precipita-tion
of
the mineral
particles,
and
of
abiological
releasing dueto
theactivity of
microorganisms.
Anyway
these
factorswould explain
the
differences
bet.weenthe
CO,
contentsin
the narrow
gallery
andin
the rather
open space constituted270
Er,
Gruvsre, Keszowsxr,Korvrrcrr,
OlersvNovl and Or,ersvx6§/r.1,{by
the
dramber,
where
the
samplings
where done
farther
asray
from
thewalls.
The minimum
values observed(0.46 and
0.41mg/l)
are
a
litde
below
thenormal
valuesfor
openair
(0.50to
0.59mgll). The
accuracyof
the
device used hereis
0.05mg/l, and
it
is
likely
that we really
have
here,at
the
end
of
thewinter, two
very
low
values. Onewill
noticethat
these are between the entrance and anarrow
passageto
Towarnia
Cave.B.
JaskiniaWodna
pod. Pisan41.
The
caaeis
located
in
the talweg
of
the
Ko6cieliska
Valley,
in
the
Polish '§ÿ'esternTatra at
some1000m
above sea-level.Only
the region
of outlet of
the cave is here concerned.It
is
alabyrinthian
systemof narrow
galleries, generallylowroofed
(in
many
places lessthan 1.5m).
An
underground
river flows
in
the cave andmany
little
tributaries or
derivationsrun over
thefloors
of
the passages;also
lie
there bodiesof
standing \ilater.
No
concretionsat
all
areto
be seen,but
river
pebbles, sandand silt.
2.
Meteorological
conditions.
All
analyseshere
were
done
by
fine
weather,during a
period
of
fast
melting
of
the
snow;
during the night
when
analyses 1and
2weie
carried
out,
avery
cold
wind
wasblowing in
the
valley;
thetempe-rature
of
thewater
was 3.5oC;
the analyses 3to
8 were doneduring
a sunny day,by
lukewarm wind.
The
disdrargeof
the Ko6cieliski
River
wasabout
1000l/sec,while
theyield
of
the underground
derivation
was
some 300 l/secat
the
outlet
of
the
cave (seefig.2).
3.
Low
CO,
content abooe tbewater.
AnalysesI
and 2,during
thenight, at
theoutlet
of
the
underground
river,
show
a very low CO,
content.
These analyses were doneatZakopane,.two
hours.after sampling. sothat
a-n effectof
temperature on reaction rate cannot be assumed. Thevalue
of
0.43(twice)
is approximatebut
a\yway the true value is
of
coursebelow normal
atmospheric content.
At
thecontrary,
analyse3
madethe
next day in
openair
showsduring the
day a
ÿery
normal valuefor
free atmosphere: 0.56.One analysis shows,
like
it
was observed atmany
other places, aCO,
contenr higherin
afisiure
(3.40j than
in
thebulk of
theair of
th"."rr..
Measures 5
to
9 wereall
performed just
above thewarer.
Sample n0 8, abovea
pound
with
putrescentwood floating on
standing water,
showi a
rather
high value (2.04).All
the other analysesdisplay low valuei:
between 0.67 and 1.11..One could
expectthat
an
important water
flow
sweepsalong,
with
itself,
anair
current
comingfrom
the mosr remote partsof
the cavè andrid, in
CO2;or
at
leastthat
animpoirtant
flow
comingfrom
remote underground regions cairies solved gases whichiend
to
escape when" the srream arrives in" theoperiparts
of
the cave.But
in
this caseit
is not so: rhe contentof CO,
above thewatèr
israther low,
and,by night,
very faint.
Some analyses of the COz content of the air in 6ve Polish caves 271
zyÉs kiego
50h.
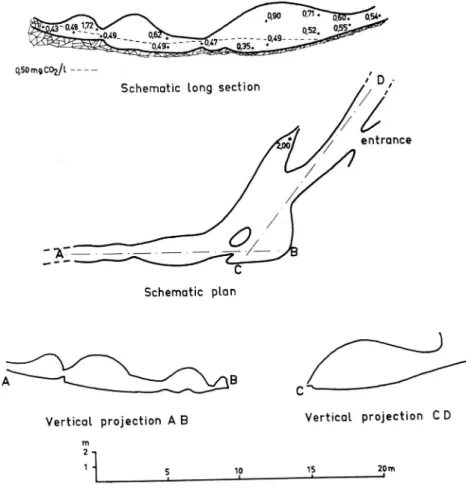
Ég.2
Fragment of the plan of Jaskinia Vodna pod Pisan4 after Sr. ZwouÉsrI. lV podziemiadrrtzaislich,
1961, slightly modified. COs contentof
the air (mg/l), sampling and analyses byÂ-Korrucrr
Er C. Ex. 11. and 12.4.1967C-
lshin;a
Nad.Raptaaich4I
,- Tb
caoeis
at
an altitude
of
some 1200m, on the
west
sideof
Ko(cieliska
Yallry-It
is
asmall
cave, some 24m
longt
ashort gallery
leadsto
arather
spacious.r--rl'cr,
vhiô
in turn
is continued
by
another
passage,rather
narrow.
In
fact,
ùc
æance
leadsnot only to
the
mapped cavebut
alsoto
another
part
of
the GrrG,oposite
(seefig.
3, the sdrematicplan,
up right).
Consideringthat
thetwo
tEgicn
of
the
cave are connectedby an
entrancewidely
opento
outside272
Er,
Grr-rwsre, Klszovsrr, Konttrcxr, Or-nxsvNovl and OlBxsvN6wxerock debris.
A
small snow
patdl,
blowed
by
the
wind,
remainedin
the
entrance passage and some ice stalagmites w'ere observedin
the same Passage'2.
Meteorological cond.iti.ons.
The
weatiher was.fine during
analysesand
the*o* *6
meÏting fast.
But, after
sunset,the
wind
wasvery
cold.
Temperature outsidevaried
frim
tOoC
(analyse 1)down
to- 50 C(analysi.16)'
.In
the
caveitself,
waær was dropping
from the root rn rather
lmPo1tantorrrrriirr
this
wasverv
probably
relatôd-to
snowmelt,
as was also thethich
fogJtouainâ'rt. verv end'oi
the
cave.The air
wasblowing
outside,what
is normalil;T#r;;;i*.'ioif,ir
cave,whidr
isat
the upperpart of
a complex system: theair is
warmËr
in
rhe
caverhan ou$ide
and
escapesthus
upsidefrom
the
cave;,D,
Schemotic long section
Schemotic pton entronce
Verticot
Projection
C D//
VerticoI projection
A B m 2 1Fig. 3. Fragment of Jaskinia nad Raptawi.l.a_I by A.
Kosttscrt. coz
content of the air-(mÿl).-s"iiiiie-irJ
Some analyses of the COz content of the air in five Polish caves 273 being cooled
in
the openpart
of
the cave, theair
becomes then supersaturatedwith
vaterr
and
fog
aPP€ars.3.
Stratit'ication
ot'COr.
CO,
content corresponds, nearby the entrance,to
nor-mal openair
values.Farlher
on, nearby theroof,
values areslightly
higher.At
thecontrâry,
near
the
floor,
and
particularly
in
the
lowest Points,
the
air
is
very
unusuallv poor
in
CO".
NeirÉy
the
roof,-CO,
ismore and more
abur,dantwhen
one-goesfrom
the entrance to-theextremity. On
thefloor,
this gradient
doesnot
clearly
apPear.Sixteen measurements s/ere
carried
out
in
the
cave, oneof
them beingin
afissure and
fifteen
in
thebulk of
themain
passage.This
numberof
analyses madeit
possibleto
calculatethe
corrclation (r)
between theheight
(x)
abovethe
floor
anâ the
CO,
content
(y)
of
the
air
following
the formula:
2'xv
'
(»'*'.»'t"12
1,0 ,,6rI
1,2 1r0 q8 0.6 0.1 q2 mgC02/t 2p qo Fig. a0,2 0,4 0,6
0,8(1!
considéring
15 points ; (2)considering
11ponts;
1,0 13 lF
1,6y=
0.{69+
0.256xy=
0109f
0 229 x 1,820m
274
Er,
Guvsre,
Keszovsrr, Kosxrrcxl, OI-Ersvrqove and Or.rrsvNôwNeThe
result,r
:
0.419, meansthat
theprobability of
acorrelation
betweenx
andy
is somewhat lessthat
90 0/o (seefig. 4,
line
n01).
It
is
easyto
seethat
thepoint
whosey
is
equalto
1.72is
quite
abnormal.
'§(edon't know
if
the
causeof
thisis an
error or
another
factor than
the height acting
here.Flowever,
if
we
rejectthis point,
r
becomesequal
to
0.959,
and the
non-existenceof
the
correlation
becomespractically
impossible (seefig.4,
line
n0 2).The
CO2 content higher near theroof
than
near the ground showsthat
there is no static densityequilibrium
(CO,
is denserthan air). The
observeddistribution
of
values
can be related either
with
temperature,
or with air
blow,
or
with
humidity.
Temperature.' the
values
below
0.50mg are
observedonly
in
a
possibly stagnant,cold
air
masslying on
the
floor, in
the
bottom
of
this
U-shaped hole. rJÿarmerair coming from
insideparts
of
the
cavernous systemwould bring
near theceiling
anair ridrer in
COr.
Wind:
a draught blows
in
the narrow
passagesof
the
cave.
It
confirmsthat
the
cave isblowing air
outside (hencehigher
values nearthe roof).
Hunidity, roater:
when the
water drops from the ceiling,
it
is
warmer
than the lower
air
layer
of
the cavel
the
splash
on
the
floor
divides
these"'warm€r" drops
into
a
great number
of
small droplets, forming
a
mist;
thedroplets
having a yery
small diameter,
the
escapeof
the air
and
its CO, from
the
water is
mudr
easierthan from big
drops;
beingwarmer than the air
layer
nearthe
floor,
the
air
rich
in
CO2
escapingin
the
splash zone risestoward
theceiling.
This
thermic explanation
of
the
CO,
bedding
in
the
cavewas
proposedby
T.
Nrrolvrcol..
This
hypothesis supposesthat
a differenceof
probably
4to
60C
issufficient
to
inducea
rapid
riseof
the
gas escapingtoward
the ceiling.
If
this
rising is not
rapid,
the gaswill
become colder andwill
stay below.Moreover,
thehigh
densityof-CO,
leaâs usto
supposethat
it
is escapingïith-and
within-ihe
air
freviouslÿ
solvedin
the splashingdrops:
CO,
considered alone isnormally
tooheàvy
to
rise above anair
even4 to
60C
colder than CO".
But
oneof
us(4.
K.)
proposesto
assunftthat
the
turbulenceof
the
atmos-pherein
the
splash zone, becauseof
the abundant dropping
of
water,
expelsthe
air
richin CO,
escapingfrom
thewarer:
the splashitself
puihesair
masses above;this
assumptionwould probably help
to
admit
the proposal
of
T.
NrcoÉwrcor.. The ideas here presented arequalitatively
concordantwith
the resultsof
B.DrxoN
Ec
A.
Russrl
(1950),
B.DrxoN
6r
G.HeNos
(1957) and also
with
experimentsby H. Roqurs
(1964).D.
Jaskinia
Rapaaicka
1.
The cdve isat
lL70 m,
on the west sideof
the Ko6cieliskaValley.
It
is an aaenof
some10m
depth,widely
open, andcontinued
at its
bottom
by
some spacious drambers.2.
Meteorologicalcond.itions.
Concerning meteorological conditions, see Jaskinia-Some analyses of the COz content of the air in 6ve Polish
caves
2753.
COzin
thebottom
ot' theaoen.
Three samples weretaken at
man'sheight
in
threepoints
of
the
cave.The
observedgradient
is
concordant Lÿith
the
relative
aldtuâe
of
the
three
points; just
under
the aven: 0.37;
in
a üamter
r1ea1by,a
üttle higher:
0.47;
at
the
extremity
of
another passagenearby,
a
little
below:
O;32.This
avenprobably
collectscold
atmosphericair only,
exclusiveof
any-soil
air, at
theplacei
here sàmpled;it
iswidely
open, and the samples werenot
takenin
confineâ
places.The
vàlues hereobtaineil are the
smallestever
found
by
usand
it
is
woithy to
notethat
the lowest
layers are here also the poorestin
COr,
contrarily to
a gradientof gravity of CO,
whidr
is denserthan air.
E. Jaskinia
Obhzkowa
1.
The
cave islying
on the
western sideof
the
KoicielskaYalley at
an altitude
of
about
ll20 À.
This
caveis mostly horizontal, rather
complex,
but the two
samples were
taken nearby the
spacious entrance, where some ice stalagmites and icefloors
wereslowly melting.
2.
Meteorological
conditions. About
the weather,seeJaskinia nadRaptawidr4I;
theair
temperature was, outside, about 90 C.3.
COzin air
just nearby melting
ice.
0.94mg
COrll
air were
found at
20 qn abovean ice
patdr on
the soil
in
the
entrance dramber,but
0.46mg/l only
in
anatural
nidre
in
an ice stalagmite.The
electrolytic cell having displayed
the last r_esult,rather
low,
wasimmediately
testedin
theouter
atmospherè andprovided
there a resultof
0.49mgll,
whidr
isvery normal at this altitude.
Flowever
the measurements are mudrtoo
few
onthis
subiect, we can assumethat
the slow
melt
of
the ice
stalagmitedid
not furnish
any
measurableCO,
to
theconfined
atmosphereof
the nidre.II.
Comments on the results1.
Problems related,to altitude and to
atmospheric pressilreAtmospheric
pressure 'decreaseswhen
altitude
increases sothar
ar
1OOOto
1200m
it
is equalto
some9ll0
of
the pressureat
seelevel.
So,if
partial
pressureof
CO2
is
constant, the
weight
of
CO2
by
liter
of air
normally
decreasesfrom
059mg/l
(760mmHg,
0oC)
or
0.55mg/l (760,mmHg,
20oC)
to
0.53mg/l
(680 mmHg,
OoC) or
0.55mg/l
(680 mm Ffg, 20oC). Moreover
thefield
deviceemployed can
suffer an error
of
-+ o.osmg/I.
One
can seethat
the
influenceof
the decreasing pressure cannorexplain by
itself
the
lowest values here mentioned.The
decreaseof
CO2
partial
pre-ssurein
atmospherear
increasing altitudes,following
P.N.
Tvrrnsrol
(1962)
is herenegligible
(0.0290/ovol. at
21Km
alt.,
against 0.033 0/ovol.
at
see level).One
could
assessthat we
should reduceoyr
figuresfrom mg/l
ro
correspond-ing
partial
pressure.But
this
is contrary
to
the
general purposèof
this
researdr, X, Z€itsôrift für Geomorphologie N. F. Bd. 13, Heft 3276
Er,
Gu,rvsre, Klszovsrr, Kontlncxr, Or,rrsxNova and Or-rrsvN6wNawhidr
is
concernedwith
the action
of
COs on
limestone;
to
dissolve
a
givenvolume
of
limesto,newe
needa definite
@ei.gbtof
CO2.2.
Problernsrelated
to
teût?erature and.to
oegetationThe
observedvalues's/ere
sometimes(A
1
and2,
B
1
and
2,C
9 and
15,D7
and3)
lower
than
atmosphericnormal
values.'§flehad never
seen such casesin
Belgiuil.
Of
course,*easü..*ents
in
Poland
srere madeat a
moment
where ,,.getaTionis
still
very
litde
active.
This
doesnot explain
at all
values below atmospheric valuesknown.
Àfter
these analyses,and
considering
10
that
temperature-variations
are neutralizedin
theeleciric circuit
of
thedeviie by
adiode,
and 2othat
temperatureinfluence
in
the
cells wasanyway
impossiblefor
measures B 1and
2,
madein
a bousein
Zakopane,it
seemsihat'CO,
partial
pressurein
the
atmosphere is muchlower
in
the mbuntainous area investigatedthan
generallyadmitted.
This
idea seems usto
becontrary to
S. §ÿ. Tnor,,rp's assumPtion(1963): "The
great
constancy
of
CO,
content
of
the
atmosphere
was
demonstrated by
CenprNrrcn
in
7937"and
to
the gencralopinion.
The values below
normal
ope-n-atmosphere value have been observed:a) in
thecold
(5oC)
descendingnarrow
gallery
of
the
encranceof
Dzwonnica;
b)
at
theoutlet
of
\ürodna pod Pisan4river,
during
thenight
only;
.j
lurt
at
the
floor
level
of
the
lowestpoint
of
Nad
Raptawid<4
I,
probably
'
in
the
coldest place
of
this
cave,
and
at
the
very
end
of
the
same cave,in
the
fog;
d)
in.the
*ide
spacetof
Raptawid<a,whidr
seemsto
be a
trap
for
cold
mon-talnous
arr.The only
commonpoint that
is
conspicuousto
these places seemsto
below
temperature.^
The fog at
thevery
endof Nad
Raptawick4
I
shows another dangerfor
thesampling:
aEsorptionof HrO in
the cell(remark-of
A. K.).
However,
at
+
50 C, theieigit
of wàt". in
air
ât
100 0/ohumidity
is some ZÂell.
This_ content seemsto
beqüite
negligible
asa
causeof
error
in
the
electrolysis.But this
problem
isto
be
kept
in
mind.
OnJ
will
noricerhar
in
Raptawid<athe gradient
of CO,
isnot
relatedto
itsdensity.
But
as
very probably-there is
a
dàsity
gradient
of air
masses there,the
coidest masses beinebelo;-,
it
is
possiblethai
tIe
observedgradient
in CO,
is
simply
showing
that-the
colder is ihe air,.the.less-there is
Ç9a
il
it;
for-sudr
,n
,.r6aian..d
staleto
stay,CO,
must theredisplay
almostno diffusion at all.
The
highest values(2 mgll
andmore)
were observed:-
oncenearby
the
ceiling and
onceat the extremity
of
Dzwonnica (A 6
and 10);-
inï
narrow
fissureat
§7odnapod
Pisan4 (B 4) and above abody
of
standingwater
with
putrescent matters (B 8);-
in
a fissurein Nad Raptawid<4I
(C
16).The
fissures seemridrer in
CO2;
consideringthe
measures donein
Belgium,this
is probably
here alsorelated
wiïh
arrival
o[
biogenic(pedologic)
CO,
from
the
vegetal
soil.Some analyses of the CO2 content of the air in five Polish caves 277
The
contentof
COz nearby the ceiling isprobably
relatedwith
thefact
that
in winter-time
the
air of
the
cave,ridrer in COr,
is warmer than the
outsideair
whidr is
thus
denser.3.
Cornparison ot'tbe
CO,
contents ot'air
and
zaater-
Some analysesof
rhe
CO,
content
of
the
streams werecarried
out
by two
of
us (K.
Or
and B.O.)
during-our stay
in Tatra
Mts.__
.
F1y.
of
the
analyses conèern warersof
the
Koicieliski
Basin:
a
spring
nearHala
Pisan4displayed
4.omgCOr/l water
and a
tributary,
the
Krak6ï
SIream, c_ontain-ed 6.2mg COrll;
the Ko6cieliski
River itself,
aswell
underground
as onthe
surfaceiust upward and downward
of
the Cave'§flodna pod Piian4,
showed3.1mg
Corfl.
The twin-tube outlet of Jaskinia Vodna pod Pisan4
Since
the
three
last
measurementsgave equal results,
it
is
likely
that
the underground course isnot
long enoughto
drange theCO,
contentof
the stream-at leastin
April
7967.However,
the value
of
the
CO,
contents
in
the
air
whidr
would be
in
equilibrium
with
the
determined
quantity
of
CO2
in
the water
of
Kodcieliski Stream, should,be
some 2mg CO2ll on the
baseof
calculations.
This
closely correspondsto
theCO,
contentthat we found just
nearby the surfaceof
stagnantwater
with
decaying vegetal
marrer
(B8:
2.04mg/l);
one
can
also
notice that
this
value
is just
intermediate between
a
measurementin
a
fissureof
the
cave @4:
3.40mg/l) and
another
measuremenrin
the
cave,
abovethe
subrerranean,r.""-
278
Ex, GnEwsx-L, Keszowsxr, Kor:r.ecrr,Or-xsrrcvr
eadOr.ssrÉvrr
In
the Table
I
the empirical
data
for
COr and
C:++
cor-ruetioms
are comparedto
thesetheoretically
calculatedfor
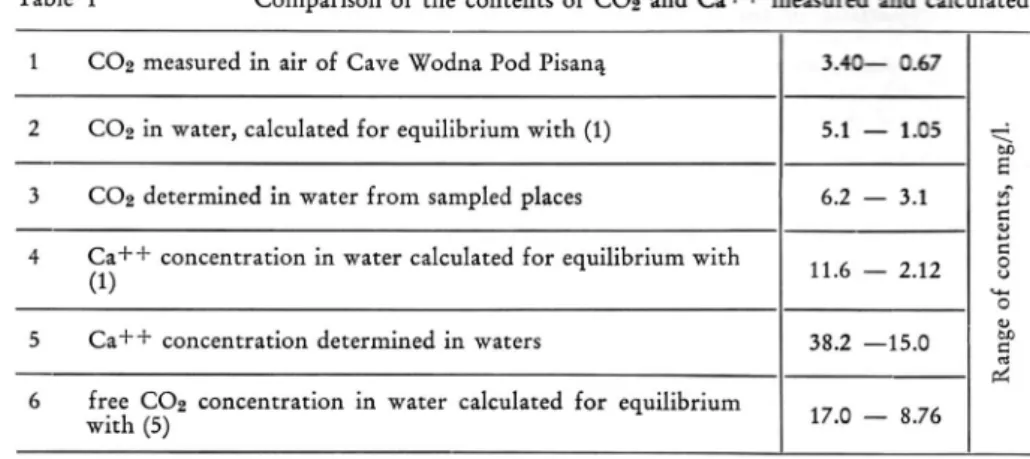
assumedequilib,ria-Table I Comparison of the contents of COe aad C.e++ measurcd eod cdculated COz measured in air of Cave §fiodna Pod Pisan4
3-10-
OS7& E E a o I o èD &
2 CO2 in water, calculated for equilibrium with (1)
s.l
-
1.053 COz determined in water from sampled places 6.2
-
3.t4
Ca++ concentration in water calculated for equilibrium with(1) 11.6 2.12
5 Ca*.F concentration determined in waters 38.2 -15.0
6
free COs concentrâtionin
water calculatedfor
equilibriumwith (5) l7.o
-
8.76On
the
baseof
Table1 (1, 2, 3)
it
may
be seenthat
the
conrenrsof
CO2determined
in
water are
in
general
slighrly higher
than
those calculated
foi
equilibrium
.with
-the
Pco2 measuredin
the
cave
air.
Thus,
it
seems plausiblethat the
valuesof
CO,
concentrations observedin
the river
arethe
residuesof
CO,
dissolvedat
highe? Pco2in
the
deeperparts
of
undergroundkarst ways
ia
contacrwith
theriver
bed.It
would
be possible,if
the gas dissolvedüere
hàd no time-to equilihrate
with
Pco2in
free
air.
The
reasonof
this slow
equiübration
could
bethe formation
of
hydrates CO2. nH2O
whi&
could
bekinûof
orraps"for
the
moleculesof
CO2.-
In
addition,
we
cannot
excludethe possibiliry
that
üe
facær
of
rclubiliry
of
ÇO,
in
a dynamic
system(flowing wàter) may
be
a
little
high.r than thJt
used
commonly
for
astatic
system.The
five
iamplesof waier
analysedin
the Ko6cieliski Basinvere
-like
mostof
the
'$/atersstudied
in
neighbouring
valleys-
oversaured
wiü
calcium
bicar-bonatewith
regardto
Pco2measuredln
air.-The
oversaturation may be explainedin
tv/o
srays:1) Ca++
ions -dissolvedin
waters being equilibrated
viü
hiÉcr
Pco,
in
the deeperparts
of karst
ways.The Ca++
concenrrarionin
vas
oqurl'braæd there doesnot
d-ecre-ase(or
no-ttoo mudr)
in
spiteof sm"ll
Po,
io
ûe
sampled places.It
is
possible becauseof
the very
complicated and
sloroquilibrium-
proiess
of
the system:Ç"Ç9,
-
C9r:
Hzô.
Thifprocess probably
indrd€s
'''âny
srages._
^!t
is probable tha-tin
this unequilibiium
staleüe
proccssof
precipitation
of
ÇaCO,
goes-slower
than_that
of
?trapping"
of
CO2-Eotcotcs'into
hydrates,formation
of HCO,
and
dissolutionof CaCôr.
Some analyses of the COe content of the air in 6ve Polish
caves
279If
the
aboveexplanation were
true
we could have
someinformation
aboutp*"î;il;;-.;;b.'.a
p"r"
"f
the
cave.system(mainly
fissures). Pco2could
be."liirl"t.d
from ihe
meâzuredCa++
concentration'b)
The Pcooover the
sampledwater
Y/as neyer as high as calculatedon
the base"f
fàiîrË'rtg
Ê.-or-j
À'{logCa++.-pH,
where
Ça++ an{
pH
are measured
;;;l*i;;ii;.
Iir.
Èi;
quantiry
o"fc.**
côulâ be,in
the case,disiolved
bv
flosring;;;r"Ë;;i;"
"i
.àir-i"r"us'collecdng
of
CO,
from
the
cave and outsideair,
orirâ*
.[.-r"ii-""d
;;g#; -r*
U.iri'se
coftact
with
the
bedof
the
river.
of
i,"îir",îh.
li"*-"q"i'fiU.".io"
pr**t"and
unequilibrium
state mentionedin
(a),plays
thesr-e
role
in
thecase-'--'-Tilir opi"o.ào"
is
in
agreement.with A1gg,x's
statement (1.956): "'§ÿ'atets.orroi"îgîr.. .t"i
l{zi"^g
Ca++ per .liter
should
be
unstable
as Pco2.in;;;ôh"?.î,
;;1,"*, br;it"
i""r
q1i..
in natural
conditions
arepractically
stable-containing60-80
mgCa+'
per
liter-It
is oossible becauseof:
r)
.;i;;;;;;;;iàG
oico,
by- decav-ingorganic
matter
and2)
slownessof
tÉeequilibratiott proc.si including
absorption andhydration:
COr=CO2+HrO=HrCOt
atmosphere water
The decision
whidr
of
the medranisms is moretrue:
(a)
or
(b),
requiresmany
new
observations and measurements.'*"
ô;;;t"i.à tl. f"Àtla:
Pco2=
A
+.logclll:t1t'
§/e
must
admit
that
it i, iÀ.
for
üaters
containing
oïly
Cr+*
ànd HCO3
_ ions, _whilein
Tatra
noticeable
quantities
of
Mg++ ànd
SOa--
ions are
found
(seeOmrsvNove
EcKouonNrcrr,
1965
e.g.).---
Th;
;#l"ri*r
oi'this
comparisonof
someair
analyses andwater
analysesalei
1o)
that
the concentration
rangeof
CO2 determinedin water of
the Kodcieliski- '
Sir.r*lsin
approximrt.
igrr.*.tt
with
the
quantities measuredin
the air
of
Cave
§ÿodnapod
Pisan4;20)
that
rhewaters
"r.
orr.rrrtirated with
Ca(HCOs)z either
becauseof
higher'
partial
pressureof
CO, in
deeperparts
of
kars.!ways
o1qf^a
cave system'àrï..",ir.
of
conrinuou's.orrt"Ët
and gradual collectingof COr,
usedfarther
f;;ai;r;1;i"g
C"ôO,
by flowing,
un"equilibrated(inihe
static
senseof
theword)
water.
4.
Comparathte
resultsin
BelgiumFie.6
shows
an
example
of
a
Belgian cave
of a
type similar
to
cavesOr*o"ii."
""J
N"J Rrpt"ïid.a
I:
a
subhorizontal
cave,'iith
-one practicable*i.rn..
and
a
slightly
^U+hapà profile
allowing. gas accumulation
near
thebottom.
TheprofilJis
here accompaniedby
the rela_tive temPeratufesurvey.
,
A
former
paper
(C.Er,
F.Drmcoun
Er F. \flrtssrN,_ 1968)àas
shownthat
the
values obse^rvedià
Belgium,
during
the months
of
May
to
July,
were
2
to
Er,
Grl,rwsr.e, Klszowsxr, KonrlEcxr, Or,rrsyxowe and Or.rrsrx6wr.l, Ê e U! ie= ts -E* oi--9o 2Êd Uâ
aoooo
o ô o <a oà z6 o -NFoià
< .aÉ5a
{3t
.i ê o o o ôo É o o d a o e ! o EI o (ls
oo
r; ào lr ! 9e=Ë
ÉR
ÊFÉ.'
ô.
<l:-<È
< .o
2,3
Ë{8t
ê P e aE(-Some analyses of ôÊ
Cq
æatent of the air in five Polishcaves
281{
;mes higher than
tüc
correspoding
values (center
of a
clamber;
narrow
fissure . ..)
in
Poland-In
Bélgium wereobsred
sûmeverrical
gradientsof
CQ,
content.
It
seemsthat
in
theümpled
placcsin
Poland, there is sometimes agradient,
and sometimesno
grddient
of-CO,
(et
ùe
r-le
of
sampling),
but
in
facr,
dit't'erent -air -layers"'hich
do
nss
mi'f
ùÉæt-orÊ,a
more
delailed survey
would probably
show
arepartition of
aï
rus*s rithout -or
with
very
thin-
transitions.This
observation is alsoprobably
rrdatedrith
thelow
temperatureduring
meâsurements.Hôwever-fcr
are
the
analyseq
they
unquestionably
provide an
interestingstatement:
CO.
ras
in
April
1967n
the
investigated area much
lessthan
in
surnmer 1966Â
Belgra" caies, and
also lessthan
in
aBelgian
caveat
the
endof
Mardr
1967 (theselast resuls yer
unpublished).Since these caves
diffr
bv their
aldrudes, and
the
analysesby
the
seasonwhen they were carried
out,-
the
differences
in
CO2 content
seemstrongly
correiative
with
the
differencesof
vegetation;
seefig.5.
Scnonurt
(1950) noticed
in
spring
ruatersa
gradient
of
CO, very
similar
to the one we noticein
cavesair: a
general decreaseof
CO2 whenaltitude
increasesand
temperature
lowers; he thought the
lesseningof
biological
activity to
be responsiblefor
this.Temporary
Conclusionsl.
Our
41. analyseshave
of
courseno
statistical significance
for
the
areasinvestigated.
They
were
only
intended
to
providg
a
comparisonof
some cavesof
the-Tatra Mts-during
the period
of
snowmelting
with
a caveof
the
SilesianUpland
at rhe samemo;ent,
ând alsowith
-someformer
analysesin
Belgian caves.'
But
the
measurementsalso displayed
somegeneral results
interesting
by
themselves.
'While
two
measurmentswere
done outside
of
the
cavesfor
dred<ing the device (0.49 and 0.56 mgCOr/l air),
36 analyses were carriedout
in
unde,rground galleries and drambers,[iving
results.rangingfrom
0.32to
2.06 mgll1'3titrations
in
fissures displayed 2.00to
3.40 mg/I.2.
It
will
bekept
in
mind,
in all following
statements, thatthis
small numberof
analysesprevent;us from
general conclusions andallows
only particular
con-clusions and general assumptions.If
moreCO, titrations
are necessary,iî
varioustypes
of *eaiher particulaily,
we
alsonoticed
during our
analysesthe
necessityoî d.tailed
thermiè, barometric
andhygrometric data:
a comPlete meteorological surveyof
thc
cavesmrdied
would
provide
usefulinformations.
3.
Among our local
conclusions,we can
state
that we found
very
small amountsof
CÔ,
in
the
caves investigated,and
sometimes lessthan
in
a
normalfree
atmæphetciTtre lôvesr
Frgura
vere
obtained
in
the bottom
of
the
aven
Raptawicka,while
a
verr
los
CO,
conænt
was
also
found
in
the lowest (and
also very
probably
coldesr)place
of
JasLinia nad
Raptawicla
I.
§7odna
pod
Pisan4dis-played
minimnnr valucs
during the night.
CO2
was surprisingly
not
abundant above theundergromd
river of
this cave.At
Oblazkowa,
theair
in
the immediate282
Ex, Gu.rwsr,t, K.rszovsrr, Kon*rrcrr, OlsrsyNow.l and Or,rrsvxôwre(J
old
É,D
F
É
lrJo-=
lrJF
g
C'I Eg
lrJ J-F llo
z
trl
z
o
c,
(\ao
(.,Some aaalscs of tlre CO2 content of the air in 6ve Polish
caves
283vicinity of
ice formations
diqplayed once a moderateand
oncea
Yeryfaint CO,
content.4.
Iaskinia Dzronnica,
in
the
Silesian
Upland,
§/as
rather rich
in
CO2,if
compâredto
rhe
cavesinvestigated
in
Tatra Mts.
In
the
Tatra,
'Wodna
pod Pisana. 1n sf,sthalweg
of
theKoicieliski
River,
displays contentshigher than
the caves iocaæd athighà
levels on the sideof
theValley.
5.
As awhole,
the figures obtainedin
April
in
some Polish caves werelower
than the
resultsof
investigations
in
Belgian caves(fig.6). Most
of
the
measuresin
Belsium
wherecarried
6ut from May
to
July
1966;but
sometitrations
madein
Maidr
1967 furnished also figures higherthan Polish
ones.Belgian caves concerned are
lying
at100
to250m
above sea-level;Dzwonnicain
the SiiesianUpland
is situated,i
soir.
330 m, while theTatra
caves investigated areat
altitudes ranging
from
1000to
1200m.Belgian
""rr.t
"rt"under
woods
(coniferous
and
deciduous)and
pastures;Dzwonn-ica
is
lying
under poor
pastures;
Tatra
caveshere
concernedare
in
coniferous
forests,*in
great-part
-under
melting
snosr
at
the
moment
of
in-vestigation.6. \flhile
the rangeof
values islarger
in
Belgium (upto
4.1mg/l-in
galleries,up
to
10
in
fissures),1he gradients seemto
be moremoderatein
Belgian
caves;the
clangesof
content are
observedon
sosmall
distancesin
somePolish
cavesthat
it
would probably
be more accurateto
speak aboutdifferent air
layers whichdo
not
mix;
i
detailed survey
would probably
show
a repartition
of
air
masseswithout
-or
with
very
thin-
transitions.
This
is
very
likely
to,be
related
with
thelow
temperatureduring
the Polishinvestigations;
s/e assumethat
cold vreatherstrongly
restrainsthe
diffusion.
7.
It
seemsworthy to
notethat at low
temperature,in
the mountain-,at
the endof
the
winter,
*e
have undoubtedly
found
contentsof
CO, lower
than
the 3/1oOOoadmitted
to
bea world
meanvalue.
This
is
fully
contradictory to
theopinion of
'§7'.Tnour
(1963) and,probably, to
thevery
generalopinion that
CO,
nèarbythe
surfaceof
theearth
has arather
constantminimum value,
in
natural
environment,
all
the exceptionsknown
beinghigher (very
dense forest, Putrescent aggregates . . .).8.
Snow isvery
generally considered as aridr
reservoirof COr.
The measure-ments doneduring-a
very
typ.icalperiod
of
snowmelt
show
that
the
escapgof
CO, from
the
snowis
in
thii
case,in
aregional
scope,not
the
sourceof
a
highCO,
contentin
theair of
the cavesof
the area where snow is melting.9.
Anyway,
it
iswell
known
that
it
isuniustifiable
to
deduce apriori.f.rom
thislaw
that
alow
temperanrrefavours karstification,
because the amountof CO,
solvedin
water
dependsupon the
partial
pressureof
CO, in
the
air
and
in
the present case,this
pressure(ako
if
ône considersthe
influenceof
the altitude)
isvery
'
low in
thePolish
caves investigatedby
cold weather.'§0e
suppose
that
themain
causéof
this
is thevery
poor
vegetalactivity, but
theproblemls
probably
more complex and seemsto
usto
be correlated alsowith
the
presenceof
sno*
or
ice, and involves
influencesof
different
meteorological factors.284
Ex, Grr,rwsre, K.e.szovsrr, Konvrucrr, OlrxsyNowe and Or,xsyn6wNe AbnoaiedgementsThis
work
sras realized thanksto
acultural
accord betweenthe
JagiellonianUniversity
of
Krakdw
andthe
University
of
Liège.The-
Jaglgllgnian
Universty provided
a
ætal supporr
to
the
working
ream, generouslyoffering field
vehicle and lodging, and completely supporting
with
agr_eat and
hearty hospitality
the stayin
Polandof
the Belgianmembir
of
tle
team.All
authors are indebted_ro RecrorMagnificus
M.
KurtreizrsrsKr.who kindly
and generorlsly encouragedthe
work
and offered
opportunities
of
discussions'withCracovian
professorsand
seardrers.In
the
field
work
took an
active
parr,
beside
the
aurhors,
E.Grr
andA. Korenne, who provided particularly helpful
discussion.The
authors are alsogreally
indebtèd to?rof.
P.Mecen,
to
Prof. Z.
Czxppn andto
Mr.
T.
NrroÉvmol,
who
read themanuscript
andoffered
usefulcriticism,
a1d_
t9
many-seardrers
of
the
Jagiellonian
Univeisity and
the Polish
Academyof
Scienceswho
showed,a
ÿery
sympathetic interest
in
this work
and
worthily
discussed the method and the resuits.
-Laboratoire
de Géologie et de Géographie physique,Université
de Liège.Instytut
Geografii, Polska AkademiaNauk.
Instytut
Geografii,
Uniwersytet
Jagielloriski.Katedra
Gleboznawstwa,\iyù,sia
SzkolaRolnicza,
Krakdw.
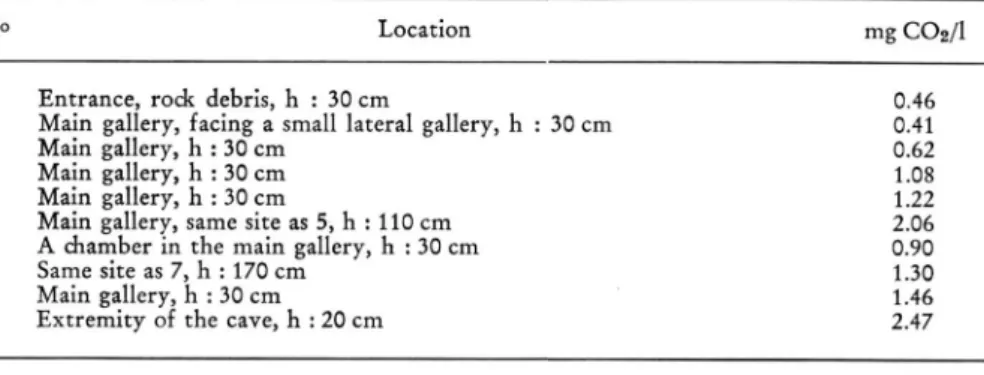
Table
A
Jaskinia DzwonnicaSilesian Upland
Alt.:330m;
Analyses: 7.4.1967,9. a. m.-
1 p.m.§o
of -th-e analysis, locario_nof
the _sample, COz conrent (h:
heightof
sampling above thefloor of the cave or above the ground).
Location mg CO2/l
§o
1
Entrance, rod< debris,h
:
30 cm2
Marn gallery, facing a small lateral gallery,h
: 30cm3
Main gallery, h : 30 cm4
Main gallery, h : 30 cm5
Main gallery, h : 30 cm6
Main gallery, same site as 5, h : 110 cm7
A dramber in the main gallery, h :30 cm8
Same site as 7, h : 170 cm9
Main gallery, h : 30 cm10
Extremity of the cave, h :20 cm0.46 0.41 0.62 1.08 1.22 2.06 0.90 1.30 1.46 2.47
Some analyses of the COz content of the air in five Polish caves
Table
B
Jaskinia Vodna pod Pisan4285
'latra'
Alt.:
some 1000 mAn, no 1 and 2t 11.4.1967, at 10 p. m.
No
of
the analysis, locationof
thc sample,floor of the cave or above the ground).
An. n0 3 to 9: 12.4.1967,11 a. m.
-
4 p.-.
COz content
(h:
heightof
sampling above the§o Location mg COz/l
1
Main outlet of the resurgent flow, h: 25 cm (10 p. m.)2
Minor outlet of the resurgent flow, h: 25 cm (10p. m.)3
Free atmosphere, nearby the cave, h: 160 cm4
Extremity of a dry fissure in the cave, h: 10O cm5
Above a iow derivation of the underground river,h:
30 cm6
Above almost standing water in a creek, h: 30 cm7
Above the main stream, h: 30 cm8
Above a body of deep, standing water, with putrescent wood, h: 30 cm9
Above shallow, almost standing §/ater, h: 30 cm0.43 0.43 0.56 3.40 0.67 1.11 0.72 2.04 0.77
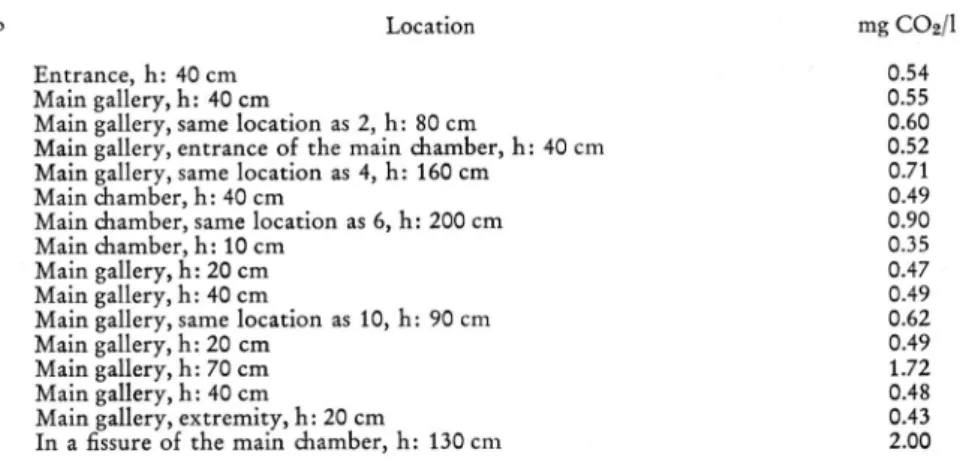
Table
C
Jaskinia nad Raptawi&4I
Tatra
Alt.:
some 1200 mNo
of
the analysis, locationof
the sample, CO2 contentfloor of the cave or above the ground).
Analyses: 17,4.1967,
1-9
p. m.(h:
heightof
sampling above theNo 1 2 3 4 5 6 7 8 9 10 11 12 13 t4 15 t6 Location Entrance, h: 40 cm Main gallery, h: 40 cm
Main gallery, same location as 2, h: 80 cm
Main gallerÿ, entrance of the main dramber, h: 40 cm
Main gallery, same location as 4, h: 160 cm
Main dramber, h: 40 cm
Main dramber, same location as 6, h: 200 cm
Main dramber, h: 10 cm
Main gallery, h: 20 cm
Main gallery, h: 40 cm
Main gallery, same location as 10, h: 90 cm
Main gallery, h: 20 cm
Main gallery, h: 70 cm
Main gallery, h: 40 cm
Main gallery, extremity, h: 20 cm
In a fissure of the main dramber,
h:
130 cmmg COz/l 0.54 0.55 0.60 0.52 0.71 0.49 0.90 0.35 0.47 0.49 0.62 o.49 1.72 0.48 0.43 2.OO
286
Er,
Grrrvsxe, Keszovsxr, Koryr.rcxl, Orrxsywove and OrrrsyN6wNe TableD
Jaskinia RaptawickaTatra
Alr.: some 1170mNo
of
the analysis. locationof
the samole.floor of the cavê
oi
above the ground). ^Analyses: 11.4.1967,8-9 p. m.
COz content
(h:
heighrof
sampling above the§o Location mg COz/l
1
2 3
Bottom of the aven, just under rhe enrrance pit, h: 160 cm
Idem, a little below 1, on a rodr-debris slope,
h:
160 cmFarther in the cave, lower than 7 and 2,
hi
160 cm0.47 0.37 o.32
Table
E
Jaskinia OblazkowaTatra
Alt.:
some 1120m
Analyses: 11.4.1967,2-4
p, m. ]^.{o of .th.e analysis, locationof
the .sample, COz content (h:
heightof
sampling above thelloor ot the cave or above the ground).
Location mg COz/l
§o
1
')
3
Entrance dramber, just above an ice patdr on rhe floor, h: 20
cm
0.94Ma.in gallery, at some 15 m of the dntrance,
in
a nidre (holtow)in
an icestalagmite, hr 20
cm
0.46Free atmosphere nearby the entrance of the
cave
O.4gLiterature
ArrrrN,_O.4. (19-65): Principles
of
Hydrodremistry (Polish editionof
"Osnovy Gidrodrimii"). DrxoN, 8.,§.A.Ruryn
(1950): The absorptionof
carbon dioxideby
liquid-drops.-
J.Soô.Chem. Ind., 692 284,
DIxoN,_B.,
&.1
HeNos (1957): Desorption and absorptionof
gasesby
drops during impact.-
J. Applied Chem.,7:342.Er,
C.,-F._Drrrcoun Er F. §fusspx (1.968): Teneur en COs deI'air
de quelques grottes belges.Te{rnique employée et. premiers iésultâts.
-
Annales de Spéléologie, Zl:Zil-ZiZ.
Korrr,
Éf. (1952): LaufendéMessung der Bodenatmung im Freiland.-
Landw. Forsd.r.,4: 18ê194.
MlsoN-wrr.r.rrrr,rs, A. (1959): The formation and deposition of moonmilk.
-
The Transactions of the Cave Researdr Group of Great Britain, 5,i,
dec.1959.Or.ersvrovl, K.,_8._T.KoubnNrcrr (1965): The dremical composition
of
waterin
the PolishTatra Mts and the problem of its variation in time.
-
LimnàI. Invest, in the Tatra Mts and_
the Dunajec River Basin. Komiter Zagosp. Ziem GdrskidrP.A.N.;
Krak6w, 11: 9l-111. Roqurs,H.
(1964): Contribution-à.1'étudé siatique et cinétique des sÿstèmes gaz carbonique-
eau-
carbonare.-
Ann. de Spéléologie, 19t 155485.Scuo_etrrn,
H.
(1950): Les variatiôns de Ia teneur en gaz carbonique des eaux sourerraines enfonction de I'altitude.