Science Arts & Métiers (SAM)
is an open access repository that collects the work of Arts et Métiers Institute of
Technology researchers and makes it freely available over the web where possible.
This is an author-deposited version published in: https://sam.ensam.eu Handle ID: .http://hdl.handle.net/10985/17100
To cite this version :
Hicham FAKHAM, Taoufik QORIA, Martin LEGRY, Olivier DUCARME, Frédéric COLAS -Development of a power hardware in the loop simulation of an islanded microgrid - In: IEEE IECON'19 45th Conference of the Industrial Electronics Society, Portugal, 2019-10-14 - n/a - 2019
Any correspondence concerning this service should be sent to the repository Administrator : [email protected]
Development of a power hardware in the loop
simulation of an islanded microgrid
Hicham FAKHAM Univ. Lille, Centrale Lille, Arts et Métiers Paris Tech, HEI, EA 2697
L2EP Lille, France [email protected]
Olivier DUCARME Engie lab Laborelec
ENGIE Laborelec Belguim
Taoufik QORIA Univ. Lille, Centrale Lille, Arts et Métiers Paris Tech, HEI, EA 2697
L2EP Lille, France [email protected]
Frederic COLAS Univ. Lille, Centrale Lille, Arts et Métiers Paris Tech, HEI, EA 2697
L2EP Lille, France [email protected]
Martin LEGRY Univ. Lille, Centrale Lille, Arts et Métiers Paris Tech, HEI, EA 2697
L2EP Lille, France [email protected]
Abstract—In this paper a Power Hardware in the loop simulation has been realized to test in a safely way the performances and reliability of a device called “PowerCorner” used to supply an islanded microgrid. A real-time model has been developed in order to simulate the microgrid, batteries and photovoltaic panels. Some modeling criterions have been proposed to reduce time-step simulation and enhancing the Power Hardware in the loop simulation stability. Power Hardware in the loop simulation is used to emulate the AC and DC environments around the power inverters. On the DC side, DC power amplifier is used to emulate photovoltaic power plants and storage devices made on Lithium batteries. On the AC side, AC power amplifier is used to emulate the behavior of the microgrid. These two power amplifiers are controlled by a digital real time simulator which embeds the dynamic behavior of both DC and AC sides.
Keywords— Power Hardware in the loop simulation, Real-time simulation, Microgrid, Power inverters, Storage system.
I. INTRODUCTION
Microgrids are considered as an efficient tool for empowering islanded communities and increasing the renewable energy penetration in the bulk power system. They can be defined as a set of distributed generators, renewables or conventional ones, storage systems and loads that can operate in a coordinated manner and possibly in islanded mode. Sustainable microgrids are becoming a leading solution in energy services in rural areas. In addition, their aim is to produce what is needed locally, by means of local controllers, enabling the economic and social development of local populations, while using local renewable energies.
Usual control structures are organized in a hierarchical way. The different levels are related to economic optimization, Power Management System (PMS) and microgrid stability [1]. Microgrid stability is ensured by local controls algorithms like droop control [2], virtual synchronous generator [3] and VISMA [4]. Secondary control and nominal operation (i.e. PMS) are ensured by centralized or distributed supervisors. Finally, the economic supervision of the microgrid (i.e. Energy Management System, EMS) is performed with offline optimization methods, like stochastic programming or heuristics-based methods.
As stated before, one big application of microgrids is to provide affordable, reliable and sustainable energy services to rural areas. To support the design of such microgrids, it is
important to study the complex interactions of power sources with the real-time operation of each unit and its loads. Therefore, Hardware in the loop (HIL) or Power Hardware in the loop (PHIL) simulation approaches based on hardware and software prototyping tools are very useful as it allows control testing before building an application in far rural areas. Moreover, these approaches provide a cost-effective option, flexibility in modeling and coding (i.e.; including a new control laws, protections, and stability studies).
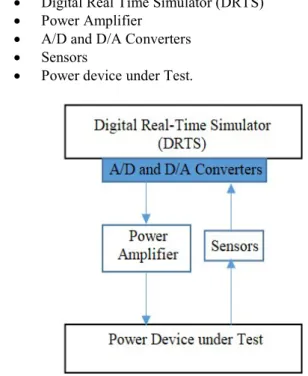
HIL approach is used during the development and testing of complex real-time embedded controller which interacts with the plant simulated in a digital real time simulator [5]. PHIL simulation is an extension of HIL simulation. PHIL simulation is used for testing a hardware power component in realistic conditions, while a part of the system is simulated in a digital real time simulator (DRTS) [6]. The main components are (Fig. 1):
Digital Real Time Simulator (DRTS)
Power Amplifier
A/D and D/A Converters
Sensors
Power device under Test.
Fig. 1. PHIL simulation principle
PHIL approaches are being widely used in many applications such as grid simulation [7], Integrating
Renewable Energy sources [8], Distributed generation provision of ancillary services [9], Smart Grid [10].
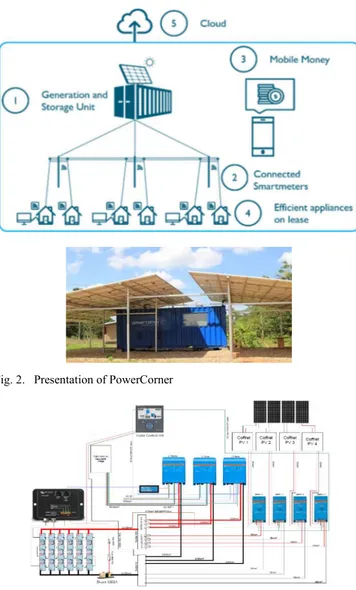
In this paper, the aim is to design a PHIL simulation to support the design of a device called “PowerCorner” which is an islanded microgrid developed by ENGiE company for rural area located in Africa. As illustration, Ketumbeine is the first village electrified by a PowerCorner device. Located in Northern Tanzania, its 16kWp containerized production unit can supply 120 houses and businesses.
As depicted in Fig. 2, the goal of the “PowerCorner” solution is to provide electricity with competitive prices (i.e.; comparable to current energy expenditures), but using environmentally-sound solar technologies instead of energy current sources such as kerosene lamps, car batteries and petrol-powered generators.
The customer pays a connection fee and then uses electricity monitored by a prepayment meter. Payments are made using mobile devices with a mobile money system.
Fig. 2. Presentation of PowerCorner
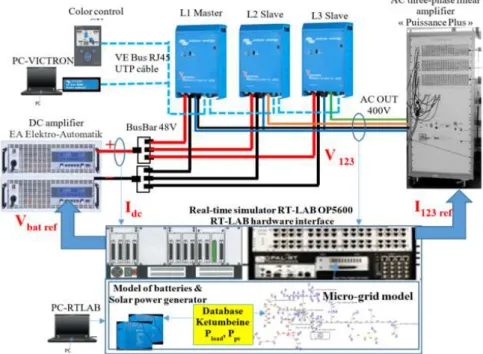
Fig. 3. Electrical shema of the container in PowerCorner
PowerCorner consists of a containerized solar power generator, a battery bank (Fig. 3). The microgrid contains several branches supplied by three single-phase inverters which are connected in three-phase in order to generate three phase balanced voltages. These single-phase inverters are synchronizing/communicating.
The purpose of using PHIL simulation in this paper is to evaluate in a safely way the performance and reliability of the PowerCorner, as well as to understand the interests and limits. Moreover, this paper presents the real-time models developed to simulate the microgrid, batteries and photovoltaic panels and proposes some modeling criterion to reduce time-step simulation and enhance the PHIL simulation stability.
The remainder of this paper is organized as follow. Section II describes the test bench developed for PHIL simulation of PowerCorner. Section III presents the developed models for real-time simulation (i.e. microgrid, batteries and photovoltaic panels). Section IV presents the experimental validation of the PHIL simulation based on a given load profile. The conclusions are drawn in Section V.
II. TEST BENCH FOR PHIL SIMULATION OF POWERCORNER
PHIL simulation of PowerCorner consists to integrate physical hardware (i.e. inverters) and software model of the AC microgrid in a single closed-loop simulation. Software modeling of batteries and photovoltaic panels are also integrated in the closed-loop simulation. To perform the PHIL simulation, a real-time experimental bench has been developed and is illustrated in Fig. 4. It consists mainly of:
A Real-time simulator RT-LAB OP5600 developed by Opal-RT Technologies in Montreal Canada. RT-LAB OP5600 simulates in real-time the behavior of the AC microgrid, batteries and photovoltaic panels. The real-time simulation models used in this paper is described in the next section.
An RT-LAB hardware interface: FPGA I/O and FPGA D/A digital cards allow sending and receiving external control signals and also to recover real-time simulation data (currents, voltages…).
Three Victron single phase inverters L1, L2 and L3 are connected to the real-time simulator through two power amplifiers.
A controllable DC amplifier is generating DC voltage references that emulate batteries. The amplifier is generating around 48V on the DC side of the Victron inverters. This voltage reference is sent by RT-LAB simulator to the DC amplifier
.
A controllable AC three-phase linear amplifier is used to emulate loads (i.e.; absorb AC currents): The 3-phase AC current is sent by RT-LAB simulator. A computer is used to set the parameters of the Victron
inverters.
A computer is used to display and configure the real-time simulation.
In this configuration, the main objective is to be able to emulate the electrical environment around the inverters. On the DC side, DC power amplifier is used to emulate a PV power plant and a storage device made on Lithium batteries. On the AC side, AC power amplifier is used to emulate the behavior of the local distribution grid. These two power amplifiers are controlled by a DRTS which embed the dynamic behavior of both DC and AC sides as described in the next section.
Fig. 4. Real-time experimental bench
III. MODELING OF COMPONENTS FOR REAL-TIME SIMULATION
A. DC side modeling
The DC side is an association of PV power plant and Lithium batteries (Fig. 5).
Fig. 5. Models of batteries and solar power generator
Battery model available in Matlab\SimPowerSystem (SPS) [11] is used in this study. The model structure is illustrated in Fig. 6.
Fig. 6. Battery model
This model calculates the voltage 𝑉 of the battery in respect with the current 𝐼 applied to its terminal. The discharge and charge models are detailed below.
Discharge model (𝑖∗ > 0) 𝑓 (𝑖𝑡, 𝑖∗, 𝑖) = 𝐸 − 𝐾 𝑖∗− 𝐾 𝑖𝑡 + 𝐴𝑒 . (1) Charge model (𝑖∗< 0) 𝑓 (𝑖𝑡, 𝑖∗, 𝑖) = 𝐸 − 𝐾 . 𝑖 ∗− 𝐾 . 𝑖𝑡 + 𝐴𝑒 . (2) Where:
𝐸 is the constant voltage (V) 𝐾 is the polarization constant (Ah−1) 𝑖∗ is the low frequency current dynamics (A) 𝑖 is the battery current (A)
𝑖𝑡 is the extracted capacity (Ah)
𝑄 is the maximum battery capacity (Ah) 𝐴 is the exponential voltage (V)
𝐵 is the exponential capacity (Ah)−1
The whole batteries model is shown in Fig. 5. This model is connected to a controllable current source which imposes the current 𝐼 . This model can also calculate the battery State-of-Charge (SOC).
Adaptation gains are added in the model of the battery to modify voltage and current levels. These gains represent the number of batteries connected in series and parallel. In our case, the adaptation gains are used to represent 6 battery packs in parallel and each pack is composed of 4 batteries connected in series.
PHIL simulation starting process with DC side model is performed as following:
The battery voltage is provided by the simulator RT-LAB to the DC amplifier which supplies the VICTRON inverters.
In order to perform the closed-loop simulation, the DC current 𝐼 absorbed by the Victron inverters is measured, and the battery current 𝐼 needed for battery model is calculate by using the mathematical relation:
where 𝐼 and 𝐼 are respectively the current provided by photovoltaic panels and the DC current of Victron inverters. The parameters of the battery bank are given in TABLE I.
TABLE I. Nominal
Parameters of the battery Charge and discharge parameters Nominal voltage 12.8V Max. capacity 244Ah
Rated capacity 200Ah Fully charged voltage
14.15V
Initial SOC 95% Nominal discharge current
92A
Battery response time 120s Internal resistance 0.0005Ω
The model of the photovoltaic panels is represented by a simple current injector. The photovoltaic current 𝐼 is determined according to the following expression:
𝐼 = 𝑃 /𝑉 (4)
where 𝑃 represents the power generated by the photovoltaic panels and follows a predetermined profile.
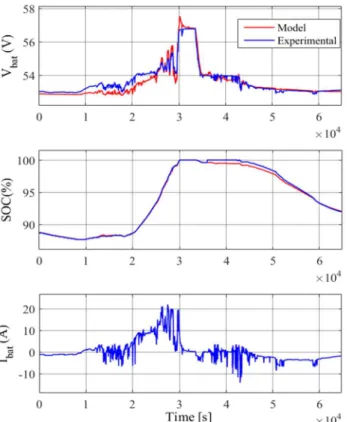
In order to check the accuracy of the battery model, some time domain simulations are performed and compared with those recorded on the “PowerCorner” of Ketumbeine village. It can be seen in Fig.7 that the proposed model matches the measured recorded in the actual site. The Soc is very similar until 3.5 secs because the battery has not yet reached the saturation area. In this area the losses increase considerably.
Fig. 7. Experimental and simulation results of batteries
B. AC power system model
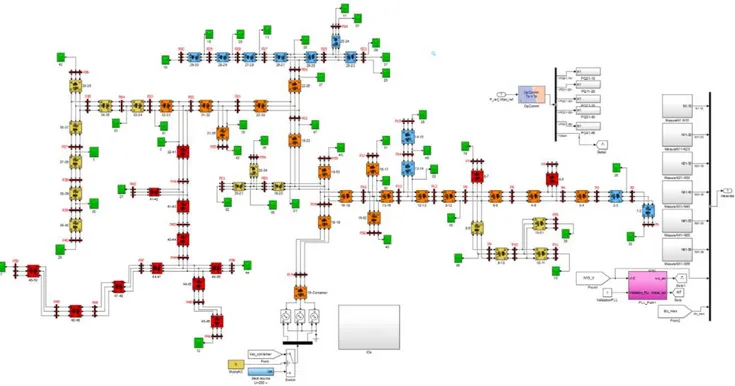
Fig. 8 shows the model of microgrid developed to realize the real-time simulation and Fig. 4 shows the way how this
model is implemented in PHIL. This model is created by using the Matlab\SimPowerSystem environment. The microgrid is supplied by inverters that are replaced in real-time simulation by a controllable voltage source. The microgrid is composed of several branches. All distribution lines are three-phase ones. The loads are represented by several houses and they are connected in single-phase. According to the present configuration, we have a connection of fifty houses. Loads are distributed uniformly over the three-phase lines. The parameters of the line are given in Table II.
Similarly, to the DC side, PHIL simulation starting process with AC side model is performed as following:
1. The AC three-phase voltages generated by the Victron inverters are measured.
2. The generated AC voltages are received by the RT-LAB simulator and used in the real-time simulation model via a three controllable voltage sources.
3. Loads (i.e.; houses) absorb currents which are used by the RT-lab simulator to control the AC linear amplifier.
TABLE II. Section
(mm2)
Linear resistance of the
cables R (Ohm/km) Linear reactance of the cables X (Ohm/km)
25 mm2 0.907 0.0813
50 mm2 0.483 0.0779
C. Load modeling approximation to reduce the maximum time-step
It is recalled that loads are single-phase ones connected to the microgrid at different buses and absorb a pre-determined active and reactive power.
Loads are modeled by a simple current injector. The injected current is given by the following relation:
𝑖(𝑡) = √2𝐼𝑠𝑖𝑛(𝜃 + 𝜑) (5)
With:
I is the current amplitude. 𝜑 is the phase shift
𝜃 is the angle used to synchronize the load with microgrid. For each load, we can estimate the angle 𝜃 by using Phase-locked loop (PLL). The implementation of several PLL blocks can increase the time-step of real-time simulation resulting in stability issues in PHIL simulation.
In order to reduce the maximum time-step, the same angle 𝜃 should be used for all loads. This remains valid in our case since loads voltages remain constant and nearly identical to the inverters voltages. Therefore, a single block of PLL is used for all loads to estimate the angle 𝜃 from the measured inverters voltages. The time-step used for PHIL simulation is equal to 20secs.
The current amplitude and the phase shift can be calculated from active and reactive power references by using the following relation:
I = φ = arctan (6)
Fig. 8. Simulation model of microgrid
IV. VALIDATION ON A LOAD PROFILE
The objective of this part is to show the experimental results realized concerning the PHIL simulation of the microgrid. Tow test cases are performed:
Microgrid connection for a linear load.
Microgrid connection for a given daily load profile and photovoltaic electrical power.
A. Microgrid connection for a linear loads
The connection of resistive loads is simulated in real-time simulation. Voltages generated by inverters are measured and used in real-time simulation (Fig. 9). At time near to 0.065s, resistive loads absorb currents which are used by the RT-lab simulator to control the AC linear amplifier.
Fig. 9. Inverters AC voltages and load currents
Fig. 9 shows the voltages generated by inverters and the AC currents of AC linear amplifier. The results obtained show the correct operation of inverters. Thanks of the PLL, the synchronization of loads is ensured and the PHIL simulation remains stable.
B. Microgrid connection for a given daily load profile and photovoltaic power
For this test case, the data recorded on the Ketumbeine site is used. This is a variable daily profile of active power load and power photovoltaic.
Fig. 10 shows the evolution of the DC voltage at the inverters level. It is nearly equal to the voltage across the battery simulated in real-time. DC voltage is provided by RT-LAB simulator to the DC amplifier which supplies the inverters.
Fig. 10. Inverter DC voltage
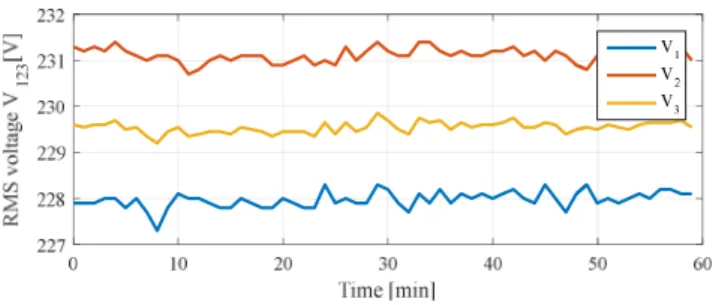
The inverters generate immediately the three-phase AC voltages used in the real-time simulation model to supply all Loads (i.e.; houses) (Fig. 11).
As shown in Fig. 12, after 3s, all loads begin to absorb the AC current. Currents absorbed are used to control the AC linear amplifier which is connected to inverters. AC currents variations don’t impact the AC voltage of the inverters. 0.04 0.05 0.06 0.07 0.08 0.09 0.1 0.11 0.12 0.13 Time [s] -200 0 200 V1 V2 V3
Fig. 11. RMS voltages generated by inverters
Fig. 12. RMS currents absorbed by AC linear amplifier
The inverters must feed the AC side through the DC side to keep PHIL simulation stable. Then, the DC amplifier generates the DC current 𝐼 needed for the AC side (Fig. 13).
Fig. 13. DC current generated by DC amplifier
Fig. 14 shows that the AC power absorbed by AC linear amplifier is nearly equal to the DC power generated by DC amplifier; the small difference is mainly due to the inverter’s losses.
Fig. 14. Total active power in DC side and AC side of inverters
V. CONCLUSION
In this paper, a PHIL simulation framework has been proposed to test a PowerCorner device which is used to supply rural areas in Africa. The main objective was to design a test
bench which allows to reproduce the environment behavior of a PowerCorner device. This device is used to embed a PV power plant and a storage device. More precisely, the emulated environment is made of 2 parts:
1- On the DC side, the PV power plant and the storage device are emulated with a DC power amplifier controlled with a DRTS
2- On the AC side, the rural grid is emulated with an AC power amplifier also controlled with a DRTS. In addition, the proposed PHIL simulation developed in this paper allows to test inverters behavior and detects any problems before the real deployment in far rural areas. It can also study faults which may occur in actual areas. It is indeed far more convenient to test that in a laboratory instead of making measurements in the real rural areas. At last, behavior in extreme conditions can also be tested.
However, the simulation of all AC loads is very computational. A simplified AC load model has been proposed. The principle idea was to use the same synchronization angle for all loads.
Future works will deal with other test cases that include a full dynamic control of power sources and integrating a soft protection against faults that may occurs in microgrids.
REFERENCES
[1] M. Legry, F. Colas, C. Saudemont, J. Y. Dieulot, and O. Ducarme, “A Two-layer Model Predictive Control Based Secondary Control with Economic Performance Tracking for Islanded Microgrids,” in IECON 2018 - 44th Annual Conference of the IEEE Industrial Electronics Society, 2018, pp. 77–82.
[2] T. Qoria, F. Gruson, F. Colas, G. Denis, T. Prevost, and X. Guillaud, “Inertia effect and load sharing capability of grid forming converters connected to a transmission grid,” in 15th IET International Conference on AC and DC Power Transmission (ACDC 2019), 2019, pp. 1–6.
[3] H. Beck and R. Hesse, “Virtual synchronous machine,” in 2007 9th International Conference on Electrical Power Quality and Utilisation, 2007, pp. 1–6.
[4] R. Hesse, D. Turschner, and H.-P. Beck, “Micro grid stabilization using the virtual synchronous machine (VISMA),” Renew. Energy Power Qual. J., vol. 1, no. 07, pp. 676–681, Apr. 2009.
[5] K. Butler-Purry and H.-M. Chou, “Real-Time Rapid Embedded Power System Control Prototyping Simulation Test-Bed Using LabVIEW and RTDS,” in Practical Applications and Solutions Using LabVIEW™ Software, S. Folea, Ed. InTech, 2011. [6] W. Ren, M. Steurer, and T. L. Baldwin, “Improve the Stability and
the Accuracy of Power Hardware-in-the-Loop Simulation by Selecting Appropriate Interface Algorithms,” IEEE Trans. Ind. Appl., vol. 44, no. 4, pp. 1286–1294, Jul. 2008.
[7] “https://www.nrel.gov/grid/simulation-phil.html.” .
[8] V. H. Nguyen et al., “Real-Time Simulation and Hardware-in-the-Loop Approaches for Integrating Renewable Energy Sources into Smart Grids: Challenges & Actions,” ArXiv171002306 Cs, Oct. 2017.
[9] P. C. Kotsampopoulos, F. Lehfuss, G. F. Lauss, B. Bletterie, and N. D. Hatziargyriou, “The Limitations of Digital Simulation and the Advantages of PHIL Testing in Studying Distributed Generation Provision of Ancillary Services,” IEEE Trans. Ind. Electron., vol. 62, no. 9, pp. 5502–5515, Sep. 2015.
[10] M. Maniatopoulos, D. Lagos, P. Kotsampopoulos, and N. Hatziargyriou, “Combined control and power hardware in-the-loop simulation for testing smart grid control algorithms,” Transm. Distrib. IET Gener., vol. 11, no. 12, pp. 3009–3018, 2017. [11] “www.mathworks.com/help/.” . 0 10 20 30 40 50 60 Time [min] 0 1 2 3 4 I1 I2 I3