Science Arts & Métiers (SAM)
is an open access repository that collects the work of Arts et Métiers Institute of
Technology researchers and makes it freely available over the web where possible.
This is an author-deposited version published in:
https://sam.ensam.eu
Handle ID: .
http://hdl.handle.net/10985/17576
To cite this version :
Louise LE BARBENCHON, Jérémie GIRARDOT, Jean-Benoit KOPP, Philippe VIOT - Multi-scale
foam : 3D structure/compressive behaviour relationship of agglomerated cork - Materialia - Vol. 5,
p.100219 - 2019
Any correspondence concerning this service should be sent to the repository
Administrator :
[email protected]
Multi-scale
foam
:
3D
structure/compressive
behaviour
relationship
of
agglomerated
cork
Louise
Le
Barbenchon
∗,
Jérémie
Girardot,
Jean-Benoît
Kopp,
Philippe
Viot
Arts et Métiers ParisTech, CNRS, I2M Bordeaux, Esplanade des Arts et Métiers, Talence Cedex F-33405, France
Keywords: Multi-scale microstructure Cellular material Cork agglomerate X-ray microtomography Mechanical behaviour
a
b
s
t
r
a
c
t
This study focuses on the microstructural aspects of a cork-based by-product known as agglomerated cork and its influence on the compressive mechanical behaviour. The material consists in granulates of a natural polymeric foam - cork - mixed together with a small quantity of a bio-sourced resin.
Optical and scanning electron microscopy (SEM) are first used to investigate on the bead geometry and placement and interfaces arrangement. Then X-ray computed tomography allows to study the spatial arrangement of agglomerated cork microstructure and hence to complete and confirm 2D observations. 2D and 3D observations show a transverse anisotropic material which is confirmed by the mechanical tests. SEM pictures demonstrate an intricate and heterogeneous material. Microtomography confirms the presence of macroporosities between cork granulates having a mean volume around 0.1 mm 3. Cork cell specific geometry is also confirmed. The
volume of those cells lies around 10 −5mm 3. Finally quasi-static compression tests are run to establish a link
between microstructure and mechanical behaviour thanks to digital image correlation (DIC). Cork agglomerate demonstrates strong strain localisation at its surface caused by its multi-scale structure.
1. Introduction
Becauseofemergingconcernsaboutglobalwarmingandthusabout thecarbonfootprint,thedemandforbio-sourcedmaterialsiscurrently increasing.Corkmaterialbeinganaturalpolymericfoam,itpresentsa uniquesetofproperties(fireresistant,energyabsorbing,phonic isola-tion,...).Itisthenanexcellentcandidateforalargesetofapplications. CorkcomesfromthebarkoftheoaktreeQuercusSuberusL.growing inareaslikePortugal,SpainorcertainpartsofChina.Europeproduces 80%oftheworld’scorkandalmostthreequarterofthemcomefrom Portugal[1].Itisaveryuniquematerialduetoitslowdensity-around 0.17-,greatelasticity,chemicalstability,itsnopermeabilitytoliquid andgasesanditsresistancetofire[2].Corkisusedforcenturies,first bytheRomansinsandalsorstoppersforamphorae.Itsmostpopular ap-plication-stoppersforglassbottles-wasperfectedinthe18thcentury inaBenedictineAbbeyinHautvillers,France[2].Corkby-productsare todaymainlydevelopedfortheirthermalinsulationandacoustic prop-erties[3].Duetoitscellularmicrostructure,corkabsorbingproperties fordynamicloadingarenowbeingconsideredforimpact-absorbing ap-plicationsascorematerialinsandwichstructures[4].Rangingfromthe containerforthetransportofsensiblepiecestosportsitemsand includ-inglightweightaeronauticcomponents,awiderangeofapplicationsis foreseen[1,5].
∗Corresponding author.
E-mail address: [email protected](L. Le Barbenchon).
To decrease thevariabilitycaused byenvironmental dependency (weather, growingplace, harvest season) [6,7], a cork by-product -agglomeratedcork-ispreferredformechanicalapplications.Italso al-lowstooversteptheanisotropyofnaturalcorkbyrandomlyarranging corkcellorientationandtomoldpieceswithamorecomplexgeometry. For10years,fewstudiesinvestigatedonthemechanicalbehaviourof suchmaterialsunderquasi-staticandimpactloadings[8–12].Givingits consideredapplications,theyfocusedonthecompressivebehaviourof corkagglomerates.Theydemonstratedtheinfluenceofthemeanstrain rate,corkgranulatessize,thetypeofresinorthematerialdensityon theabsorbedenergy,contactforcemaximumortheaccelerationpeak maximum.
However themicrostructure of this material is still not fully re-viewed,evenifitcouldstronglyinfluenceitsmechanicalbehaviourand itsspecificstrainmechanisms.Onlythemicrostructureofnaturalcork hasbeenquitestudied.SEMobservationsofnaturalcorkgive informa-tionconcerningthecellspecificgeometry[2]andsurfacedistribution of each direction[13].Concerning thespatialorganisation,only the macroscopicdefectsofnaturalcork,likelenticularchannel(alsocalled lenticels)orantsgaleries,wereinvestigatedbyusingeitherneutron to-mography[14](foraspatialresolutionof200μm),Compton tomogra-phy[15]orX-raytomography[16,17](spatialresolutionof2mmand 50μm).Thosetechniqueswereusedtostudythecorrelationbetween
Fig.1. (a) Natural cellular disposition of cork. (b) Axial direction. (c) Tangential direction. (d) Radial direction. SEM Pictures.
corkquality(givenbysurfaceanalysis)andinternaldefectsofcork stop-pers.Itwasshowncorkqualitymatcheswithmacroscopicdefects pop-ulation.FurthermoreX-raymicrotomographyatahigherspatial resolu-tion(50μm)waswellsuitedtofocusonthelenticularchannels quan-tificationandtheirstructures[17].Internalfeatureandcontrast mech-anismswerealsostudiedwithsynchrotronX-Raysatseveraltensions
[18].Howeveronlyimportantcracksandlenticelscouldbespotted. Agglomerated cork was itselfnot studiedwith quantitativetools whilerecentobservationsusingmicrotomographyproveditwaswell suitedtoinvestigateforexampleonthe3Dstructureoffoamsatseveral scales[19–21].Ithasbeenusedtostudythecomplexarrangementof thecellsofcellularmaterialsofmetals,polymersandnaturalfoamslike bone.
Thisworkhastwoaims.Thefirstoneistostudywithseveral tech-niques themicrostructureof cork agglomeratesandtogive thefirst quantitativedataatseveralscales(cellsandbeads).Such microstruc-turalstudy isone of thefirstconcerning multi-scalesfoams like ag-glomeratedcork.Thepost-processingisthendetailledintheMaterial &Methodspart.Theothergoalistoinvestigatetheglobalresponseof corkundercompressionandtolinkittothemicrostructure observa-tions.Itwasindeedalreadydonefornaturalcork[22]orothercellular materials[23]butnotforagglomeratedcork.
Firstopticalmicroscopyisusedtounderstoodgeometricalaspectat theagglomeratescale.Thenscanningelectronicmicroscopypermitsto observenotonlybeadsorganisationandinterfacesbetweenthembut alsocorkcellsorientation.Finallyasthosetwotechniquesareinvasive andallowonlytoaccesstothesurfaceofthesample,X-ray microtomog-raphyisusedtoverifyassumptionsmadewithpreviousobservations. Quasi-staticuniaxialcompressivetestsanddigitalimagecorrelationare alsoruninordertodiscussaboutmicrostructuraleffectsonthe mechan-icalbehaviour.
2. Material&methods 2.1. Materials
Corkisanaturalpolymericfoamwhichdisplaysaclosed-cell struc-ture[2].Itisformedbysmallprismaticcells(withanapproximated length h of 40 μm) disposedin successive layers (Fig. 1) exhibiting arelativelyhomogeneoushoneycombmicrostructure.Suberin,a poly-mericsubstance,isthemajorcomponentofcorkcellwalls.Theother arelignin,celluloseandhemicelluloses[24].
Fig.2. Agglomerated cork: a multi-scale material influenced by the manufac- turing process. (a) Orientations resulting from the process. (b) Different obser- vation scales demonstrating the multi-scale structure of agglomerated cork. At the agglomerate and bead scales, pictures are taken with a light microscope. Cells scale is illustrated with a SEM image of cork cells observed in the axial direction.
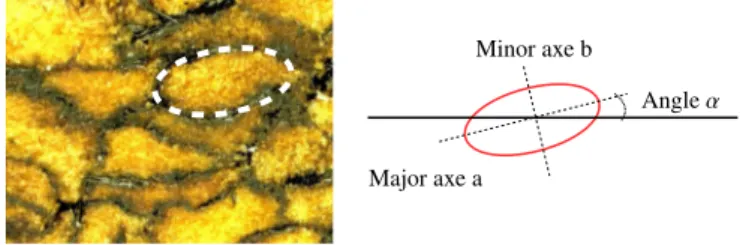
Fig.3. Geometrical approximation for a cork granulate and ellipse parameters.
Toobtainagglomeratedcork,naturalcorkisgroundandsievedto classifyitbysize.Inthisstudy,smallbeads(ø =0.5-1mm)aremixed togetherwithathermosetfuranresin(𝜌resin=1128.5kgm−3).Itisthen
uni-axially compressedintoa1000×500×150mm3 blockat a0.39
density.Thiscompressioninducesapreferentialorientationthatwillbe furtherinvestigatedinthisarticle.Fig.2ashowsthetwodirections in-duced:directionsinthe(Oxy)planewillbearbitrarilycalledin-plane directionsand(Oz)directionwillbecalledout-of-planedirection. Af-terwardsthecrossingismadeinanautoclave.Slabarethenmachined fromtheblock.
Cellularsolidsareoftendescribedbytheirrelativedensity𝜌∗/𝜌
s.The
densityofthecellularmaterialis𝜌∗and𝜌
sisthedensityofthesolidfrom
whichthecellwallsaremade.With𝜌s=1150kgm−3[2],therelative
densityofagglomeratedworkstudiedisthisarticleisaround0.34.
2.2. Lightmicroscopy
ThematerialisfirststudiedwithanopticalmicroscopeKeyenceata magnificationof ×20.Thesurfaceofseveralsamplesisobserved.With theImageJfree-software,pictureanalysisontheresultingpicturesis operatedbythresholdingonlythebeads.Erosionanddilatation oper-ationsarethenusedtoseparateeachbead.Finallyparticleanalysisis donebysimplifyinggranulatesbyellipses(Fig.3).Geometrical parame-tersofthoseellipsesarethenusedtocalculatetheaspectratio(AR)and
Fig.4. Microtomography samples. A first square-based prism is cut for a first tomography analysis. A smaller one is then cut inside for a second microtomog- raphy analysis (hatched prism).
thegranulatesorientation𝛼.Aspectratioisashapefactorobtainedby dividingtheminoraxislengthbythemajorone(AR=a/b).Themore ARiscloseto1andthemoretheparticletendstobecircular.
2.3. SEMobservations
SEMsamplesarecutwitharazorbladereplacedforeachcutinorder todamageaslessaspossiblethecellwalls[2,25].Eachcubicsampleis cutover-sizeandthentrimmedtothefinalsize(roughly5mmsides). Samplesarethenlightlycoatedwithconductivegoldtoallowelectronic conductionatthesamplesurface.ThedeviceusedwasaCressington108 auto.Thegoldlayerissupposedconstantonthesamplesurface.Samples arethenobservedwithaSEM(ZeissEVOHD15).Anacceleratedtension of10keVisusedwithacurrentof100pA.Bothdirectionsofthecork arestudied.
2.4. X-raymicrotomography
Thetwopreviousmethodsinvolveonlysurfaceanalysisanddonot allowfulldescriptionofthecomplexmicrostructure.Abiascouldalso beintroducedbycuttingsteps(celldistortion,interfacesdamage,...) be-causeoftheverylowdensityandhighporosityofthematerial.Thatis whytomographyisundertaken.
ThegeneralprincipleoftheX-raymicrotomographytechniquehas beendescribedinmanyarticleslikebyMaireetal[26].
ItrequiresaX-raysource,arotationstageandaradioscopic detec-tor.Toobtainacompleteanalysis,foralargenumberofangles,X-ray absorptionradiographyofthesampleismade.Afinalcomputed recon-structionstepisrequiredtoproduceathreedimensional mapofthe localabsorptioncoefficientsinthematerialwhichgivesapictureofthe structure.Thescaleoftheresolutionofthesetupusedisavoxelwhich correspondstoa3Dpixel.
One sample is used for two X-ray resolutions (Fig. 4). The first 8.5μm/voxelresolutiongivesthestructureatthegranulatescale.The accelerationvoltageandcurrentoftheX-raysweresetatrespectively 80kVand100μA.Afterthisfirstanalysis,asampleiscutfromitat smallerdimensionstoobtaina2.5μm/voxelresolutiontostudythecell scale.ThistimetheaccelerationvoltageandcurrentoftheX-rayswere setatrespectively70kVand220μA.
2.5. 3Dimageanalysis
Post-treatmentanalysisalgorithmoftomographydataisdonethanks totheAmira-Avizosoftwaretocalculatequantitativeparametersand obtainthe3Dreconstruction.Morphometricparameterswerecalculated usinga prismaticsub-volume oftheoriginal objectimaged, referred hereintoasthevolumeofinterest(VOI).Forthebeadsstudy,the se-lectedVOIwaslocatedatthecentreofthespecimentoeliminateany edgeeffects,artefactsanddamagesfrom samplecutting.Inorderto studythecorkcells,threeVOIwereselectedinsideabeadtoavoidany effectscausedbytheinterfaces.EachVOIwasthenfiltered and seg-mentedaccordingtothestepsdescribedinthefollowingparts.
Theuncertaintyofacquisitiontechniqueitselfseemsmuchsmaller thantheoneduetothedataanalysis.Especiallytheimagesegmentation, whichisoneofthemajordifficulties[27].Howeveritseemsthereisno
establishedtechniquetoevaluatehowthesegmentationtechniqueis accurate.Yetinthecaseofcork,thenaturalvariabilityofthematerial
[6]andthevariabilityduetotheprocess(beadsgrinding)aresupposed muchbiggerthanalltheotheruncertainties.Thisisthenthestatistical distributionofallthemorphometricparametersthatwillbeconsidered inthiswork.
2.5.1. Largesample
For the first sample, a simple thresholding on raw imagesdoes notpermittoaccesstomorphometricparametersimmediately.Indeed beadsaremadeofcorkcellscontainingvoids.Thereforeitcausestoo muchnoisetoallowagoodsegmentationofcorkgranulates(Fig.5a).
Firstofallahistogramequalisation(Fig.5b)isusedtoenhancethe contrastbyredistributingtheintensityvaluesfrom16bitsimages(grey levelsbetween0and65535)to8bitsimages(greylevelsbetween0 and255).Thehistogramiscomputedbetweentheminimumandthe maximumoftheimagegreylevels.
Thenamedianfilterisapplied(Fig.5c).Thisnumericalfilterworks bymovingthroughtheimagepixelbypixel,replacingeachvaluewith themedianvalueofneighbouringpixels.
Afterthatasimplethresholdingisusedtoselecteitherporositiesor granulates(Fig.5d).Thenanopening(anerosionfollowedbya dilata-tionwithastructuringelementlikeacubeoradisc)[28]isdoneto suppressirregularitiesorsinglevoxels(Fig.5e).
Finally asegmentationisoperated inordertofullyseparateeach beadthankstotopographicconditions(Fig.5f).Afterthissegmentation, asinglelabelcanbeassociatedwitheachbead(Fig.5f).Segmentation isnotusedontheporosities.
The3Dsegmentationmethodisitselfdividedintothreemainsteps
[21].First,adistancemapimageiscomputed(Fig.5g)andtheposition oftheultimateerodedsets,calledmarkers,isdetermined[29,30].The Chamferdistanceisusedinthiscase.Therightmarkersarethenselected by topographicconditions. Here theH-maximaalgorithmis usedon theinverseddistancemaptomergeregionalmaximumswithacontrast coefficientcriterion h(Fig.5h).Finally,thewatershedisconstructed fromthesemarkerswiththehelpofthedistancefunction[31](Fig.5i). Theresultgivesseparatinglinesthatcan besubtracted totheinitial binaryimage.
From thepost-treatment of almost thewhole sample, near 9000 beadswerestudied.Thesampleisthenlargeenoughberepresentative. Volume,orientationandsphericityofcorkbeadsandporositieswere themaininterestingdata.Beadshavingavolumesmallerthan0.002 mm3wereherenotconsideredbeingassociatedwithnoise.Orientation
ischaracterised bythetwoangles𝜃 and𝜙 usuallyusedforspherical coordinates.Sphericity𝜓measureshowcloselytheshapeofanobject approachesamathematically“perfect” sphere.Itiscalculatedaccording toEq.(1),withVp,thevolumeoftheparticleandAp,thesurfacearea
oftheparticle.Thenearerto1,theclosertoasphere.
𝜓=𝜋 1 3(6𝑉𝑝) 2 3 𝐴𝑝 . (1) 2.5.2. Smallsample
Ontheotherhand,nofilterisneededforthesmallersample post-processingbecauseofthedifferenceofdensitybetweencorkcellswalls andvoidsinsidecells.Asimplethresholdisappliedtogenerateabinary imageofthegaseousphase.
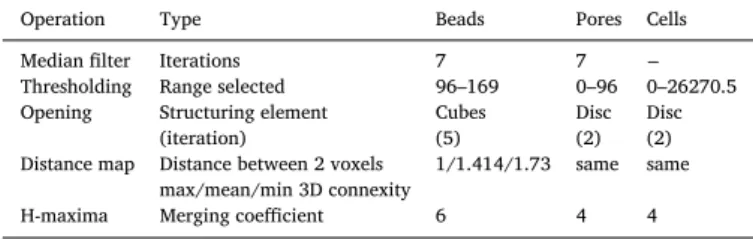
Afterthat,inordertoextractmorphometricparameters,thesame morphologicaloperationsasforthelargeresolutionsample areused (Fig.6).Table1resumesinputenteredtostudyeitherbeadsorporosities andcells.
Fromthepost-treatmentofdifferentareasincorkgranulates,almost 1400cellswerestudied.Thesampleseemsalsolargeenoughtobe rep-resentativeofthemicrostructureatthecellscale.
Fig.5. Post-treatment process of X-ray microto- mograhy data. (a) Raw picture. (b) Histogram equalisation. (c) Median filter. (d) Thresholding. (e) Opening. (f) Segmentation. Steps of the seg- mentation operation. (g) Inversed Chamfer dis- tance map. (h) Marker selectionned thanks to H- maxima technique. (i) Watershed lines obtained with a marker-based segmentation.
(a)
(b)
(c)
(d)
(e)
0.1 mm
Fig.6. Process to obtain 3D information on cork cells. (a) Raw image. (b) Thresholding. (c) Opening. (d) Separation. (e) Volume rendering.
Table1
Data of the post-processing of X-ray microtomography images. Operation Type Beads Pores Cells Median filter Iterations 7 7 − Thresholding Range selected 96–169 0–96 0–26270.5 Opening Structuring element Cubes Disc Disc
(iteration) (5) (2) (2) Distance map Distance between 2 voxels 1/1.414/1.73 same same
max/mean/min 3D connexity
H-maxima Merging coefficient 6 4 4
2.6. Quasi-staticcompressiontests
Ascorkisacellularmaterial,itsabsorbingpropertiesfor compres-siveloadingarenowbeingconsideredforimpact-absorbingapplications ascorematerialinsandwichstructures[4].Tobeabletorelate micro-structureobservationswithmechanicalbehaviour,quasi-static compres-sivetests are run topropose simple data for furtherinvestigations.
Digitalimagecorrelation(DIC)isusedtopreciselydescribestrain evo-lutionduringacompressiveload.
2.6.1. Experimentalprotocol
20×20×20mm3samplesarecutfromlargeslabsofagglomerated
cork.Anelectromechanicaltraction/compressionmachine(ZwickRoell 250fromAllround-Line)withaloadcellcapacityof250kNisused.The loadingspeedissetat0.05mmmin−1,5mmmin−1and500mmmin−1
correspondingtoanaveragestrainrateof4.210−5s−1,4.210−3s−1and
4.210−1s−1,respectively.Mechanicalbehaviourofthethreemain
di-rectionsspottedwithopticalmicroscopyisinvestigated.Theyarecalled out-of-plane(Oz),in-plane1(Ox)andin-plane2(Oy).Sixsamplesper directionaretested.
Tostudytherelationshipbetween microstructureandmechanical behaviour,picturesaretakenata1Hzfrequencyduringcompressive loadingsat5mmmin−1withaCanonEOS5Dthankstoasquaresignal
givenbyaGBF.
Somecycliccompressiontestsareundertakenatanaverage strain-rateof4.210−3s−1.Samplesareunloadedtozeroforceaftereach
in-cremental1mmdisplacement.Sixcyclesareoperated.Twosamplesfor bothin-planeandout-of-planedirectionaretested.
2.6.2. Post-processingofthecompressiontests
Fromtheforce/displacementdata,stress/straincurvesarededucted bycalculatingnominalstress(𝜎 =𝑆𝐹
0)andtruestrain(𝜖 =ln 𝑙0−𝑙
𝑙 ).
Pois-son’sratioofcorkbeingnear0[2],thesectiondidnotchangeduring thecompressiontest.
ToobtaintheYoung’smodulus,thecurveisfittedwithaseven de-greepolynomial.Theendofthelinearpartofthecurveisfoundwith its secondderivativeminimum.Aonedegreepolynomialisthen cal-culatedbetween 𝜀=0.01andthis point.Itsslopecorresponds tothe Young’smodulusgiveninthisarticle.HowevertheYoung’smodulus being stillnot precislydefined,moreoverforcellularmaterials[32], othersparametersareneededtocharacterizeagglomeratedcork.
Tostudytheplateaustageanenergyabsorptionefficiencyapproach isadopted[33].Theenergyabsorptionefficiency[34]isdefinedby
𝜂(𝜀)= 1
𝜎(𝜀)∫
𝜀
0 𝜎(𝜀
Fig.7. Experimental curve showing the energy absorption efficiency depending on the strain for agglomerated cork compressed in the out-of-plane direction at 5 mm min −1.
Themaximumenergyabsorptionefficiencycorrespondstothe den-sificationinitiationstrain𝜀d0sothat
𝑑𝜂(𝜀)
𝑑𝜀 𝜀=𝜀𝑑0
=0. (3)
Fig.7illustratestheabsorbedenergyefficiencyvariationalongthe strain.
Absorbedenergybeforedensificationwhichcorrespondstothesum ofdissipatedandelasticenergiesisthencalculated.Itisobtainedby in-tegratingalongthedisplacementusingthecompositetrapezoidalrule. Plateauabsorbedenergydensityatdensificationinitiationiscalculated byintegratinguntil𝜀=𝜀d0andbydividingtheenergyfoundbythe
samplevolume.FortheYoung’smodulus,thedensificationinitiation strainandtheabsorbedenergyatdensification,thedispersionis quan-tified.Themeandeviationcalculatedcorrespondstotheaverageofthe absolutedifferencesincomparisontothearithmeticaverage.
Withpicturestakenduringcompressivetests,DICisoperated.Indeed corkagglomeratesdemonstrateaspecifictextureanddonotrequirea speckledpattern[12].TheDICtechniqueconsistsinidentifyingspecific patternatthesamplesurfaceandtofollowitduringthewhole defor-mation.DICgivesaccesstothedisplacementfieldandstrainfieldscan beobtainedassumingsomehypotheses[35].
3. Resultsanddiscussion 3.1. Amulti-scalematerial
2Dobservationtechniques,lightandscanningelectronmicroscopy givedifferentinformationaboutthematerial.Fig.2bshowsthat de-pendingonthemagnificationandthetechnique,threedifferentscales ofthematerialmicrostructurecanbedefined.
• Agglomerate scale is the specimen scale. When mechanically loaded,it givesinformation on themechanic behaviour through Force/Displacementcurvesandassociated mechanicalparameters (likeYoung’smodulusortheabsorbedenergy).
• Beadscaleisaboutthecorkgranulatethataremillimetric.Porosities betweenbeads,interfacesbetweengranulates,beadsorientation,... areparametersthatcouldinfluencemechanismsatthisscale. • Acorkbeadisitselfacellularmaterial.Thisiswhyasmallerscale
exists.Indeedthesizeof corkcellsis afewtens of micrometers. Thecellscaleisabouthowthecellwallsdeformthemselvesduringa specificloading,cellgeometryorthegaseousphasetrappedinside,... Hence the multi-scale structure of cork agglomerates, already broachedforotherpolymericfoamsishighlighted[23].Aseachscale
Fig.8. Results from surface observation. Histograms of the granulates major orientation in cork agglomerates.
Fig.9. Orientation of cork granulates obtained through X-ray microtomogra- phy.
couldinfluenceeachotherandhaveaneffectonthestrainmechanisms, eachoneshouldbecautiouslyreported.Itorientedthenextanalysesthat areperformedinthisarticle.
3.2. Corkgranulates
3.2.1. Transversalanisotropicorientation
Nakedeyeobservationssufficetospotdifferencesbetweenin-plane and out-of-plane directions.Inthe out-of-plane direction,granulates keeptheaspecttheyhadbeforetheprocess.Beadsinthein-plane direc-tiondisplayanapparentelongationinthe(Oy)direction.Observations madeinthe(Ox)or(Oy)directionsaresimilar.Consequentlytheplane (Oxy)appearstobeisotropic.
Pictureanalysisallowedtoconvertbeadsintoellipses.Itconfirmed In-planegranulateshavemostlytheirmajoraxisorientedat0° while out-of-planeonesarerandomlyfacing(Fig.8).
GranulatesorientationisalsostudiedthankstoX-raytomography. Corkbeadsspatialorientationischaracterisedbytwoangles𝜙 and𝜃.
Fig.9showsthevalueoftheseangles.𝜃 valuesareequallydistributed. Onthecontrary𝜙 seems toliesessentiallyaround70 and90°.This meansthatbeadshavearandomorientationinthe(Oxy)planewhereas inthe(Oxz)or(Oyz)planestheytendtobealignedwiththein-plane
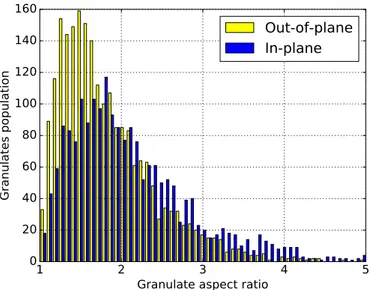
Fig.10. Results of picture analysis. Distribution of the granulates aspect ratio.
directions.Lightmicroscopyresultsarethensupportedby microtomog-raphyones.
This observationcaneasily be linkedtotheprocessexplained in theprevioussection.During themanufacturingprocess,theuniaxial compressionlikelyorientatecorkgranulatesinthe(Oxy)plane.
3.2.2. Transversalanisotropicgeometry
Dimensionsconsiderationswithopticalmicroscopyshowgranulates observed in the out-of-plane direction tend to have an aspect ratio mostlybetween 1and2.Whereasthegranulatesobservedin the In-planedirectionhaveitbetween2and3(Fig.10).Beadstendthentobe rounderinthe(Oxy)plane.
Tomographydatawerealsohelpfultobetterdescribebeads geome-try.
Sphericityispresentedin Fig.11a.Corkgranulatessphericitylies mostlybetween0.4and0.8whichisaratherlargespreading.The dis-tributioncanbeassociatedwithanormaldistributionf(x)expressedby theEq.(4). 𝑓(𝑥)= 1 𝜎√2𝜋⋅ 𝑒 −1 2( 𝑥−𝜇 𝜎 )2. (4)
Thefollowingparameterswereused: • xbeingthesphericity
• μ =0.6,meanofthedistribution
• 𝜎 =0.07,standarddeviationofthedistribution
Itcanbecomparedtobeadsdimensionsobtainedbysurface obser-vation.Anellipsoidofrevolutionwitha=0.45mm(halfmajoraxis) andb=0.22mm(halfminoraxis)isanoblatespheroid(Fig.11b).It wouldhaveasphericityaround0.6.Onceagain2Dand3Ddatamatch prettywell.
Thankstothepreviousobservations,itcanbeconcludedthatin ad-ditiontoaspecificorientation,corkbeadspresentalsoantransversal anisotropicgeometry.Theycanbeinafirstapproximationassimilated withparticlesflattenedinthetransverseplanelikeoblatespheroid.
3.2.3. Beadsorganisationandinterfaces
Themicrostructureofagglomeratedcorkdemonstratesarandom ori-entationofgranulatesinFig.12a.Eachbeadischaracterisedbycells growninonedirection(specifiedinFig.1).
Eachgranulatewillthenhaveamechanicalbehaviourdependingon itcellsorientationincomparisontotheloaddirectiontensorjustlike naturalcork[2].
SEMobservationsdemonstratesthininterfaceshardtodelimit be-tweentwobeads(Fig.12b).ResinwasalsouncertainlyspottedwithSEM observationsbutisrevealedwiththetomographyanalysis(Fig.16). In-deedthelargestwhiter(thusdenser)areasseemtocorrespondtothe resincoatingofcorkbeads.
3.2.4. Beadsvolume
ThedistributionofcorkgranulatesvolumeisillustratedbyFig.13.It representmorethan8000beadsintheVOI.Themeanvolumeisaround 9.910−2mm3.Itsstandarddeviationis910−2mm3.Thedistributionis
thusratherwide.Itmaybecomparedwiththevolumeofthesame pre-viousellipsoid.Itsvolumeis9.510−2mm3.
Providingaappropriatepost-treatment,microtomographyisthena very powerfultooltostudycorkbeadsandtoobtainvaluable quan-titativeinformation.Itallowstohavedistributedparameterstobetter describethematerialatthisscale.
3.3. Porosities
PorositiescouldbespottedonSEMpictures(Fig.12).Howeverno resinwastrappedinsidethem.
Ontomographypictures,porositiescanalsobespottedonthree dif-ferentplans.Itappearstheyarenotonlyduetothesamplepreparation forobservationsbutareinitiallypresentinthematerialafterthe man-ufacturingprocess.
3.3.1. Porositiesvolume
ThevolumedistributionoftheporositiesisshownintheFig.14.Itis basedontheresultsofmorethan3000porositiescontainedintheVOI. Themeanvolumestandsaround0.027mm3withastandarddeviation
of0.024mm3
Globallytheyaresmallerthancorkbeadsbutsomeofthemhavea significantvolumenearsmallcorkbeadsvolume.
3.3.2. Porositiesshape
Fig.15showsthe3Dreconstructionoftheporosities.Eachcoloris standingforonelabel.
Thespatialvisualisationofporositiesdemonstrateintricateshapes. Thereforeusualshapedescriptorscouldnotbeusedhere.Thebiggest porositydoesnotspreadoverthewholesample.Porositiesarethennot allinterconnected.
Porosities between beadsareoftenforgottenin corkagglomerate modellingduetothelackofinsightaboutit.Thesurfaceanalysis ap-pearsunsuitabletoobservethem.Microtomographyappearshereasthe appropriatetooltostudythem.Theirvolumeislargeenoughtohavean influenceonthemechanicalbehaviourandtheassociatedmechanisms. Thepreviousdatawillthenbeimportantforfurthermodelling.
3.4. Corkcells
SEMandX-raytomographyallowbothtoobservecorkagglomerates atasmallscaleandthereforetostudycellscontainedincorkbeads.
3.4.1. Cellsgeometry
Depending on the observation direction, the cell shape differs (Fig.16).Rectangularandhexagonalsectionsarethemostrepresented. ThisconfirmsthecorkcelldescriptionmadebeforethankstoSEM ob-servations[2].
Furthermore corrugations described in the literature [2] could hardly bespotted.Theresolutionofthepicturestakencouldexplain this.Voxelsidebeing2.5μmlarge,corrugationswouldbetosmall.
3.4.2. Cellsvolume
CorkcellsvolumeobtainedbyX-raytomographyaredisplayedin
Fig.11. 3D beads shape. (a) Results from computed tomography. Distribution of beads sphericity in a cork agglomerate obtained by uni-axial compression. (c) Oblate ellipsoid of revolution with a sphericity of 0.6.
Fig.12. SEM pictures of cork agglomerate at different scales. (a) Intricate mi- crostructure.Random cells orientation encircled. Porosities highlighted by ar- rows. (b) Interface between two cork granulates. Approximative delimitation by dotted lines.
VOIcontainedindifferent beads.Themeancellvolumeisaround1 10−5mm3withastandarddeviationof0.510−5mm3.
Comparisonwith2Dliteraturedatawasmadebyconsideringa sim-plergeometrythantherealone.Withthedimensionsreportedin[2]
(h=40μmandl=20μm),foracircle-basedcylinder,thecellvolume wouldstandaround1.310−5mm3.
Fig.13. Results from computed tomography. Distribution of beads volume in a cork agglomerate obtained by uni-axial compression.
Fig.14. Results from computed tomography. Distribution of porosities volume in a cork agglomerate obtained by uni-axial compression.
Fig.15. 3D reconstruction of porosities between cork beads. (a) 40 biggest porosties in the whole sample. (b) All the porosties in a subvolume.
Fig.16. Orthoslices of a subvolume obtained by computed tomography. The three main directions of cork cells are presented (radial, tangential and axial).
2Dand3Dmeasuresarethensimilargiventhedimensional varia-tionofcorkcellsdependingontheenvironmentalconditionduringthe growth.
3.4.3. Cellsdeformation
Asmentionedpreviously,SEMobservationsdemonstratethatcork cellsareoftencollapsednearinterfaces(Fig.18).Forsomebeads,all thecellsaredeformed.
Threedistinctiveareasarehighlightedhere.Thefirstistheinterface withsomeresin.Thefollowingzonehascellsthataretotallycollapsed. Finallyfarfromtheinterface,cellsaremostofthetimeundamagedor atleastonlydeformed.
Fig.17. Results from computed tomography. Cork cells volume distribution of cork agglomerate obtained by uni-axial compression.
Fig.18. SEM picture of the periphery of a cork bead (a) Interface. (b) Cork cell distortion in the vicinity of the interface. (c) Undamaged cells.
Hence somecells deformationis presentatleast from the manu-facturingprocess.Thispre-damagingprobablyinfluencesstronglythe strainmechanismsduringacompressiveloading.
3.5. Compressivebehaviour 3.5.1. Foam-likebehaviour
Fig.19apresentstheglobalcompressivebehaviourofagglomerated corktestedinthethreedirections.Asalreadyreporteditdemonstrates afoam-likedistinctivecompressivebehaviour[8,9]anditseemstobe anelastomericfoam[36].Hencethethreefollowingmainstagescanbe identified.
• Lineardeformation • Plateau
Fig.19. Results of the compressive loadings. (a) A typical experimental compression curve of agglomerated cork tested in the 3 directions. (b) Young’s modulus of cork agglomerates depending on the mean strain rate and the direction. (c) Densification initiation strain 𝜀 = 𝜀 𝑑0of cork agglomerates depending on the mean strain
rate and the direction of sollicitation. (d) Absorbed energy at 𝜀 = 𝜀 𝑑0of cork agglomerates depending on the mean strain rate and the direction of sollicitation. 3.5.2. Transverseanisotropicbehaviour
FromthethreecurvesdisplayedinFig.19a,twomainmechanical behaviourscanbedifferentiated.Bothin-planedirectionsappearstiffer thantheout-of-planedirection.Furthermoretheyalsoreach densifica-tionstageaftertheout-of-planedirection.
Fig.19bshowstheevolutionofYoung’smodulusforsamples com-pressedintheout-of-planeorin-planedirections.Whereastwo direc-tions,in-plane1andin-plane2,demonstrateaquasi-similarrigidityfor thesamesolicitationspeed,Young’smodulusintheout-of-plane direc-tionisaround60%lower.
Theout-of-planedirectionisthenmuchlessrigidanditseemsthe twoin-planedirectionsareequivalent.Thisobservationcanbelinked withpreviousobservationsmadeonthegeometryandspatial orienta-tionofcorkbeads.Thecollapsedcellsnearbeadsinterfacescouldalso influencethedirectionstiffnessastheyaremoreorientedintheplane (Oxy).Indeedtheseinterfacesaredenserandstifferthanasimplecells row.
Corkagglomeratesproducedbyuniaxialcompressionarethen ge-ometricallyandmechanicallyanisotropic.Thisbehaviourwasnot re-portedinpreviousarticles[8–10].Howevercorkagglomeratesstudied
therewerehalflessdensethattheonestudiedhere.Highdensity ag-glomeratescouldthentendtobelessisotropic.
3.5.3. Visco-elasticity
Fig.19balsodemonstratesthattheevolutionofYoung’smodulus dependsonthesolicitationspeed.Anincreaseofthesolicitationspeed inducesanincreaseoftheYoung’smodulus.
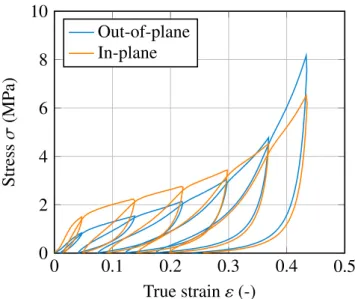
Cycliccompressivecurvesofthetwomaindirectionsof agglomer-atedcorkaredisplayedinFig.20.Bothcurvesdisplayavisco-elastic hysteresislargely resultingfrom theviscosityof bothcorkcellwalls
[37]andthepolymericresin.Thevisco-elasticrecoveryupon unload-ingissmallforthefirstcyclebutincreaseoncetheplateaustagereached (startingfromthesecondcycle).
Fig.20showsalsovisco-elasticrecoveryishigherforout-of-plane direction atshortterm.Itisalsotrueatlongterm.Indeed2months aftertheexperiment,residualstrainwas respectively0.067 ± 0.002 and0.074 ± 0.003forout-of-planeandin-planedirections.
Thoughintergranularfailurewassometimesobservedforin-plane samplesjustbeforethedensificationstage,cycliccurvesindicate com-pressiondoesnotseemtocausemajorfailureofcorkcellsjustlikefor
Fig.20. Experimental cyclic strain-stress curve of agglomerated cork in differ- ent directions.
naturalcork[22].Thecapacityofthecellstodeformwithoutfailure maybelinkedtothechemicalcompositionofcork.Thesuberin macro-moleculebeingalong-chainlinearmonomer[38],cellwallscanbuckled completlywithoutfracture(Fig.18).Therecoveryofthedimensions af-terstressremovalcanbeassociatedwiththeunfoldingofbuckledcell walls.Permanentdeformationissmallandmayberelatedtothecells collapsednearbeadsinterfacelikeobservedinFig.18.
Hencecork agglomeratesdemonstratea visco-elasticcompressive mechanicalbehaviour.Naturalcorkwasalreadyreportedhavingsuch behaviour[37].Socorkbeadsconstituentmaterialandresinarelikely responsibleforsuchbehaviourastheyarebothpolymers(oran assem-blageofseveralpolymers).
3.5.4. Energyabsorptionproperties
Thepresenceof astressplateauduringacompressionloading in-ducesinterestingpropertiesforenergyabsorptionapplications[36].
AccordingtoFig.19c,densificationhappenedaround𝜀=0.42and
𝜀=0.38whenthesampleistestedrespectivelyinthein-planeand out-of-planedirection.Consideringthemanufacturingprocess,this differ-enceofdensificationstrainbetweentesteddirectionsislikelycausedby thefactagglomeratedcorkwasalreadycompressedafirsttimeinthe out-of-planedirection.Somecorkcellswouldthenalreadyhavebuckled inthisdirection.
Failurehappenedforsomesamplescompressedinthein-plane di-rection.The𝜂 computationindicatesthisfailurewasalwaysaroundthe densificationinitiationstrain.
Thesolicitationspeeddoesnotseemtohaveamajorinfluenceon𝜀d0
(Fig.19c).Onthecontrary,absorbedenergyincreaseswiththespeed solicitation(Fig.19d)andishigherfortheIn-planedirection.Energy absorbedinthein-planedirectionvariesfrom1.5to2Jmm−3andfrom
0.5to1Jmm−3intheout-of-planedirection.In-planedirectionabsorbs
moreenergylikelybecauseitisstifferthanout-of-planedirectionand itdensifiesatahigherstrain[36].
Therelativedensity𝜌∗/𝜌
softhismaterialisaround0.34whichis
quitehighforacellularmaterial.Energyabsorptionwouldthenbe dom-inatedbycell-wallbehaviour.Thecompressionofthegaswithinthe cellswouldbenegligibleatquasi-staticcompressiveloadings[36].
Previousworkstookinterestintheabsorbedenergytoo.Howeverit wascalculatedatthebeginningofthedensificationbutathighstrains
[8] orat several strain through thecompression cycle [9]. The ab-sorbedenergywasmuchlower(around300Jmm−3atthe
densifica-tionstrain[9])thanforthematerialstudiedhere.Yet each agglom-eratedcorkhasitsownfeatures.Apolyurethaneresinwasoftenused.
Fig.21. YY-Strain map at several moments of the compression of cork agglom- erate in the out-of-plane direction at 5 mm min −1.
Theproportionswerealsodifferents.Finallythematerialdensitywas of-tenlower(around0.2[8]).Allthesedivergentpointscanthenexplain thediscrepanciesbetweenabsorbedenergiesobtained.
Agglomerated corkseemssuitedforprotective applicationshasit appearedtobeabletoconvertkineticenergyintoenergyofsomeother sortwhilstkeepingtheloadrelativelylowthankstotheplateaustage (around4MPabeforedensification).
3.5.5. Strainmechanisms
InFig. 21, theevolution ofthe strainin theloadingdirection is shown.Untilthebeginningoftheplateau,strainseemsquite homoge-neous.Howeveroncethecompressionreachestheplateau,at𝜀=0.036, higherstrainbandsappearatthesamplesurfacewhereastherestofthe surfaceremainalmostintact.Afterwardsstrainincreasesinthesebands whereasthesamplegloballydeforms.
Thesekindoflocalisationsarecalledlocalisationbands.Mostly multi-scalefoamsdemonstratesuchstrainbehaviour[23].Suchlocalisations havealreadybeenobservedforagglomeratedcorkcompressedat quasi-staticordynamicregime[12].
Suchmechanismscanberelatedtothestrain/stresscurve.Atfirst thedeformationislinearandhomogeneouswhichcouldbeassociated withanelasticbehaviour.
Oncethestressishighenoughataspecificplace,localbucklingof cellwallsstartsandlocalisationbandsappear.Hencetheplateau corre-spondstothepropagationofcorkcellsbuckling,beadbybead,Gibson andAshby[36].Strainpropagationcouldbeexplainedbyconsidering eitherabeadorcellwithlowermechanicalproperties,so-called“size
effect”,oramoresolicitedbeadorcell,“multi-scalestructureeffect”[23]. Forhigherstrain(𝜀≥𝜀d0),oncealmosteverycelliscollapsed,the
densificationstageisreached.Thematerialthenbehavesasabulkone. Thatiswhystressincreasesfaster.Allthescalesofcorkagglomerates presentedinthisarticlecouldplayaroleinthestrainmechanismsofthis
material.Thesemechanismscanbethereforeconsideredasmulti-scale. Furtherworkisthoughneededtobeabletobetterdescribeit.
4. Conclusions& perspectives
Corkagglomeratehasbeenusedfordecades.Howeverits microstruc-tureandmechanicalbehaviourisstillnotfullyunderstood.Thisstudy aimedatinitiatingdiscussionsaboutthemulti-scaleandcomplexe ma-terialmicrostructureanditsinfluenceonthemechanicalbehaviour.
Opticalandscanning-electronmicroscopytechniqueswereusedto obtainafirstmicro-structuraldescriptionofthesurface.Beadsangleand shapefactorpermittedtonoticethegeometricaltransverseanisotropy ofagglomeratedcorkproducedbyuni-axialcompression.
X-raymicrotomographyappearedtobeveryappropriatetobetter describethismaterialin3D.Twodifferentscaleswerestudied:beads andcells.Itbroughtadditionalinformationandallowedtoconfirm pre-vious2Dobservationsbycapturingarchitecturalinformation(cell vol-umedistribution,cellwalldefects,porositiessize,...)andthankstoa non-intrusiveprocess.Thisquantifiedstudycouldbeconsideredasa newinputformodelswhichwouldbetterdescribethespecificbehaviour ofcorkagglomerates.
Compressiontestsdemonstratedthatthespecificanisotropic geom-etryledtoatransverseanisotropicmechanicalbehaviour.In-plane di-rectionisstiffer,absorbsmoreenergy,densifiesathigherstrainsand hasalowervisco-elasticrecoverythanout-of-planedirection.
High strain heterogeneitieswere highlighted during compressive loadingin aquasi-staticregime thankstoDIC.Therewereidentified aslocalisationbands.
Futureworkwillfocusedonapreciseexplanationofthese localisa-tionsandmorewidelyonthestrainanddamagemechanismsathigher strainrates.
Acknowledgements
TheauthorsgratefullyacknowledgeLiegeHPKforproviding speci-mens.ThisworkwasperformedintheframeworkoftheLIAMAproject (supportedbySafranPowerUnitandRégionNouvelleAquitaine).
DigitalImageAnalysiswasperformedusingthefreesoftwarePydic runningwithPythondevelopedbyDamienAndré andtheauthorsthank himforit.
References
[1] L. Gil, New cork-based materials and applications, Materials (2) 625–637. doi: 10.3390/ma8020625 .
[2] L.J. Gibson, K.E. Easterling, M.F. Ashby, The structure and mechanics of cork, Proc. R. Soc. A Math. Phys. Eng. Sci. 377 (1769) (1981) 99–117, doi: 10.1098/rspa.1981.0117 .
[3] L. Gil, Cork composites: a review, Materials (3) 776–789. doi: 10.3390/ma2030776 . [4] F.C. Potes, J.M. Silva, P.V. Gamboa, Development and characterization of a natural lightweight composite solution for aircraft structural applications, Compos. Struct. 430–440. doi: 10.1016/j.compstruct.2015.10.034 .
[5] M.M. Mateus, J.M. Bordado, R.G. dos Santos, Ultimate use of cork unorthodox and innovative applications, Ciência & Tecnologia dos Materiais 29 (2) (2017) 65–72, doi: 10.1016/j.ctmat.2016.03.005 .
[6] H. Pereira, E. Ferreira, Scanning electron microscopy observations of in- sulation cork agglomerates, Mater. Sci. Eng. A 111 (C) (1989) 217–225, doi: 10.1016/0921-5093(89)90215-3 .
[7] H. Pereira, Variability of the chemical composition of cork, BioResources 8 (2) (2013) 2246–2256, doi: 10.1016/B978-044452967-1/50005-4 .
[8] R. Jardin, F. Fernandes, A. Pereira, R. Alves de Sousa, Static and dynamic me- chanical response of different cork agglomerates, Mater. Des. 68 (2015) 121–126, doi: 10.1016/j.matdes.2014.12.016 .
[9] P.T. Santos, S. Pinto, P.A. Marques, A.B. Pereira, R.J. Alves de Sousa, Agglomerated cork: a way to tailor its mechanical properties, Compos. Struct. 178 (2017) 277–287, doi: 10.1016/j.compstruct.2017.07.035 .
[10] C.P. Gameiro, J. Cirne, G. Gary, Experimental study of the quasi-static and dy- namic behaviour of cork under compressive loading, J. Mater. Sci.(12) 4316–4324. doi: 10.1007/s10853-006-0675-6 .
[11] S. Sanchez-Saez, S.K. García-Castillo, E. Barbero, J. Cirne, Dynamic crush- ing behaviour of agglomerated cork, Mater. Des.(1980–2015)743–748. doi: 10.1016/j.matdes.2014.09.054 .
[12] M. Sasso, E. Mancini, G. Chiappini, F. Sarasini, J. Tirillò, Application of DIC to static and dynamic testing of agglomerated cork material, 2018, doi: 10.1007/s11340-017-0369-9 .
[13] A. Lagorce-Tachon, F. Mairesse, T. Karbowiak, R.D. Gougeon, J.-P. Bellat, T. Sliwa, J.-M. Simon, Contribution of image processing for analyzing the cellular structure of cork, J. Chemom. 8 (July) (2017), doi: 10.1002/cem.2988 .
[14] A. Lagorce-Tachon, T. Karbowiak, C. Loupiac, A. Gaudry, F. Ott, C. Alba- Simionesco, R.D. Gougeon, V. Alcantara, D. Mannes, A. Kaestner, E. Lehmann, J.P. Bellat, The cork viewed from the inside, J. Food Eng. 149 (2015) 214–221, doi: 10.1016/j.jfoodeng.2014.10.023 .
[15] A. Brunetti, R. Cesareo, B. Golosio, P. Luciano, A. Ruggero, Cork quality estimation by using {Compton} tomography, Nucl. Instrum. Methods Phys. Res. Sect. B Beam Interact. Mater. Atoms 196 (2002) 161–168, doi: 10.1016/S0168-583X(02)01289-2 .
[16] V. Oliveira, P. Lopes, M. Cabral, H. Pereira, Influence of cork defects in the oxygen ingress through wine stoppers: insights with X-ray tomography, J. Food Eng. (2015), doi: 10.1016/j.jfoodeng.2015.05.019 .
[17] V. Oliveira, J. Van Den Bulcke, J. Van Acker, T. De Schryver, H. Pereira, Cork struc- tural discontinuities studied with X-ray microtomography, Holzforschung (2016), doi: 10.1515/hf-2014-0245 .
[18] V.R. Donepudi, R. Cesareo, A. Brunetti, Z. Zhong, T. Yuasa, T. Akatsuka, T. Takeda, G.E. Gigante, Cork embedded internal features and contrast mechanisms with DEI using 18, 20, 30, 36, and 40 kev synchrotron x-rays, Res. Nondestruct. Eval. 21 (3) (2010) 171–183, doi: 10.1080/09349847.2010.493990 .
[19] E. Maire, L. Babout, J.Y. Buffiere, R. Fougeres, Recent results on 3D character- isation of microstructure and damage of metal matrix composites and a met- talic foam using X-ray tomography, Mater. Sci. Eng. A 319–321 (2001) 216–219, doi: 10.1016/S0921-5093(01)00924-8 .
[20] E. Maire, A. Fazekas, L. Salvo, R. Dendievel, S. Youssef, P. Cloetens, J.M. Letang, X-ray tomography applied to the characterization of cellular materials. Related fi- nite element modeling problems, Compos. Sci. Technol. 63 (16) (2003) 2431–2443, doi: 10.1016/S0266-3538(03)00276-8 .
[21] T. Dillard, F. N’Guyen, E. Maire, L. Salvo, S. Forest, Y. Bienvenu, J.D. Bartout, M. Croset, R. Dendievel, P. Cloetens, 3D quantitative image analysis of open-cell nickel foams under tension and compression loading using X-ray microtomography, Philos. Mag. (2005), doi: 10.1080/14786430412331331916 .
[22] H. Pereira, The rationale behind cork properties: a review of structure and chemistry, BioResources (2015), doi: 10.15376/biores.10.3.Pereira .
[23] P. Viot, D. Bernard, Multi-scale foam behaviour characterisation, Comput. Methods Exp. Mater. Charact. III I (2007) 197–206, doi: 10.2495/MC070201 .
[24] S.P. Silva, M.A. Sabino, E.M. Fernandes, V.M. Correlo, L.F. Boesel, R.L. Reis, Cork: properties, capabilities and applications, Int. Mater. Rev. 50 (6) (2005) 345–365, doi: 10.1179/174328005X41168 .
[25] A. Lagorce-Tachon, T. Karbowiak, D. Champion, R.D. Gougeon, J.P. Bellat, Me- chanical properties of cork: effect of hydration, Mater. Des. 82 (2015) 148–154, doi: 10.1016/j.matdes.2015.05.034 .
[26] E. Maire, J.Y. Buffière, L. Salvo, J.J. Blandin, W. Ludwig, J.M. Lé- tang, On the Application of X-ray microtomography in the field of materials science, Adv. Eng. Mater. 3 (8) (2001) 539, doi: 10.1002/1527-2648(200108)3:8 < 539::AID-ADEM539 > 3.0.CO;2-6 .
[27] O.B. Olurin, M. Arnold, C. Krner, R. Singer, The investigation of morphometric pa- rameters of aluminium foams using micro-computed tomography, Mater. Sci. Eng. A (2002), doi: 10.1016/S0921-5093(01)01809-3 .
[28] M. Coster , J.-L. Chermant , Precis d’Analyse d’Images, Éditions du CNRS, Paris, 1985 .
[29] J. Serra, Advances in mathematical morphology: segmentation, 2008, doi: 10.1016/S1076-5670(07)00004-3 .
[30] C. Lantuejoul, F. Maisonneuve, Geodesic methods in quantitative image analysis, Pattern Recognit. (1984), doi: 10.1016/0031-3203(84)90057-8 .
[31] F. Meyer, S. Beucher, Morphological segmentation, J. Vis. Commun. Image Repre- sent. (1990), doi: 10.1016/1047-3203(90)90014-M .
[32] Y. Sun, B. Amirrasouli, S.B. Razavi, Q.M. Li, T. Lowe, P.J. Withers, The variation in elastic modulus throughout the compression of foam materials, Acta Materialia (2016), doi: 10.1016/j.actamat.2016.03.003 .
[33] Q.M. Li, I. Magkiriadis, J.J. Harrigan, Compressive strain at the onset of densification of cellular solids, J. Cell. Plast. (2006), doi: 10.1177/0021955X06063519 .
[34] M. Avalle, G. Belingardi, R. Montanini, Characterization of polymeric structural foams under compressive impact loading by means of energy-absorption diagram, Int. J. Impact Eng. (2001), doi: 10.1016/S0734-743X(00)00060-9 .
[35] Hild Francois , J.-l. Prensier , Annexe : algorithme de calcul de corrélation d ’ images numériques, Technical Report, ENS Cachan, 2004 .
[36] L.J. Gibson , M.F. Ashby , Cellular Solids: Structure and Properties, cambridge, Cam- bridge University Press, Oxford, 1997 .
[37] J.F. Mano, The viscoelastic properties of cork, J. Mater. Sci. 37 (2) (2002) 257–263, doi: 10.1023/A:1013635809035 .
[38] H. Pereira, Cork: Biology, Production and Uses, Elsevier B.V., Oxford, 2007, doi: 10.1007/978-3-319-23880-7_5 .