Science Arts & Métiers (SAM)
is an open access repository that collects the work of Arts et Métiers Institute of
Technology researchers and makes it freely available over the web where possible.
This is an author-deposited version published in: https://sam.ensam.eu Handle ID: .http://hdl.handle.net/10985/8675
To cite this version :
Zhibin ZHOU, Franck SCUILLER, Jean-Frederic CHARPENTIER, Mohamed BENBOUZID, Tianhao TANG - Power Smoothing Control in a Grid-Connected Marine Current Turbine System for Compensating Swell Effect - IEEE Transactions on Sustainable Energy - Vol. 4, n°3, p.816-826 - 2013
Any correspondence concerning this service should be sent to the repository Administrator : [email protected]
Power Smoothing Control in a Grid-Connected
Marine Current Turbine System for Compensating
Swell Effect
Zhibin Zhou, Franck Scuiller, Member, IEEE, Jean Frédéric Charpentier, Member, IEEE,
Mohamed Benbouzid, Senior Member, IEEE, and Tianhao Tang, Senior Member, IEEE
Abstract—Variations of marine current speed may lead to
strong fluctuations in the power extracted by a marine current turbine (MCT). During short-time period, swell effect is the main cause for the current speed variations. Conventional tip speed ratio Maximum Power Point Tracking (MPPT) algorithm will require the MCT to accelerate or to decelerate frequently under swell effect, which can cause severe fluctuations in the generator power. This paper focuses on power smoothing control of grid-connected MCT system. In the first step, a modified MPPT algorithm with filter strategy is proposed in generator-side control to mitigate the fluctuation of generator power. In the second step, Super-capacitor (SC) Energy Storage System (ESS) is added to compensate the residual power fluctuations.
Simulations of a 1.5 MW direct-driven grid-connected MCT system are carried out. The swell effect is calculated based on typical system location and sea state. Detailed control strategies and SC sizing are described. The results demonstrate that the association of the generator-side filter strategy with the SC ESS system achieves a smoothed power injected to the grid in case of swell disturbances.
Index Terms—Marine current turbine, power fluctuation,
swell effect, power smoothing control, supercapacitor.
NOMENCLATURE
ESS Energy storage system
MCT Marine current turbine
MPPT Maximum power point tracking
PMSG Permanent-magnet synchronous generator
SoC State of charge
SC Supercapacitor
𝑎𝑖, 𝑇𝑖, 𝐿𝑖 Magnitude, period and length of the swell
frequency component i
d Sea depth
𝑓𝑖, 𝜑𝑖 Frequency and phase angle of the swell
frequency component i
x, z Horizontal and vertical point for the swell
HS , Tp Significant height and peak period of swells 𝐶sc,𝐼sc,𝑉sc Capacitance, current and voltage of the SC
Z. Zhou, F. Scuiller and J.F. Charpentier are with the French Naval Academy, IRENav EA 3634, 29240 Brest Cedex 9, France (e-mail: [email protected], [email protected], [email protected],). Z. Zhou is also with the University of Brest and the Shanghai Maritime University.
M.E.H. Benbouzid is with the University of Brest, EA 4325 LBMS, Rue de Kergoat, CS 93837, 29238 Brest Cedex 03, France (e-mail: [email protected]).
T. Tang is with the Shanghai Maritime University, 201306 Shanghai, China (email: [email protected]).
This work is supported by Brest Métropole Océane (BMO).
𝐶𝑝 Turbine power coefficient
𝐸rated, Rated energy of the SC
𝐸sc Energy of the SC
𝑒𝑎𝑏𝑐 Grid-side converter terminal voltages
𝑓B Friction coefficient
𝐼generator Generator-side rectified current
𝐼grid Grid-side converter source current
𝐼target Grid target current
𝑖𝑑, 𝑖𝑞 Generator d-axis and q-axis currents 𝑖𝑑g, 𝑖𝑞g Grid d-axis and q-axis currents
𝐽 Total system inertia
𝐿𝑑, 𝐿𝑞 Generator d-axis and q-axis inductances
𝐿g, 𝑅g Grid inductance and resistance
𝑛𝑝 Pole pair number
R Turbine blade radius
𝑅s Generator stator resistance
𝑅sc Equivalent resistance of the SC
T Filter time constant
𝑇e, 𝑇m Generator and turbine torque
V Marine current speed
Vdc DC bus voltage
Vrated Rated voltage of the SC
𝑉max,𝑉min Maximum and minimum voltage setting
for the SC
𝑣𝑑, 𝑣𝑞 Generator d-axis and q-axis voltages
𝑣𝑑g, 𝑣𝑞g Grid d-axis and q-axis voltages ∆𝑃 Turbine and generator power difference
𝜃, 𝜃g Rotor position, grid voltage angle
λ Turbine tip speed ratio
ρ Sea water density
ψm Permanent magnet flux
ωe, ωm Rotor electrical and mechanical speed
ωg Grid voltage angle speed
I.INTRODUCTION
In recent years, various turbine technologies have been developed to capture kinetic energy from marine and tidal currents [1]. It is not surprising that some similar principles in wind generation systems can be applied in marine current turbine (MCT) systems due to the fact that both of them aim to capture energy from one kind of flowing mass. This similarity helps marine current generation system to develop faster and become more mature than other marine renewable energy systems. However, the turbine blade design, the system dimensions, and power profiles have their special
hal-00874155, version 1 - 17 Oct 2013
Author manuscript, published in "IEEE TRANSACTIONS ON SUSTAINABLE ENERGY 4, 3 (2013) 816-826" DOI : 10.1109/TSTE.2013.2251918
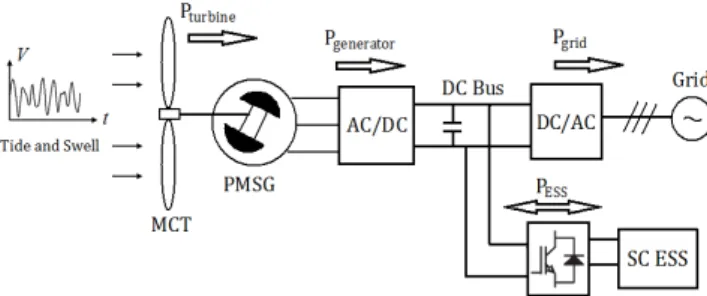
Fig. 1. General scheme for a direct-drive MCT system with ESS.
characteristics for MCT [2-4]. The main advantage of marine current energy is its high predictability: marine currents are mostly driven by the tide and the astronomic nature of tides makes marine tidal current highly predictable with 98% accuracy for decades. In [21], flicker evaluations in both steady-state and switching operations for SeaGen power plant have been well investigated. In this paper, another phenomenon about MCT power fluctuation caused by swell effect will be addressed. Marine tidal current speed can be disturbed by swell phenomenon and the induced variations in current flow speed will cause large power fluctuations in MCT extracted power [5]. Swell refers to long-length ocean waves (often over 150 m) generated from distant storms [6]. Long distance dispersion makes the swell spectrum narrower and the energy more accumulated than local wind-generated waves. Swells are able to prorogate very deep below the sea surface and therefore have a non-negligible effect on the MCT system.
As a major problem for integrating renewable sources to the grid, power fluctuations lead to poor power quality, higher losses and ratings of electrical components and would increase the difficulty of power balancing between supply and demand. Energy storage systems (ESSs) are assumed to be a good solution to smooth power fluctuations and provide auxiliary services to the grid [7-8]. Battery and supercapacitor (SC) storage are respectively studied in [9] and [10] to smooth power fluctuations and to meet the load demand changes for wind turbines. Hybrid battery and SC ESS strategy has been investigated in [11] for reducing battery power rating and improving battery life. In [12], a solution using supercapacitors for smoothing the power generated from the SEAREV wave energy converter has been presented. Various ESS technologies have been compared and studied in [5] for marine current energy application and the authors have obtained a conclusion that for smoothing swell-induced short-time period power fluctuations in MCT systems, supercapacitor technology is most suitable due to its high power and high dynamics characteristics.
In this paper, one 1.5 MW grid-connected MCT generation system is studied (Fig. 1 shows the general system structure [13]). The swell is modeled by the Stokes model [14] and the JONSWAP spectrum. Then, specific location parameters (sea depth and turbine installation depth) and sea state are used to calculate the swell-induced marine current speed variations for the given MCT. On the generator-side, a modified MPPT with filter strategy is proposed to maximally use the system inertia for reducing the generator power fluctuation in case of swell effect. On the grid-side, SC ESS is applied to further eliminate the residual power fluctuations and then to inject a smoothed power to the grid. The paper is organized as follows. In Section II, the swell is modeled and swell effect on MCT
power fluctuation is calculated. In Section III, the turbine and the generator-side power smoothing control strategy with filter algorithm are described. In Section IV, the grid-side converter control scheme is illustrated and in Section V, the supercapacitor control and the simulation results are presented. The conclusion is given in Section VI.
II. SWELL EFFECT AND POWER FLUCTUATION
In this paper, the first order Stokes model is used to calculate horizontal speed oscillations induced by the swell. The total marine current speed is then calculated by the combination of tidal speed and swell effect as follow. 𝑉(𝑡) = 𝑉tide+ ∑ 2π𝑎𝑇𝑖𝑖 cosh�2π𝑧+𝑑𝐿𝑖� sinh�2π𝐿𝑖𝑑� cos2π � 𝑡 𝑇𝑖− 𝑥 𝐿𝑖+ φ𝑖� 𝑖 (1)
It contains two parts: the first item 𝑉tide represents the
predicted tidal speed, which can be regarded as a constant during a period less than an hour; the second term represents the current speed oscillation caused by the swell. Fig. 2 shows the main characteristic of one simple swell (x and z represent the horizontal and vertical point for the calculation).
More than one frequency component should be considered to model a realistic swell effect. That explains the superposition calculation in the second term of (1). Each swell frequency component is calculated based on the swell spectrum and ocean wave theories; φ𝑖 represents the initial
phase angle of each frequency component which is given randomly.
Swells are transformed from wind waves through long-distant propagation after their generating area. The process of dispersion (low frequency wave components propagate faster than high frequency wave components) takes place during the swell propagation. Thus, the swell observed at a fixed station has a spectrum restricted to a narrow frequency range. In this paper, the JONSWAP spectrum is chosen as the swell spectrum due to its sharp peak characteristic. The JONSWAP spectrum can be written as follow.
𝑆(𝑓) = βJ𝐻𝑠 2 𝑇𝑝4 1 𝑓5exp (−45𝑇1𝑝4𝑓15)γY (2) Where, βJ=0.23+0.0336γ−0.185(1.9+γ)0.0624(1.094−0.0195 ln γ) Y = exp �−�𝑇𝑝𝑓−1�2 2σ2 � with σ = � 0.07, 𝑓 ≤ 1/𝑇𝑝 0.09, 𝑓 ≥ 1/𝑇𝑝
The parameter γ is called peak enhancement factor which controls the sharpness of the spectral peak. γ = 3.3 is
the mean value determined for the North Sea [22]. Larger value can be chosen to reflect the sharp peak characteristic of swell waves [6]. The swell spectrum for engineering applications can be approximated by (2) with the peak enhancement factor being chosen between γ = 3~10 ,
depending on the distance that the swell has traveled [6]. In this paper, the peak enhancement factor is chosen as γ = 7,
and the sea state of Hs = 3 m, Tp = 13.2 s isconsidered. This corresponds to typical sea state in the winter for the western coast of Europe [23]. The amplitude of each frequency components can be calculated by 𝑎𝑖= �2𝑆(𝑓𝑖)∆𝑓𝑖. Figure 3
shows the swell spectrum used in this paper. The peak frequency in the spectrum is about 0.08 Hz. It corresponds to
Fig. 2. Swell characteristic.
Fig. 3. Swell spectrum based on JONSWAP spectrum.
the peak period Tp = 13.2 s. The narrow frequency range and sharp spectral peak illustrates the swell characteristics.
It should be noticed from (1) that the swell effect on marine current speed also depends on the sea depth and the vertical distance between the calculation point and the sea surface. It means that the sea depth and the installation depth of the turbine must be considered to calculate the swell effect on a given MCT system.
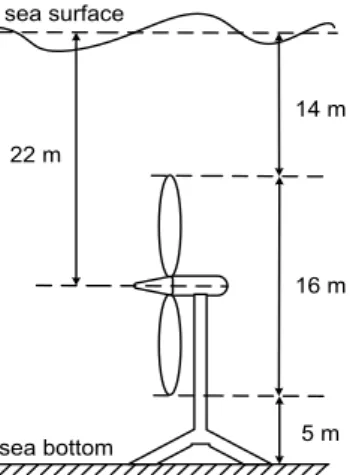
In this paper, one 1.5 MW MCT system is studied. The turbine dimension and location parameters are chosen based on the industrial project OpenHydro which has been tested by EDF (French Electricity) off the coast of Paimpol-Bréhat (France) in 2011. The turbine radius is 8 m and the system is supposed to be located at a sea depth of 35 m as shown in Fig. 4. The equivalent marine current speed for this turbine can be calculated at a depth of 22 m below the sea surface.
Figure 5 shows the simulation waveform of total marine current speed under the swell effect (the tidal speed is assumed as 2m/s in the simulation). Figure 6 shows the estimated produced power of the MCT operating at the current speed shown in Fig. 5. It can be seen that the swell effect can induce large oscillations in the marine current speed for the given depth; and these marine current speed oscillations can cause very high fluctuations in the power harnessed by the MCT.
One of the challenges of connecting the marine current generation system to the power grid is to obtain a stable and smoothed power even under swell disturbances.
III. MARINE CURRENT TURBINE AND GENERATOR CONTROL A. Marine Current Turbine Model
The power harnessed by a horizontal-axis MCT can be calculated by the following equation.
𝑃 =12ρ𝐶𝑝π𝑅2𝑉3 (3) 14 m 16 m 5 m 22 m sea surface sea bottom
Fig. 4. Basic dimensions and location parameters of the MCT.
Fig. 5. Marine current speed with swell effect.
Fig. 6. Estimated MCT power profile under the swell effect.
In (3), the turbine power coefficient Cp depends on the turbine blade structure and its hydrodynamics. For typical MCTs, the optimal Cp value for normal operation is estimated to be in the range of 0.35-0.5 [2]. For a given turbine and based on the experimental results, the Cp curve can be numerically approximated as a function of the tip speed ratio (λ = ωm𝑅/𝑉 ) and the blade pitch angle [15]. In
this paper, the MCT is with non-pitchable blades. The Cp curve for simulations is shown in Fig. 7 [2-4].
Extractable powers of the MCT at different marine current speeds are calculated based on (3) and illustrated by
Fig. 7. Cp curve of the marine current turbine.
Fig. 8. The MCT extractable power.
Fig. 8. The turbine maximum rotational speed to follow MPPT is 25 rpm (2.62 rad/s) for a marine current of 3.2 m/s. If the marine current exceeds 3.2 m/s, the extracted power will be limited to 1.5 MW. In this figure, the red dotted curve is the conventional MPPT curve, and the green dashed ellipse shows the proposed modified MPPT with filter strategy to avoid fast acceleration/deceleration of the system for decreasing the generator power fluctuation.
B. Marine Current Generator Model
The advantages of PMSG are compact structure, high efficiency and the possibility to eliminate the gearbox. These characteristics lead to low maintenance requirement and enable the PMSG to be very favorable in underwater applications. Recent industrial tidal current projects have adopted the PMSG as the generator type in the MCT system, for instance, the OpenHydro turbine system (proposed by French Electricity) and the Clean Current (project proposed by Alstom).
The PMSG dynamic model can be written in the synchronous rotation d-q frame. Equation (4) shows the Park transform used in the generator-side part. The d-axis is oriented to the rotor flux axis and θ is the electrical angle between stator phase a and the d-axis.
�𝑣𝑣𝑞𝑑� =23�cos θ cos (θ − 2π
3) cos (θ + 2π
3) − sin θ − sin(θ −2π3) −sin (θ +2π3)� �
𝑣𝑎 𝑣𝑏 𝑣𝑐
�
(4)
The PMSG model in the d-q frame can be described by the following equations ( Ld = Lq in this paper).
⎩ ⎪ ⎪ ⎨ ⎪ ⎪ ⎧ 𝑣𝑑= 𝑅s𝑖𝑑+ 𝐿𝑑d𝑖dt𝑑− 𝜔e𝐿𝑞𝑖𝑞 𝑣𝑞= 𝑅s𝑖𝑞+ 𝐿𝑞d𝑖dt𝑞+ 𝜔e𝐿𝑑𝑖𝑑+ 𝜔eψm 𝑇e=32𝑛𝑝ψm𝑖𝑞 𝐽d𝜔m d𝑡 = 𝑇m− 𝑇e− 𝑓B𝜔m (5)
C. Modified MPPT in Generator- side Control
The control of the generator aims to track the reference rotor speed to achieve the expected power extracted by the MCT. The rotor speed is controlled by the generator torque, which is controlled by the q-axis current through the generator-side converter.
Figure 9 shows the control scheme for the generator-side converter. The d-axis current reference is set to zero for
Fig. 9. Control scheme of the generator-side converter.
maximizing the active power in the generator. The q-axis current reference is calculated by the speed loop controller.
MPPT consists in controlling the rotor speed to keep the turbine tip speed ratio λ at its optimal value, thus keeping the turbine power coefficient Cp at the maximum value. Supposing that the Cp curve is known and the marine current speed V can be obtained by flow velocity measurements, the turbine speed reference calculated by the conventional speed-based MPPT can be expressed as λopt𝑉/𝑅 .
In this paper, a low pass filter is added to modify the rotor speed reference calculated by the conventional MPPT algorithm in case of swell effect. The proposed strategy generates the speed reference as
𝜔m_ref=𝑇s+11 ∙λopt𝑉𝑅 (6)
where the T is the filter time constant and plays a significant role in reducing the generator power fluctuation caused by swell disturbances. Setting T to zero leads (6) to the conventional MPPT algorithm.
With the conventional MPPT, the generator power will fluctuate more severely than the turbine power under swell effect. This can be explained as follow: when we neglect the friction losses in the torque equation in (5), we can get
𝑇m− 𝑇e= 𝐽d𝜔d𝑡m (7)
𝑃turbine− 𝑃generator= 𝜔m𝑇m− 𝜔m𝑇e= 𝜔m 𝐽d𝜔d𝑡m (8)
Equation (8) can be can be rewritten as
𝑃turbine− ∆𝑃 = 𝑃generator (9)
where the difference between the turbine and the generator power is ∆𝑃 = 𝜔m 𝐽d𝜔d𝑡m .
The power difference ∆𝑃 mainly depends on the system
inertia 𝐽 and the rotor speed change rate d𝜔m
d𝑡 for a low speed
MCT system with large inertia. Since the system inertia is a constant, d𝜔m
d𝑡 becomes a decisive factor for the value of ∆𝑃.
When the marine current speed is constant or changes very slowly, ∆P can be zero or very small for there is no significant changes in the generator rotational speed. This explains why 𝑃turbine and Pgenerator are almost equal at
steady-state.
When the marine current speed changes rapidly under swell effect, the turbine rotor speed will have a synchronous change rate by the conventional MPPT control; d𝜔m
d𝑡 is then
not negligible. During the acceleration, ∆𝑃 is positive and
this means some of the turbine power will be stored by the system inertia and the remaining power will pass to the generator. This causes the generator power to be smaller than the turbine power. In the extreme cases, the required power difference ∆𝑃 can be larger than 𝑃turbine. This could lead the generator to absorb power as in motor operation.
During the deceleration, ∆𝑃 is negative which means that
the system inertia will release some mechanical power and this part of power will combine with the turbine power to contribute to the generator power. This makes the generator power larger than the turbine power. Considering a system of very large inertia ( 𝐽 = 1.313 × 10⁶ kg ∙ m2) , ∆𝑃 can be
very large. The above analyses are confirmed by the simulation results shown in Fig. 10 and 11.
In this simulation, we suppose the marine current speed starts at 0 m/s and rises to 2 m/s in the first 10 s; the swell effect is considered after 20 s. Although this is not very realistic for real marine current, it enables to study the starting stage, constant marine current stage, and the fluctuating marine current stage (under swell effect) in one simulation. In the starting stage, it is reasonable to accelerate the generator and turbine to a certain speed for realizing the MPPT quickly. Therefore at the beginning, the generator power can be negative which means that the generator works as a motor temporarily for fast acceleration. In steady-state, 𝑃generator and 𝑃turbine are almost equal. Under swell
effect, 𝑃generatorfluctuates more severely than 𝑃turbine .
By adding a low pass filter as shown in (6), d𝜔m
d𝑡 can be
reduced; and the acceleration and deceleration moments of the rotor can controlled to desynchronize with the turbine power change. This means that the system inertia can be used to reduce the generator power fluctuation.
Figure 12 shows the generator power profiles with different filter time constants. Figure 13 illustrates the system performances based on the simulation results from Fig. 12. In Fig. 13, “Generator Power Fluctuation” is calculated by the difference between the maximum and the minimum values of the generator power under swell effect
𝑃�luctuation= 𝑃generator_max− 𝑃generator_min (10)
The energies produced by the turbine and the generator are calculated by integrating the turbine and the generator power respectively
𝐸turbine(𝑡) = ∫ 𝑃0𝑡 turbine(𝑡)𝑑𝑡 (11)
𝐸generator(𝑡) = ∫ 𝑃0𝑡 generator(𝑡)𝑑𝑡 (12)
When the filter constant is T=0, it means there is no filter and this is the conventional MPPT case. From Fig. 12 and 13, it can be seen that, by adding the filter strategy, the generator power fluctuation is greatly reduced at a cost of slightly energy losses. The energy reduction is due to the deviation from the conventional MPPT points. When the filter time constant is chosen to be very large, the generator speed reference will have negligible changes and that will lead the system to operate as a fixed-speed turbine. In order to obtain the smallest fluctuations in the generator power, the optimal filter time constant is chosen as 7 s which equals about half of the typical swell period in the simulation. Using this optimized filter time (T=7 s), the generator power
Fig. 10. Rotor speed reference calculated by conventional MPPT.
Fig. 11. Turbine and generator power with conventional MPPT.
Fig. 12. Generator powers with different filter time constants.
Fig. 13. System performances with different filter time constants.
Fig. 14. Turbine and generator power with proposed MPPT (T=7 s).
fluctuation is reduced by 68% with a reduction of 7.5% in generator-produced energy compared to the no filter case (Fig. 13).
Figure 14 shows the turbine and the generator power profiles using the optimized filter. Compared to the conventional MPPT power profiles shown in Fig. 11, the generator power fluctuation is greatly reduced while the turbine harnessed power is not reduced much.
D. Comparison of the Proposed MPPT with Torque-Based MPPT
The proposed MPPT is a modified tip-speed ratio MPPT. The marine current speed is supposed to be measured by flow-meters. The generator power fluctuation can be greatly reduced by filtering the current speed in the proposed MPPT. A torque reference MPPT control strategy [16-17] is assumed to have a similar effect in reducing the generator power fluctuations. The torque reference MPPT (also called optimal torque control) calculates the reference torque as
𝑇e_ref=12𝐶λp_maxopt3ρπ𝑅5ωm2 (13) This strategy does not need measuring the marine current speed. The reference torque is proportional to the square of the rotor speed and thus the generator output power will be proportional to the cubic of the rotor speed. Since the rotor speed variation is relatively low, the generator power fluctuation will be smaller than with the conventional tip-speed ratio MPPT. However, the response of the torque reference MPPT is relatively slow due to the fact that marine current speed changes are not directly reflected in the reference.
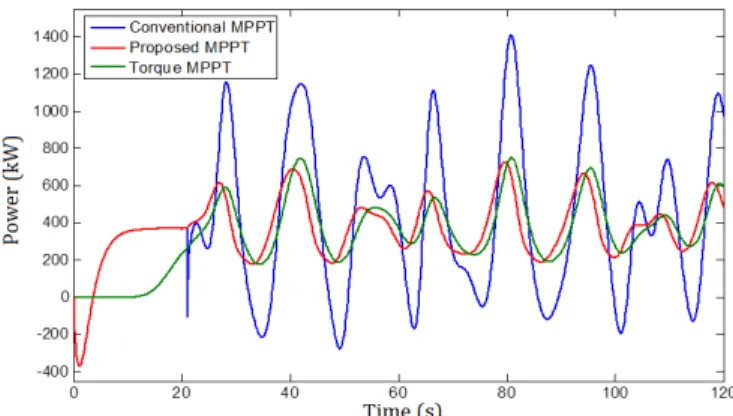
Figure 15 compares the generator power simulation results with different MPPT strategies. It shows that both proposed MPPT and torque-based MPPT enable to greatly reduce the generator power fluctuation under swell disturbance. For the torque-based MPPT, there is no negative power at the starting stage and it shows the relatively long response time for the turbine to operate at the maximum power points. In some cases, this could be considered as an advantage. Indeed, a slower response can lead to reduced mechanical stress and overall cost reduction. At the swell effect stage, the torque MPPT has a similar power fluctuation reduction performance with the proposed MPPT using the filter algorithm.
Figure 16 compares the generator energy production using different MPPT strategies. In this figure, we focus on the swell effect stage. The energy is therefore calculated by integrating the generator power after 20 s. From Fig. 15 and Fig. 16, it can be seen that although the conventional tip-speed ratio MPPT leads to a very high generator power fluctuation, it produces highest energy due to the fast achievement of the maximum power points. There is no significant difference between the proposed MPPT and the torque-based MPPT at the swell effect stage.
IV. GRID-SIDE CONVERTER CONTROL
The circuit and the control scheme of the grid-connection part are shown in Fig. 17. The main function of the grid-side converter is to keep the DC bus voltage stable and to regulate the active and reactive power injected to the grid.
Fig. 15. Comparison of generator-produced power with different MPPT.
Fig. 16. Comparison of generator-produced energy with different MPPT.
Fig. 17. Control scheme of the grid-side converter.
The dynamic model for the grid-connection part in
d-q frame can be written as
� 𝑒𝑑= −𝑅g𝑖𝑑g− 𝐿g
d𝑖𝑑g
dt + 𝜔g𝐿g𝑖𝑞g+ 𝑣𝑑g
𝑒𝑞= −𝑅g𝑖𝑞g− 𝐿gd𝑖𝑞gdt − 𝜔g𝐿g𝑖𝑑g+ 𝑣𝑞g
(14) For the grid part, the d-axis is oriented to the grid voltage vector, and the grid active power is controlled by the d-axis current. The q-axis current reference is set to zero when there is no grid reactive power requirement. The outside DC bus voltage loop is to keep the DC bus voltage at a given value and to produce the current reference for d-axis.
V. SUPERCAPACITOR FOR GRID POWER SMOOTHING A. Supercapacitor Model and Control
The SC is connected to the DC bus with a bi-directional current DC/DC converter (so-called buck-boost chopper). Figure 18 shows the main structure of the SC part: the SC is modeled by a large capacitor 𝐶sc in series with a small
resistance 𝑅sc ; 𝐿sc is the buffer inductor; D1 and D2 are the
duty ratios for the two switches of the bi-directional DC/DC converter. If the converter losses are neglected, the power in the SC can be expressed as follows.
𝑃sc(𝑡) = 𝑃generator(𝑡) − 𝑃grid(𝑡) (15)
In this paper, the SC aims to compensate the power difference between the generator power and the grid target power. As the average tidal speed is predictable, the expected grid target power can be estimated based on the tidal speed. The SC is then controlled to absorb the difference between the generator produced power and the expected smoothed power transferred to the grid. Based on the buck-boost control [18-19], the supercapacitor voltage can be controlled as
𝑉sc = 𝐷1𝑉dc= (1 − 𝐷2)𝑉dc= 𝐷𝑉dc (16)
The State of Charge (SoC) of the SC is calculated by 𝑆𝑜𝐶 =𝐸𝐸sc rated= 0.5𝐶𝑠𝑐𝑉𝑠𝑐2 0.5𝐶𝑠𝑐𝑉rated2 = � 𝑉sc 𝑉rated� 2 (17) From (16) and (17), the control signal D (duty ratio) can be deduced as
𝐷 =𝑉rated
𝑉dc √𝑆𝑜𝐶 (18)
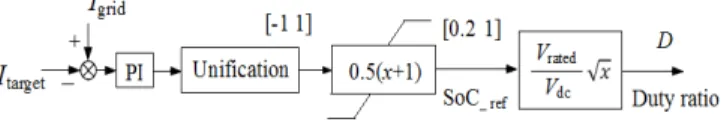
Figure 19 shows the duty ratio control scheme for the SC. When Igrid > Itarget, the duty ratio will rise to increase the SC
voltage and make the SC absorb the power from the DC bus. When Igrid < Itarget, the SC voltage will decrease to make SC
release the stored power. Itarget is the current reference
representing the smoothed DC current which is expected to be transmitted to the grid-side converter. This grid target reference can be calculated from the predicted tidal current speed when there is no swell; and from filtering the generator power in case of swell disturbance. In Fig. 19, the output value of the PI controller is proportional to the charge or discharge energy requirement. This value is unified by
0.5𝑉rated2 and then the function 0.5(𝑥 + 1) is used to transfer
the range from [-1 1] to [0 1]. In this way, the charge/discharge energy requirement is transferred to SoC
Fig. 18. Supercapacitor and the bidirectional DC/DC converter.
Fig. 19. Control scheme of the bidirectional DC/DC converter.
requirement. With a low SoC limitation of 0.2 in the SoC reference, the actual SoC variation range will be controlled in [0.2 1].
The required energy capacity of the SC ESS can be calculated based on the estimated MCT power profiles (Fig. 6). Based on the analysis in [24], the SC energy requirement in our case is estimated about 1.5 kWh with a power rating of 700 kW. Although the energy rating is small, the power rating is large in this case. This is the reason why the SC is chosen as the ESS type instead of batteries: SCs have lower energy capacity but much higher power density than batteries. Therefore, the SCs are more suitable as power smoothing devices for compensating the swell effect. This value is estimated to damp power fluctuations even under conventional tip-speed ratio MPPT. This paper firstly intends to assess the SC storage technology for compensating swell-induced power fluctuations. The SC minimization is therefore not undertaken.
Actually, several SC cells should be used to make up a SC bank to meet such a requirement. Therefore in the SC model shown in Fig. 18, 𝐶sc and 𝑅sc refer respectively to the
equivalent capacitance and equivalent resistance of the SC bank (the SC for short). The parameters of 𝐶sc and 𝑅sc
depend on the energy requirement and voltage setting of the SC, and also depend on the SC cell parameters. In the following, the details of the SC sizing are carried out.
The usable energy capacity of the SC can be written as follows
𝐸usable=12𝐶sc(𝑉max2 − 𝑉min2 ) (19)
For the MCT system studied in this paper, the DC bus voltage is set to 1500 V, and the rated voltage (maximum voltage) of the SC ESS is set to 750V. The SoC range is set from 0.2 to 1 (as shown in Fig. 19), which means the voltage rang of the SC ESS is from 335V (𝑉min) to 750V (𝑉max)
This voltage rating is quite high, therefore we use the parameters of BMOD0063 P125 Maxwell module (63F, 128V, 18mΩ) [20] for single SC cell. Then the SC cell can be considered to have a maximum voltage of 125V. In order to obtain 750V, six cells are needed in one series branch. Therefore, Nseries = 6 can be obtained. The usable energy for one series branch is
𝐸series =12(16𝐶cell)(𝑉max2 − 𝑉min2 )
=12× 1
6× 63(7502− 3352)
= 0.656 kWh (20) To meet the energy capacity requirement of 1.5 kWh, three series SC branches described in (20) are needed. Therefore the Nparallel = 3 can be decided. Then, the parameters of the SC model in Fig. 18 can be calculated as (21). It results that the SC will have a usable energy capacity of 1.97 kWh which is higher than the original requirement of 1.5 kWh. This over-sizing can serve as a margin in case of
� 𝑅sc=
𝑁𝑠𝑒𝑟𝑖𝑒𝑠
𝑁𝑝𝑎𝑟𝑎𝑙𝑙𝑒𝑙𝑅cell= 36 mΩ
𝐶sc=𝑁𝑁𝑝𝑎𝑟𝑎𝑙𝑙𝑒𝑙𝑠𝑒𝑟𝑖𝑒𝑠 𝐶cell= 31.5 F
(21) higher tidal speed or stronger sea state.
Figures 20 and 21 show the grid phase voltage and current simulation waveforms. The grid voltage magnitude is assumed to be constant; thereby the variations of grid current magnitude reflect directly the fluctuations of the grid-injected power. Comparison between Fig. 20 and 21 illustrates the SC ability to eliminate power fluctuations: the power transferred into the grid is significantly smoothed. Figure 22 shows voltage and current in the SC. The SC SoC variations are illustrated in Fig. 23. The initial SoC is set to 0.5, and the SC is activated after 20 s (when the swell effect is introduced). From Fig. 23, it can be seen that if the conventional MPPT is used, the SoC variation will be in the range from 0.37 to 0.8. This variation is reduced to a range from 0.48 to 0.65 when the proposed MPPT is applied. The reason is that the generator power fluctuations are alleviated in the first stage by the proposed MPPT. Therefore, it implies that the proposed MPPT is able to reduce the SC burden. It also implies that, the proposed MPPT enables a reduction of 26% in the required energy capacity of the SC ESS compared to the conventional MPPT case.
Figure 24 illustrates the powers in different parts of the system. The active grid power is shown in this figure since the grid reactive power is controlled to zero by the grid-side converter. Figure 25 shows the energy produced by the turbine, by the generator and the energy transmitted into the grid. It shows that 96% of the turbine energy is transferred by the generator, and that about 93% of the turbine energy is injected into the grid. It means that the energy captured by the turbine is efficiently transmitted to the grid without being deteriorated by the proposed power smoothing control strategy and extra SC ESS.
Fig. 20. Grid phase voltage and current (without the SC).
Fig. 21. Smoothed grid phase current by the SC.
Fig. 22. Voltage and current of the SC.
Fig. 23. State of charge of the SC.
Fig. 24. Powers in different parts of the system.
Fig. 25. Energy productions of the grid-connected MCT system. B. Sizing, Cost and Layout Issues of the ESS
The sizing of the SC ESS seems a little large in this paper. However, this sizing is quite reasonable considering the dimension and the cost of a large MCT with a power rating around 1.5 MW. Large MCTs are under initial development and the market prices are still unavailable at this moment. Based on the ESS cost study in [24] and information about the OpenHydro project [25], the SC in this paper will only result a very fractional increase (less than 0.3 %) for the MCT system in terms of mass, volume and cost. Another point that should be noticed is that, in this paper, the tidal speed (without swell) is set to be 2 m/s and a moderate sea
state of Hs = 3 m, Tp = 13.2 s is used for calculating the swell effect. For higher tidal speed or with a stronger sea state (Hs may reach 5 to 6 m ), the power fluctuations would have a larger magnitude than that shown in this paper. Therefore, enough margins should be considered in sizing the ESS.
It should also be mentioned that there will be small energy losses with extra ESSs; however, the ESSs enable the MCT more easily to be integrated to the power grid since the output power of the combined system becomes more predictable, controllable, and less fluctuant. Another benefit of using ESS is the possibility of providing auxiliary grid services (e.g. frequency regulation, low voltage ride through ability).
The SC ESS presented in this paper is supposed to be used for one single MCT. Another possible layout of the ESS is to use a centralized ESS system for marine farms. Relative studies in wind turbines [26-27] shows that compared to distributed ESS configuration, centralized ESS can have relatively smaller total power ratings due to the farm smoothing effect but requires larger converter ratings. In MCT cases, the farm smoothing effect may be affected by the topology of the turbine farm, the swell direction and wavelength. It is really hard to have a final conclusion about which configuration is definitely better than the other one. At this stage, both configurations seem feasible for MCTs.
VI. CONCLUSION
Swells have non-negligible influences on the MCT generation system. Speed-based MPPT algorithm could cause severe generator power fluctuations in case of swell disturbance. In this paper, the swell effect is modeled based on the sea state and the MCT location parameters. The carried-out simulations show that the tip-speed ratio MPPT may cause severe power fluctuations in the generator power. A modified MPPT with filter strategy has been proposed utilizing the system inertia to reduce the generator power fluctuation as the first step of power smoothing control. The effectiveness of the proposed MPPT strategy is confirmed by comparing it to the tip-speed ratio MPPT and the torque-based MPPT. Simulation results have shown that the proposed MPPT and the torque-based MPPT lead to similar power fluctuation-reduction performance. The achieved results have shown the ability of the proposed MPPT to greatly reduce the generator power fluctuations with the optimized filter. It should also be mentioned that, for some MCTs with much flatter Cp curves, the power fluctuation can be less severe than that dealt with in this study. The second step of power smoothing control is by integrating supercapacitors as the energy storage system to compensate the remaining generator power fluctuations. The sizing of the SC is calculated by energy requirement and voltage settings. The duty ratio of the SC is controlled through the charge and discharge requirements to achieve a smoothed grid target power. Simulation results have shown the effectiveness of the joint operation of the proposed MPPT and the SC.
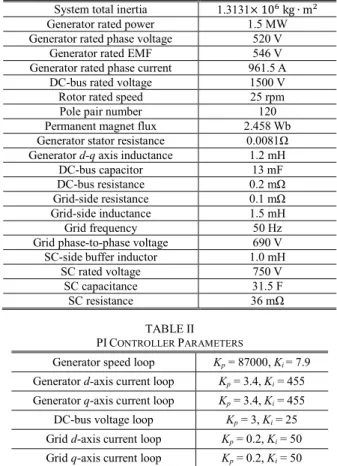
APPENDIX TABLE I SYSTEM PARAMETER LIST
Sea depth 35 m
Depth for swell effect calculation 22 m Turbine blade radius 8 m
System total inertia 1.3131× 10⁶ kg ∙ m2 Generator rated power 1.5 MW Generator rated phase voltage 520 V
Generator rated EMF 546 V Generator rated phase current 961.5 A
DC-bus rated voltage 1500 V Rotor rated speed 25 rpm Pole pair number 120 Permanent magnet flux 2.458 Wb Generator stator resistance 0.0081Ω Generator d-q axis inductance 1.2 mH
DC-bus capacitor 13 mF DC-bus resistance 0.2 mΩ Grid-side resistance 0.1 mΩ Grid-side inductance 1.5 mH Grid frequency 50 Hz Grid phase-to-phase voltage 690 V SC-side buffer inductor 1.0 mH
SC rated voltage 750 V SC capacitance 31.5 F SC resistance 36 mΩ
TABLEII PICONTROLLER PARAMETERS
Generator speed loop Kp = 87000, Ki = 7.9 Generator d-axis current loop Kp = 3.4, Ki = 455 Generator q-axis current loop Kp = 3.4, Ki = 455 DC-bus voltage loop Kp = 3, Ki = 25 Grid d-axis current loop Kp = 0.2, Ki = 50 Grid q-axis current loop Kp = 0.2, Ki = 50 Supercapacitor current loop Kp = 70, Ki = 130
REFERENCES
[1] S. Benelghali, M.E.H. Benbouzid and J. F. Charpentier, “Marine tidal current electric power generation technology: State of the art and current status,” in Proceedings of the 2007 IEEE IEMDC, Antalya (Turkey), vol. 2, pp. 1407-1412, May 2007.
[2] S. Benelghali, R. Balme, K. Le Saux, M.E.H. Benbouzid, J.F. Charpentier and F. Hauville, “A simulation model for the evaluation of the electrical power potential harnessed by a marine current turbine,”
IEEE Journal on Oceanic Engineering, vol. 32, n°4, pp. 786-797, Oct.
2007.
[3] L. Myers and A. S. Bahaj, “Power output performance characteristics of a horizontal axis marine current turbine,” Renewable Energy, vol. 31, n°2, pp.197–208, Feb. 2006.
[4] W. M. J. Batten, A. S. Bahaj, A. F. Molland, and J. R. Chaplin, “The prediction of the hydrodynamic performance of marine current turbines,” Renewable Energy, vol. 33, n°5, pp.1085-1096, May 2008. [5] Z. Zhou, M.E.H. Benbouzid, J.F. Charpentier, F. Scuiller and T. Tang,
“Energy storage technologies for smoothing power fluctuations in marine current turbines,” in Proceedings of the 2012 IEEE ISIE, Hangzhou (China), pp. 1425-1430, May 2012.
[6] Y. Goda, Random Seas and Design of Maritime Structures. Advanced Series on Ocean Engineering, vol.33, World Scientific: Singapore, 2010.
[7] S. Vazquez, S.M. Lukic, E. Galvan, L.G. Franquelo and J.M. Carrasco, “Energy storage systems for transport and grid applications,” IEEE
Trans. Industrial Electronics, vol. 57, n°12, pp.3881-3895, Dec. 2010.
[8] Y. Cheng, “Super capacitor applications for renewable energy generation and control in smart grids,” in Proceedings of the 2011
IEEE ISIE, Gdansk (Poland), pp.1131-1136, Jun. 2011.
[9] A. Abedini and H. Nikkhajoei, “Dynamic model and control of a wind-turbine generator with energy storage,” IET Renewable Power
Generation, vol.5, n°1, pp.67-78, 2011.
[10] L. Qu and W. Qiao, “Constant power control of DFIG wind turbines with supercapacitor energy storage,” IEEE Trans. Industry
Applications., vol. 47, n°1, pp.359-367, Jan./Feb. 2011.
[11] W. Li, G. Joós and J. Bélanger, “Real-time simulation of a wind turbine generator coupled with a battery supercapacitor energy storage system,” IEEE Trans. Industrial Electronics, vol. 57, n°4, pp.1137-1145, Apr. 2010.
[12] J. Aubry, P. Bydlowski, B. Multon, H. Ben Ahmed, and B. Borgarino, “Energy storage system sizing for smoothing power
generation of direct wave energy converters, ” in Proceedings of the
2010 ICOE, Bilbao (Spain), Oct. 2010.
[13] Z. Zhou, F. Scuiller, J.F. Charpentier, M.E.H. Benbouzid and T. Tang, “Grid-connected marine current generation system power smoothing control using supercapacitors,” in Proceedings of the 2012 IEEE
IECON, Montreal (Canada), pp.4035-4040, Oct. 2012.
[14] R. Bonnefille, Mouvements de la Mer (in French). Techniques de
l’Ingénieur, C4610, pp.1-19, 2010.
[15] J.G. Slootweg, S.W.H. de Haan, H. Polinder and W.L. Kling, “General model for representing variable speed wind turbines in power system dynamics simulations,” IEEE Trans. Power Systems, vol. 18, n°1, pp.144-151, Feb. 2003.
[16] S. Morimoto, H. Nakayama, M. Sanada, and Y. Takeda, “Sensorless output maximization control for variable-speed wind generation system using IPMSG,” IEEE Trans. Industry Applications, vol. 41, n°1, pp. 60-67, Jan./Feb. 2005.
[17] K. H. Kim, D. C. Lee, and J. M. Kim, “Fast tracking control for maximum output power in wind turbine systems,” in Proceedings of
the Australasian Universities Power Engineering Conference (AUPEC), pp.1-5, Dec. 2010.
[18] M. Ortuzar, J. Dixon and J. Moreno, “Design, construction and performance of a buck-boost converter for an ultracapacitor-based auxiliary energy system for electric vehicles,” in Proceedings of the
2003 IEEE IECON, Roanoke (USA), pp. 2889-2894, Nov. 2003.
[19] W. Chen, A. K. Ådnanses, J. F. Hansen, J. O. Lindtjørn, and T. Tang, “Super-capacitors based hybrid converter in marine electric propulsion system,” in Proceedings of the 2010 IEEE ICEM, Rome (Italy), pp.1-6, Sep. 2010.
[20] http://www.maxwell.com/ (last accessed January 2013)
[21] T. Thiringer, J. MacEnri, and M. Reed, “Flicker evaluation of the SeaGen tidal power plant,” IEEE Trans. Sustainable Energy, vol. 2, n°4, pp.414-422, Oct. 2011.
[22] British Standard BS 6349-1:2000 “Maritime structures. Part 1. Code of practice for general criteria” , Jul. 2003
[23] http://candhis.cetmef.developpement-durable.gouv.fr/ (last accessed January 2013)
[24] Z. Zhou, M.E.H. Benbouzid, J.F. Charpentier, F. Scuiller, and T. Tang, “A review of energy storage technologies for marine current energy systems,” Renewable and Sustainable Energy Review, vol. 18, pp.390-400, Feb. 2013
[25] http://cleantechnica.com/2011/11/14/worlds-largest-tidal-power-array-off-french-coast/ (last accessed January 2013)
[26] W. Li and G. Joos, “Comparison of energy storage system technologies and configurations in a wind farm,” in Proceedings of the
2007 IEEE PESC, Orlando (USA), pp.1280-1285, Jun. 2007.
[27] W. Li, G. Joos and C. Abbey, “Wind power impact on system frequency deviation and an ESS based power filtering algorithm solution,” in Proceedings of the 2006 IEEE PSCE, Atlanta (USA), pp.2077-2084, Oct./Nov. 2006.
Zhibin Zhou was born in Shanghai, China, in 1983. He received the B.Sc. degree in electrical engineering in 2006 from Shanghai Maritime University, Shanghai, China, the M.Sc. degree in electronics system in 2008 from Ecole Polytechnique de l’université de Nantes, Saint-Nazaire, France, a second M.Sc. degree in power electronics and electric drive in 2009 from Shanghai Maritime University, China. Currently he is working toward Ph.D. degree in Electrical Engineering in the University of Brest and in the French Naval Academy, Brest, France. His current research interests include modeling and control of renewable energy applications, power electronics and energy storage systems.
Franck Scuiller (M'11) was born in Brest, France, in 1977. He received the electrical engineer degree (M.Sc. degree) from ENSIEG, INPG (Grenoble National Polytechnic Institute) in 2001 and the Ph.D. degree from “Arts et Metiers ParisTech” in 2006.
In 2007, he worked as a lecturer in French Naval Academy. From 2008 to 2011, he was a technical project manager in warship electric power system for French DCNS company. Since September 2011, he has been an Associate Professor in the French Naval Academy in Brest, France. His research interesting include marine current turbine and ship propulsion with multi-phase machine, ship grid modelling and simulation, new grid topologies for improving the electrical energy availability and quality.
Jean Frédéric Charpentier (M'02) was born in Tananarive, Madagascar, in 1969. He received the M.Sc. and PhD degrees in electrical engineering from the National Polytechnic Institute of Toulouse, Toulouse, France in 1993 and 1996 respectively.
From 1996 to 1997 he was a post doctoral fellow at Laval University, Québec, Canada. From 1997 to 2002 he was an Assistant Professor at the Institut Universitaire de Technologie of Brest, University of Brest, Brest, France. Since 2002, he has been an Associate Professor in the French Naval Academy in Brest, France. His current research interests include design aspects on electrical machines and drives, electrical naval propulsion systems and marine renewable energy.
Mohamed El Hachemi Benbouzid (S’92–M’95– SM’98) was born in Batna, Algeria, in 1968. He received the B.Sc. degree in electrical engineering from the University of Batna, Batna, Algeria, in 1990, the M.Sc. and Ph.D. degrees in electrical and computer engineering from the National Polytechnic Institute of Grenoble, Grenoble, France, in 1991 and 1994, respectively.
After receiving the Ph.D. degree, he joined the Professional Institute of Amiens, University of Picardie “Jules Verne,” where he was an Associate Professor. In September 2004, he joined the University Institute of Technology (IUT) of Brest, University of Brest, Brest, France, as a Professor of electrical engineering. His main research interests and experience include analysis, design, and control of electric machines, renewable energy applications, and fault diagnosis. He is an Associate Editor of the IEEE Transactions on Energy Conversion, on Industrial Electronics, on Sustainable Energy, and on Vehicular Technology. He was an Associate Editor of the IEEE/ASME Transactions on Mechatronics from 2006 to 2009. Tianhao Tang (SM’01) was born in Jiangsu, China, in 1955. He received the B.Sc. and the M.Sc. degrees in electrical engineering from Shanghai University of Technology, Shanghai, China, in 1982 and 1987 respectively, the PhD degree in control engineering from Shanghai University, Shanghai, China in 1998.
From 1988 to 1991 he was a lecturer at Shanghai Maritime University Shanghai, China, where he became an Associate Professor and a Professor in 1992 and 1998 respectively. He is currently the director of the department of Electric Drives and Control Systems in Shanghai Maritime University, vice director of Sino-French Joint Research Institute of Galileo & Maritime ITS for Safer Seas. His main research interests are intelligent control, electrical propulsion systems and power electronics in renewable applications.