HAL Id: hal-00330846
https://hal.archives-ouvertes.fr/hal-00330846
Submitted on 1 Jan 2003HAL is a multi-disciplinary open access archive for the deposit and dissemination of sci-entific research documents, whether they are pub-lished or not. The documents may come from teaching and research institutions in France or abroad, or from public or private research centers.
L’archive ouverte pluridisciplinaire HAL, est destinée au dépôt et à la diffusion de documents scientifiques de niveau recherche, publiés ou non, émanant des établissements d’enseignement et de recherche français ou étrangers, des laboratoires publics ou privés.
of the peri-urban wetland of Vitoria-Gasteiz (Basque
Country, North Spain)
C. García-Linares, M. Martínez-Santos, V. Martínez-Bilbao, J. M.
Sánchez-Pérez, I. Antiguedad
To cite this version:
C. García-Linares, M. Martínez-Santos, V. Martínez-Bilbao, J. M. Sánchez-Pérez, I. Antiguedad. Wetland restoration and nitrate reduction: the example of the peri-urban wetland of Vitoria-Gasteiz (Basque Country, North Spain). Hydrology and Earth System Sciences Discussions, European Geo-sciences Union, 2003, 7 (1), pp.109-121. �hal-00330846�
Wetland restoration and nitrate reduction: the example of the
peri-urban wetland of Vitoria-Gasteiz (Basque Country, North Spain)
C. García-Linares
1, M. Martínez-Santos
1, V. Martínez-Bilbao
1, J.M. Sánchez-Pérez
2and
I. Antiguedad
11University of Basque Country – Euskal Herriko Unibertsitatea, 48940 Leioa, Basque Country, Spain
2Laboratoire d’Ecologie des Hydrosystèmes, Université Paul Sabatier, 29 rue Jeanne Marvig, 31055 Toulouse cedex 4, France
Email for corresponding author: gopanaui@lg.ehu.es
Abstract
Changes in land use and agricultural intensification caused wetlands on the quaternary aquifer of Vitoria-Gasteiz (Basque Country) to disappear some years ago and nitrate concentration in groundwaters increased very quickly. The Basque Government recently declared the East Sector of this aquifer a Vulnerable Zone according to the 91/676/CEE European Directive. Recently, the wetlands have been restored through the closure of the main drainage ditches, the consequent elevation of the water table and the abondonment of agricultural practices near the wetlands. This is the case of the Zurbano wetland. Restoration has allowed the recovery of its biogeochemical function, which has reduced nitrate concentrations in waters. Nitrate concentrations which exceed 50 mg l–1 in groundwaters entering into the wetland are less than 10 mg l–1 at the outlet. Conditions in the wetland are conducive to the loss of nitrates: organic matter rich wetted soils, clay presence allowing a local semiconfined flow and very low hydraulic gradient. Water quality monitoring at several points around the wetland showed the processes involved in nitrate loss, although some aspects still remain unresolved. However, during storm events, the wetland effectively reduces the nitrate concentration entering the Alegria River, the most important river on the quaternary aquifer.
Keywords: restored wetland functionality, nitrate losses, Basque Country
Introduction
In recent years, surface and groundwaters in areas of largely agricultural land have become so contaminated that they are not available for use without further treatment. The impact of farming activities on groundwater quality in European alluvial valleys is well known (Gustafson, 1983; Andersen and Kristiansen, 1984; Ritter et al., 1990; Bernhard et al., 1992; Arrate et al., 1997); agricultural practices and fertilisers have increased concentrations of agricultural contaminants in groundwater. Recently, Böhlke (2002) reviewed the processes involved in the agricultural contamination of groundwater. Also, the biogeochemical functioning of riparian wetlands in removing nitrates from groundwaters has been described, particularly when site conditions are favourable(Burt et al., 1999; Mengis et al., 1999; Gold et al., 2001).
The quaternary aquifer of Vitoria-Gasteiz (Fig. 1) is a well-documented example of water resource loss and degradation
of groundwater quality due to various land transformations. The criterion for groundwater contamination is insufficient for its use for domestic purposes; the maximum permissible nitrate concentration in drinking water is 50 mg l–1 (EC,
1980). A change in agrarian practices combined with the diversion of principal rivers traversing the aquifer and an increase in the drainage network of the aquifer has led to its rapid contamination by agricultural contaminants (Böhlke, 2002) and, hence, to a reduction in existing potable water resources (Arrate, 1994; Arrate et al., 1997).
Nitrate concentrations in groundwater increased steadily from the beginning of the 80s up to the early 90s when nitrate concentration increased even to 200 mg l–1 in an important
area of the aquifer, its East Sector (Arrate et al., 1997). To address this problem, in 1999 the East Sector of the quaternary aquifer was designated by the Basque Government as a Nitrate Vulnerable Zone according to the 91/676/CEE European Directive; consequently a Code of
Good Practices and an Action Plan were approved. Also, at the end of 1998, wetlands close to Vitoria-Gasteiz (Zurbano and Betoño, Fig. 1) were reinstated by the City Council, by closing main ditches and elevating the water table, thus restoring the wetland’s water quality function.
This work is based on the study of the 24 ha Zurbano wetland; it highlights the effect of the restoration of peri-urban wetland zones and the consequent improvements in groundwater quality.
Material and methods
STUDY SITE
The quaternary aquifer of Vitoria-Gasteiz is located near the city of the same name. The aquifer is formed by fluvial and alluvial deposits on an area of approximately 90 km2
and has a mean thickness of 5 m. The formation presents two distinct sectors: a West Sector (40 km2) and an East
Sector (50 km2). This work is centred on the East Sector
(Vulnerable Zone, Fig. 1) which is formed by heterometric gravels with an argillaceous sandy matrix, 2 to 10 m thick. These deposits form a permeable aquifer with intergranular porosity of a free character, although local phenomena of semiconfinement may exist. The water table depth ranged from 0 to 4 m. The storage coefficient and average transmissivity are in the order of 0.2 and 40-150 m2d–1
(Arrate, 1994).
The borders and substratum of the aquifer are marls (Cenomanian) and are virtually impermeable. Substratum is observable within the quaternary deposits near the Zurbano wetland (Fig. 2). The aquifer is recharged both by rainwater infiltration and, at certain times of the year, by the streams. Water is lost through evapotranspiration, through pumping of water during several periods in summer and, above all, through the ample network of drainage ditches and streams.
Figure 1 shows the East Sector along with the Vulnerable Fig. 1. East Sector of the quaternary aquifer of Vitoria-Gasteiz and Vulnerable Zone.
Fig. 2
. Localisation of the Zurbano and Betoño wetlands. The line r
ep
resents the cr
oss section of the figur
Zone polygon and the surface water and groundwater quality checkpoints. Groundwaters in this sector flow from east to west into the Alegria River. Finally, all the waters leave the Sector through the A-4 point, where the quaternary deposits narrow. The Alegria River is a tributary of the Ebro River. LAND USE AND TRANSFORMATIONS ON THE AQUIFER
Until the 1950s, most of the land was dedicated to non-irrigated agriculture, particularly cereal crops. The increase in irrigated agriculture during the following years led both to a need for a greater area for cultivation and to an increase in the demand for water and fertilisers. The irrigation water required was extracted from the aquifer. At that time, the water table lay close to the surface (0–1.5 m); this led to frequent flooding in some zones when some streams overflowed during the high water season. Thus, to avoid the flooding of the lands, the network of drainage ditches was increased, reaching a density of 8 km km–2 in this Sector
(Arrate et al., 1997).
The subsequent decrease in the water table was around 1–2.5 m, which led to a significant loss in the water reserves of the aquifer. Consequently, the remaining wetlands (Zurbano and Betoño) began to disappear. In the case of Zurbano, the attempts to drain the wetland had begun several centuries earlier. A system of lateral ditches had been established, which all led to a main ditch known as the Wetland Canal (Fig. 2). It was the closing of this Canal at the end of 1998 which led to a rise in the water table and, as a consequence, to the recovery of the wetland.
The rise in the demand for water was met by water pumped from the aquifer. Additionally, at the beginning of the 1970s, the Alegria River was diverted towards the Ullibari dam (Zadorra dam system, to the north of the study site) through
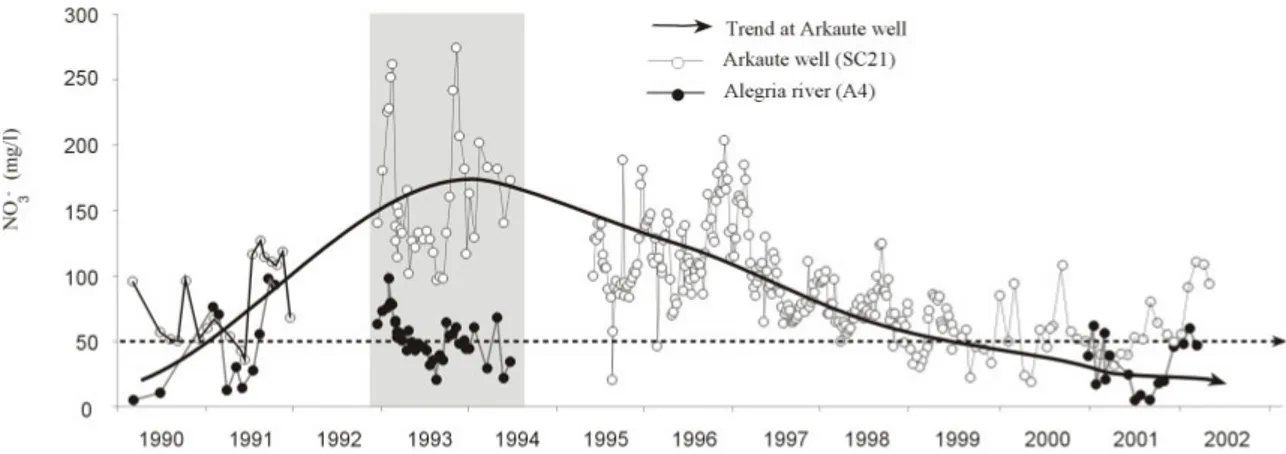
the Alegria Canal (Fig. 1) so that the aquifer suffered a loss of recharge. The fertiliser leachates led to a rapid increase in the nitrate concentration of the aquifer, which often surpassed 150–200 mg l–1 at the beginning of the 1990s. By
the mid-1990s, the nitrate concentration had dropped progressively to 80–100 mg l–1 (Fig. 3) due to a
rationalisation in fertiliser use and to a change in the origin of the irrigation water that comes from artificial pools of surface water.
DEPOSITS CHARACTERISATION
In 1995, 19 manual test drillings were made in the areas of Betoño and Zurbano wetlands (Fig. 1). In 2001, additional test drillings were added in the area surrounding the Zurbano wetland to collect information on the soil characteristics. These drillings, of up to 1.5 m in depth, were done at four different sites (AC16, AC17, P-5, TP-2; Fig. 2) and the samples were submitted for analysis. Additionally, between June 2000 and June 2001, the variation in soil moisture was monitored using a Tube Probe (TDR, Inko, Germany) at four different sites located close to the wetland (TP-1, TP-2, TP-4, TP-5; Fig. 2).
The thickness of the quaternary deposits in the area surrounding the Zurbano wetland varies between 2–4 m to the east of the Wetland Canal and 8–10 m to the west (Fig. 2), coinciding with the appearance of a furrow in the marly substratum. The materials form a sequence composed of marls, gravel, sand and clay, homogenous in their order, although not in their thickness. Furthermore, the ploughing carried out on the cultivated lands prior to the recovery of the wetlands has altered the most superficial horizons significantly.
A dark, clay level rich in organic matter and showing oxide-reduction stains is found at the surface. Its thickness,
(< 1 m) near to the Wetland Canal, particularly to the east and around the exit area (Z-8; Fig. 2), increases towards the confluence of the Errekaleor and Santo Tomas rivers (Fig. 2). At the deepest level, the materials take on a detritic, silt-sand character, with fine/gross grain silt-sands, culminating in a well-defined level of clean, well-rolled gravels of up to 4–5 cm. The gravels are present in all the drillings throughout the area and their thickness is estimated at 2–4 m. The gravels are usually found below the water table.
The materials in the wetland zones have been associated with a refilling processes of previous erosion surfaces, provoked by rivers of inter-crossed canals, followed more recently by depositions by meandering rivers. These processes predominate in the area around the wetland and were most likely formed by the overflowing of the current Santo Tomas and Errekabarri rivers. It is likely that the Errekabarri River (which means ‘new river’ in the Basque language) ran previously towards the confluence of the Santo Tomas and Errekaleor rivers and was diverted towards the northern Alegria River to facilitate the drainage of the wetland. Figure 4 presents a schematic cross-section of the Zurbano wetland (the location of this cross-section can be seen in Fig. 2).
WATER SAMPLING
Samples were taken from entry and exit points of the Zurbano wetland corresponding to drainage ditches, wells and piezometers. The location of these points can be seen in Fig. 2. Starting in January 2001, the samples were generally taken monthly, although in some cases the
frequency was weekly. The main chemical elements were determined in the Chemistry Laboratory of the University of Basque Country.
Nitrate was determined on a Waters Quanta 4000E/CIA capillary electrophoretic system (Milford, MA, USA). A personal computer workstation with Millenium32
Chromatography Manager software was used for instrumental control and data analysis. Samples were injected hydrostatically (9.8 cm height for 30 s) onto a fused-silica capillary (Composite Metal Services, Worcester, England) of 58 cm × 75 mm I.D. × 375 mm O.D.; a detection window was at 50 cm. The UV detector was set at 254 nm and a voltage of –20 kV (current, 18mA) was applied. The working electrolyte for this procedure was a chromate buffer with CIA-PakTM OFM Anion-BT solution (Waters) (patent:
U.S. 5.104.506 (14/4/1992)). In these conditions, the migration time for nitrate is 2.5 min and the detection limit 0.22 µg ml–1.
The water quality and hydrometric data for well SC21 have been taken from the Basque Government’s Groundwaters Control Basic Network (www.eve.es/redbas). The water level fluctuation data for the Zurbano wetland have been provided by the Vitoria-Gasteiz Council Environmental Studies Centre. The remaining data were obtained by the authors during their investigation.
STATISTICAL ANALYSES
A Factor Analysis, ‘Principal Components Analysis’, based on the chemical analysis of data (366 analyses in all) from surface as well as groundwaters of the area near the Zurbano Fig. 4. Cross-section of the Zurbano wetland.
wetland has been carried out to understand the processes affecting loss of nitrate. SPSS v 11.0 statistical program was used and the varimax rotation was finally selected because the result is more interpretable.
Results
SOIL CHARACTERISTICS
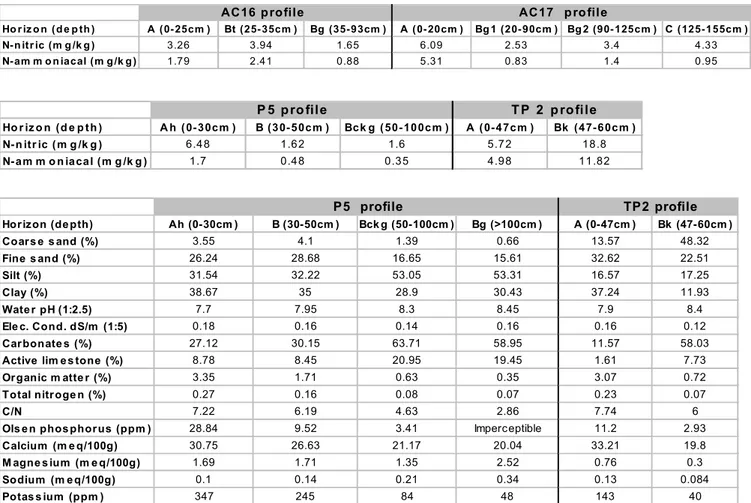
The analytical data from the soil samples are grouped by horizons in Table 1. The soils near the wetland (P-5, TP-2) are of a Chernozem calcic character (FAO). The high clay content in horizon A is consistent with the high potassium content and the high cationic exchange capacity (CEC). The carbonate and active limestone content increases in profile (B), and is indicative of leaching. Horizon A contains abundant organic matter and is associated with a greater content of N-mineral; this soil has not been cultivated since 1998 and the vegetation which currently dominates the area comprises Gramineae spp. The low C/N relation relates to the decomposition of organic matter. In the area surrounding
the P-5 piezometer, the horizon B is also of clay and silt-clay, and oxide-reduction conditions are present, whereas the area surrounding TP-2 is sandy loam, with no oxide-reduction bands. In fact, in the area surrounding P-5, flow conditions are semiconfined and there are high values of elements such as phosphorus and magnesium, and evidence of denitrification processes.
AC16 soil is a gley Luvisol (FAO), clay or silt-clay textured throughout the profile and with abundant organic matter in horizons A and Bt. This soil, like that of the area mentioned previously, is uncultivated. AC17 soil, at the edge of the forest (Fig. 2), is of eutric Gleysol (FAO) with clear Vertisol relict characteristics and is developing towards a hydromorphous soil. A clay texture is present throughout the profile, with abundant organic matter in horizon A. As in the case of AC16, the lower N-mineral values appear in the oxide-reduction horizon (Bg). In the four soils, the water table practically reaches the surface on occasion.
P5 profile TP2 profile Horizon (de pth) Ah (0-30cm ) B (30-50cm ) Bck g (50-100cm ) Bg (>100cm ) A (0-47cm ) Bk (47-60cm ) Coars e s and (%) 3.55 4.1 1.39 0.66 13.57 48.32 Fine s and (%) 26.24 28.68 16.65 15.61 32.62 22.51 Silt (%) 31.54 32.22 53.05 53.31 16.57 17.25 Clay (%) 38.67 35 28.9 30.43 37.24 11.93 Wate r pH (1:2.5) 7.7 7.95 8.3 8.45 7.9 8.4 Ele c. Cond. dS/m (1:5) 0.18 0.16 0.14 0.16 0.16 0.12 Carbonate s (%) 27.12 30.15 63.71 58.95 11.57 58.03
Active lim e s tone (%) 8.78 8.45 20.95 19.45 1.61 7.73
Organic m atte r (%) 3.35 1.71 0.63 0.35 3.07 0.72
Total nitroge n (%) 0.27 0.16 0.08 0.07 0.23 0.07
C/N 7.22 6.19 4.63 2.86 7.74 6
Ols e n phos phorus (ppm ) 28.84 9.52 3.41 Imperceptible 11.2 2.93
Calcium (m e q/100g) 30.75 26.63 21.17 20.04 33.21 19.8
M agne s ium (m e q/100g) 1.69 1.71 1.35 2.52 0.76 0.3
Sodium (m e q/100g) 0.1 0.14 0.21 0.34 0.13 0.084
Potas s ium (ppm ) 347 245 84 48 143 40
AC16 profile AC17 profile
Ho r iz o n (d e p th ) A (0-25cm ) Bt (25-35cm ) Bg (35-93cm ) A (0-20cm ) Bg 1 (20-90cm ) Bg 2 (90-125cm ) C (125-155cm )
N-n itr ic (m g /k g ) 3.26 3.94 1.65 6.09 2.53 3.4 4.33
N-am m o n iacal (m g /k g ) 1.79 2.41 0.88 5.31 0.83 1.4 0.95
P 5 pro file T P 2 p rofile
Ho r iz o n (d e p th ) A h (0-30cm ) B (30-50cm ) Bck g (50-100cm ) A (0-47cm ) Bk (47-60cm )
N-n itr ic (m g /k g ) 6.48 1.62 1.6 5.72 18.8
N-am m o n iacal (m g /k g ) 1.7 0.48 0.35 4.98 11.82
CROPS EVOLUTION
Wheat, barley and, to a lesser degree, non-irrigated oats and irrigated potatoes and beetroot have traditionally been cultivated in the Eastern Sector. These crops have undergone changes in recent years, both in extent and diversity; the predominance of dry agriculture, mainly barley, in 1997 changed to an increase in wheat in 2000. Irrigated crops such as beetroot and potatoes have been cultivated at consistent levels throughout. It is usual to find poly-crop cultivation within a single plot in which cereal crops are combined with irrigation crops.
Prior to the recovery of the area surrounding the wetland, the evolution of the crops progressed from a wide diversity (poly-cultivation) to the exclusive sowing of wheat and oats in 1998 (the year in which crops disappeared as the water table approached the surface; this impedes the optimum development of many crop types and led farmers to experiment with other crops to find those which were best suited to the land and the water regime. The current vegetation of the wetland area is rich with species indicative of eutrophication (Lemna minor, at the entrance to the Wetland Canal, and filamentous weeds: Cladophora sp and
Spirogyra sp).
GROUNDWATER QUALITY
Figure 3 shows nitrate concentration from 1990 to 2002 in well SC21 (Arkaute well), representative of the East Sector, which is a point in the Groundwaters Control Basic Network of the Basque Government, and at the outlet of the Alegria River (A-4). Both locations are shown in Figs. 1 and 2. The concentrations were highest in the 1993–1994 period. In recent years, nitrate concentrations have decreased, possibly because of more efficient fertilizer use (this is not easy to prove because of lack of data) as well as the change in the origin of water used for irrigation that comes now from artificial pools (surface waters stored outside the quaternary aquifer) avoiding the recirculation of waters. Figure 3 shows clearly that water at the outlet (A-4) has less nitrate than groundwaters.
The average concentrations in the Arkaute well (SC21) from 1999 up to 2002 are around 60 mg l–1. Nevertheless,
exposure to the leachate of nitrogen fertiliser leads to greater concentrations (80–100 mg l–1) in the nearby EMA well
within the drainage area of the wetland (Fig. 2), and in the llarratza spring (Q < 0.5 l s–1) located 2 km to the east (which
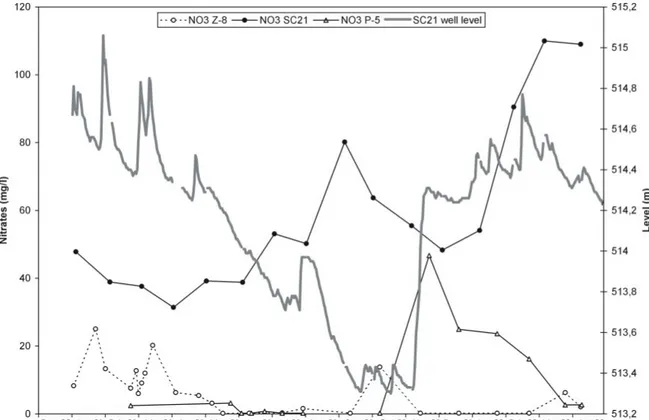
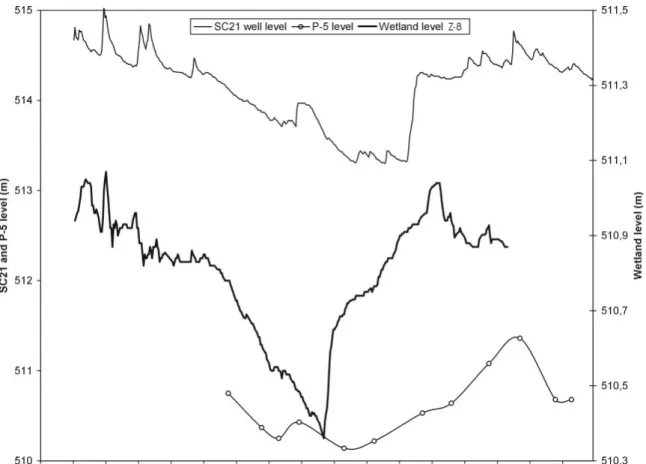
drains only groundwater). Figure 5 shows nitrate concentrations in well SC21 and, by comparison, in both
Fig. 5. Nitrate concentration in groundwater in the Arkaute well (SC21), a wetland piezometer (P-5) and the outlet of the wetland (Z-8) as function of time. Groundwater level in the Arkaute well (SC21) is also shown.
the outlet of the Zurbano wetland (Z-8) and in the P-5 piezometer situated near the wetland (Fig. 2). The piezometry in Arkaute well (SC21) is also shown. The higher nitrate content in the aquifer usually occurs during the first months of the year and towards the end of the summer. Depending on crop type, the fertilising season usually runs from October to June.
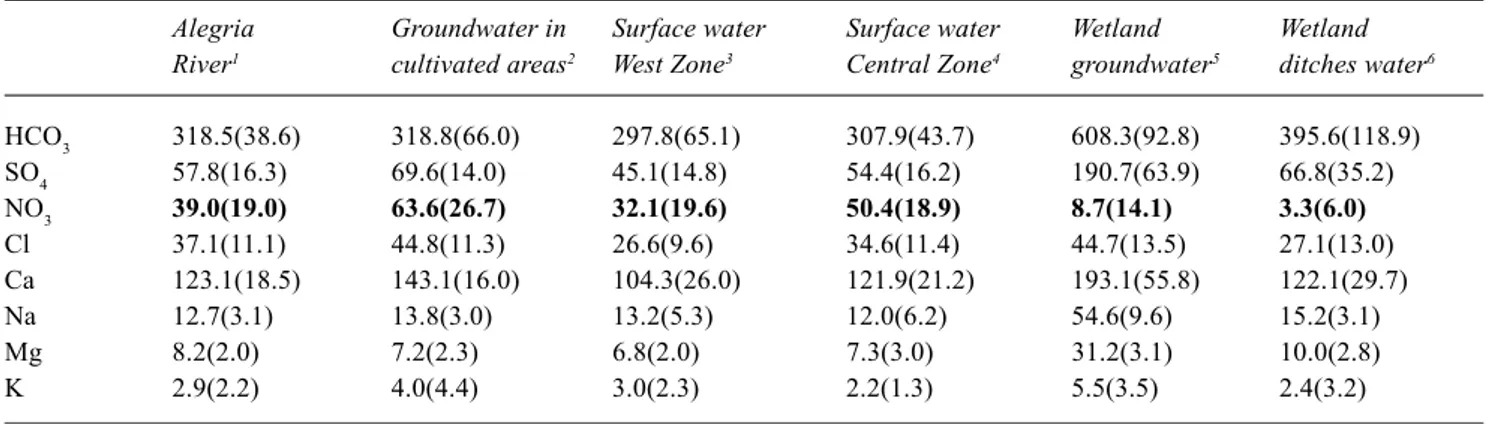
Table 2 shows the average contents (and standard deviations) of the main chemical elements present in the waters of the different zones of the East Sector (García-Linares et al., in press), with emphasis on the waters close to the Zurbano wetland. For nitrates, the highest concentrations are in the groundwaters from cultivated areas, with the average value being higher than 60 mg l–1. Lower
concentrations (of around 50 mg l–1 or less) are present in
the waters from the streams which cross the quaternary aquifer, and the waters from the Alegria River contain 39 mg l–1. Finally, the lowest nitrate concentrations are in
the groundwaters and drainage ditch waters near the wetland, with concentrations of less than 10 mg l–1.
HYDROLOGICAL FUNCTIONING OF THE WETLAND
The Zurbano wetland has been a natural discharge zone for the quaternary aquifer. This is due both to the wetland’s location, lying close to the former watershed between the Santo Tomas-Errekaleor (flowing towards the west) and the Errekabarri (flowing towards the north) streams (Figs. 1 and 2), and to its geology, given the presence of a marly substratum threshold (Fig. 4). Additionally, the groundwater discharge in the zone has been favoured by the thin clay layer overlaying the quaternary deposits, particularly at the eastern area of the Wetland Canal. This situation gives the
aquifer a semiconfined character, as was observed through the manual drillings effected near to P-5. At other points, such as TP-2, it is practically unconfined.
The wetland lies in a depression between the Santo Tomas and Errekabarri rivers (Fig. 2) and its origin is related to the overflow deposits of these two rivers. The same figure shows the layout of the main drainage ditches excavated to dry the wetland. The recent recovery of the wetland followed the closing of the exit of its main drainage ditch: the Wetland Canal. The closure is located in point A, next to water quality checkpoint Z-8 (outlet of the wetland). The work consists of a dam with a sluice gate, with which the water level in the wetland may be regulated manually; during heavy recharge periods, the sluice is opened to avoid the nearby cultivated areas (Arkaute) being affected by a significant increase in the levels of the wetland and the aquifer itself.
Additionally, a series of sluice gates (Fig. 2), has been constructed to control the level of the wetland. Gates C and D regulate the internal level in different parts of the wetland. Gates F and B allow water to enter from the river and have been designed as a security measure against floods; F has yet to be opened and B has been opened on very few occasions. The water which passes through B flows into a small pool which is not connected hydraulically with the Zurbano wetland. Lastly, A is the only discharge gate for the wetland. There is no appreciable discharge from the wetland to the Errekabarri River.
Hence, the only water entering the Zurbano wetland comes from the various ditches that drain the croplands lying to the south, which are controlled at points Z-1 and Z-2, and from the aquifer itself, which is monitored in wells SC21 and EMA (Arkaute area), in the P-5 and TP-2 piezometers and in the practically inactive drainage ditches Z-3 and Z-4 (see Fig. 2). The groundwater flow lines, which lead into
Table 2. Mean contents (mg l–1) and standard deviation (in brackets) of the main chemical elements in the different zones of
the East Sector: (1) A0, A1, A2, A3 and A4; (2) Ilarratza spring, well SC21, Z1 and Z2; (3) G2, G3, G5, Z5 and Z7; (4) G6, G8, G18, IL, JI and JII; (5) P5; (6) Z3, Z4 and Z8 (the outlet). See Figures 1 and 2 for location of points.
Alegria Groundwater in Surface water Surface water Wetland Wetland
River1 cultivated areas2 West Zone3 Central Zone4 groundwater5 ditches water6
HCO3 318.5(38.6) 318.8(66.0) 297.8(65.1) 307.9(43.7) 608.3(92.8) 395.6(118.9) SO4 57.8(16.3) 69.6(14.0) 45.1(14.8) 54.4(16.2) 190.7(63.9) 66.8(35.2) NO3 39.0(19.0) 63.6(26.7) 32.1(19.6) 50.4(18.9) 8.7(14.1) 3.3(6.0) Cl 37.1(11.1) 44.8(11.3) 26.6(9.6) 34.6(11.4) 44.7(13.5) 27.1(13.0) Ca 123.1(18.5) 143.1(16.0) 104.3(26.0) 121.9(21.2) 193.1(55.8) 122.1(29.7) Na 12.7(3.1) 13.8(3.0) 13.2(5.3) 12.0(6.2) 54.6(9.6) 15.2(3.1) Mg 8.2(2.0) 7.2(2.3) 6.8(2.0) 7.3(3.0) 31.2(3.1) 10.0(2.8) K 2.9(2.2) 4.0(4.4) 3.0(2.3) 2.2(1.3) 5.5(3.5) 2.4(3.2)
the wetland, are schematised in the figure. These lines come mainly from the south, the Arkaute area and, to a lesser degree, from the east (Ertzaintza Academy). Indeed, it is likely that the channelling of the Errekabarri River beneath the Academy has attenuated the groundwater flow in this area.
The closure of the exit of the Wetland Canal has led to an increase in the water level of the wetland of 1.5 m at point A. As a consequence, the hydraulic gradient has dropped throughout the entire wetland area. There has also been a drop in the flow velocity. In fact, it is difficult to observe an appreciable flow in the ditches bordering the east of the wetland. The drainage ditches located in the flooded zone have lost their transmissive function. Figure 6 relates the water levels observed in piezometer P-5 and well SC21 to the levels observed in the wetland. Bearing in mind the piezometric levels, the resulting gradient is around 2-3.10-3
between well SC21 (Arkaute) and the wetland exit (Z-8), and less (5-7.10-4) between the piezometer P-5 (wetland)
and Z-8. Before the recovery of the wetland, the gradients observed were 2-3.10-3 in the wetland zone and 6.10-3 in the
zone of Arkaute. The decrease in the gradients is evident. The level of the wetland does not always follow that of the aquifer, due to its artificial regulation, to avoid an excessive rise of the water table in the nearby agricultural lands. SOIL WATER CONTENT
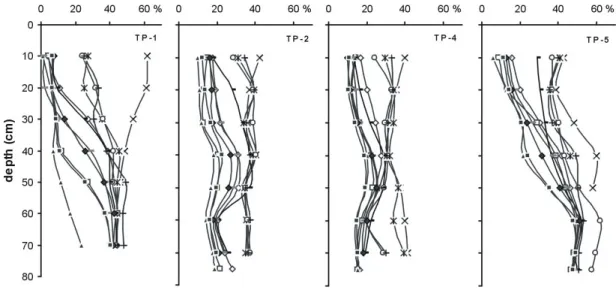
Figure 7 contains the soil moisture profiles (volumetric moisture, %) at four points near to the Zurbano wetland (the location of the points is shown in Fig. 2) between June 2000 and June 2001. The profiles in TP-2 and TP-4 are uniform and similar, with volumetric moisture of 30-40% during winter and 15-20% during summer. These soils present a coarse sandy texture (TP-2 in Table 1) beneath a 35 cm clay layer. In profiles TP-1 and TP-5, however, the variations are greater. This is especially true in TP-1, due to the notable presence of clays at the surface, which lead to moisture values range between 60% and 5%. In terms of depth, however, the moisture is relatively constant in time; the significant silt-clay content retains around 40-50% moisture. Bearing in mind the gradients given and the
Fig. 6. Groundwater level in the Arkaute well (SC21), a wetland piezometer (P-5) and water level of the outlet of the wetland (Z-8) as function of time.
Fig. 7. Soil water content profiles in four pits of the wetland area between June 2000 and June 2001 (TP-1, TP-2, TP-4 and TP-5 location are shown in Figure 2).
fluctuation in the P-5 piezometer level (about 1.5 m, Fig. 6), the water level at these points practically reaches the surface during high water periods.
BIOGEOCHEMICAL FUNCTIONALITY OF THE WETLAND
As has occured elsewhere, the waters at the wetland’s exit (Z-8) have been the object of periodic chemical monitoring.
The hydrochemical assessment (García-Linares et al., in press), covers points along the entire Vulnerable Zone of the quaternary aquifer (Fig. 1), although this discussion is centred on the wetland area. Figure 8 represents the evolution in nitrates (mg l–1) along the Alegria River (from
January 2001 to February 2002), from the entrance to the Vulnerable Zone (A-0; Fig. 1) to the exit (A-4), situated immediately after the confluence of the river with the
Fig. 8. Evolution in nitrate concentration in surface waters along the Alegria River between January 2001 and February 2002 (location of points given in Fig. 1).
discharge of both the Zurbano wetland and the Errekabarri and Santo Tomas-Errekaleor rivers.
Each sampling showed that the nitrate concentration is maintained relatively stable along the Alegria River, notwithstanding the water contributions made by various tributaries (Fig. 1); on the other hand, the concentration is usually less between A-3 and A-4, the stretch in which the Santo Tomas-Errekaleor and Errekabarri rivers (Surface water West Zone, in Table 2) and the Zurbano wetland discharge (Fig. 2).
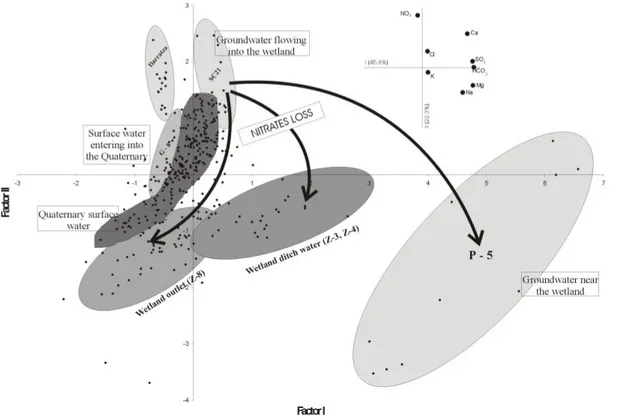
A principal components analysis was performed on the analytical data from surface as well as groundwaters (366 analyses in all) taken between January 2001 and February 2002. The factorial plane I-II (Fig. 9) reflects the most important information, with factor I (45.8 % of the variance) characterised by bicarbonates, sulphates, calcium and magnesium, and factor II (22.3 %) characterised by nitrates. The waters with a higher nitrate content correspond to those samples taken from the Ilarratza spring and from well SC21, both representative of the groundwaters of the quaternary aquifer in cultivated areas (Table 2); in particular, well SC21 represents the groundwaters that enter the Zurbano wetland. In the wetland area, there are nitrate losses, as illustrated in plane I-II: waters in piezometer P-5, drainage ditches Z-3 and Z-4, and at the outlet of the wetland (Z-8) are clearly
nitrate-impoverished. In spite of this loss in nitrates in the wetland area, the waters present very different mineralisations, which imply different loss processes. Thus, at P-5, the higher mineralisation of the waters (wetland groundwater, Table 2) reflects a reductor environment (clay silty soil and abundance of organic matter). The waters at the outlet (Z-8) are a combination of different subterranean water inputs. The other points, corresponding to surface waters both within the quaternary aquifer and coming from outside it — the latter with a lower mineralisation — are grouped in an intermediate position on plane I-II as regards nitrate content.
Discussion
Until the wetland recovered (towards the end of 1998), the ditches drained quickly into the Wetland Canal and then into the Alegria River, so that only during periods of heavy rains was overland runoff observed, for longer along the left-hand side of the Canal, with fewer ditches. The water came mainly from the aquifer and from direct surface runoff; none of the rivers bordering the wetland discharge into the wetland in any appreciable manner.
The recent recovery of the Zurbano wetland has been accompanied by other actions in the environment. The Santo
Tomas and Errekaleor rivers, which had flowed westwards alongside the Betoño wetland (Fig. 2) and which were integrated into the Vitoria-Gasteiz waste-water collection network have now been diverted towards the north-east, converging with the Alegria River at the same point as the waters from the Wetland Canal and the Errekabarri River.
Although the marly substratum has usually been considered impermeable, the P-5 piezometer bore hole near the wetland shows the presence of fractured zones (Fig. 4) which contribute water (without flow quantifying). In fact, the drilling crossed 4 m of quaternary deposits and continued through the marls to a depth of 12 m. The waters sampled at different depths (the well has PVC tubing screened from 1.5–12 m) revealed a completely homogenised water column. Given the lack of further data, the importance of the contributions from the marls (the nearby outcrops of which are cultivated) is not clear.
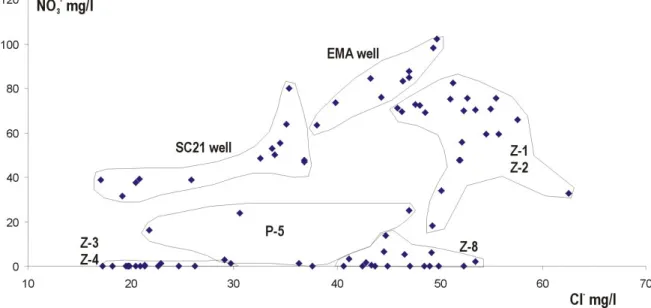
Having proven that water does not enter the wetland from the rivers, it is evident that a nitrate loss is being produced in the wetland and its surroundings (Figs. 5 and 9). Figure 10 provides a clearer picture of the underlying processes leading to nitrate reduction. The figure displays the different waters in the area surrounding the wetland in relation to their chloride and nitrate concentrations. The waters which enter the wetland from the south (Arkaute area; groundwaters from the wells SC21 and EMA and waters from the drainage ditches Z-1 and Z-2; Fig. 2) have high nitrate levels, which in some cases surpass 100 mg l–1, and
variable chloride levels depending on the intensity of the agricultural activity in the areas near to the sampling points. The waters entering from the area to the east of the wetland
(Z-3 and Z-4), with a very low hydraulic gradient and no agricultural activity since 1998, have low chloride contents and practically no traces of nitrates. The waters of the P-5 piezometer, located near to the ditches Z-3 and Z-4, also present very low concentrations of nitrates. However, these concentrations rise towards the end of the year, coinciding with a pronounced increase of the water table in the aquifer (well SC21; Fig. 5). As has already been mentioned, this piezometer also drains the marls below the quaternary deposits, the hydraulic behaviour of which is still unknown. Finally, the waters leaving the wetland (Z-8) have high levels of chloride content, similar to those in the majority of the waters coming from the south, and very low nitrate concentrations, similar to those in the waters coming from the east. Hence, the main entry of water to the wetland is from the south, the zone of Arkaute (Fig. 2), and the nitrate loss observed at the exit is not due to dilution.
Apart from the concentrations measured in the entry and exit waters to the wetland area, using chloride as a conservative tracer has shown that around 85% of the water which enters the wetland does so from the south (Arkaute area; Fig. 2). The remaining 15% enters from the east (Ertzaintza Academy; Fig. 2). In periods of very high water levels in the aquifer, the contribution of water to the wetland from the south is almost 100% (no contribution from the east). Unfortunately, there is no measurement of discharge from the wetland (point A; Fig. 2); this impedes, for the moment, a more precise adjustment of the water balance.
The points in the control network closest to the wetland are those located on its eastern side (P-5, TP-2, 3 and Z-4; Fig. 2), where the flow is slower. At these points, the
nitrate concentration in the water is, in general terms, less than 3 mg l–1 (nitrites and ammonium are below detection
level) and dissolved oxygen less than 0.5 mg l–1. At P-5 the
bicarbonate (420-600 m l–1), sulphate (up to 300 mg l–1) and
DOC (> 3 mg l–1) levels are high. DOC data are available
only for P-5. These facts, together with the existence of a semiconfined flow regime conditioned by the surface clay layer, at least around P-5 (Table 1), the high moisture content of the soil (Fig. 7) due both to the area being a discharge zone and to water table fluctuations, and the presence of abundant organic matter mean that the area is conducive to denitrification. Nevertheless, the significant sulphate presence in the P-5 water suggests that this zone is in the first phases of a biogeochemical reaction sequence (McMahon, 2001).
Whatever the case, the importance of the decrease in the nitrate processes must differ depending on the zones, as is indicated by the different chemical composition of the waters reflected in the factorial plan of Fig. 9. The existing flow regime, whether unconfined (TP-2, Z-3 and Z-4) or semiconfined (P-5), must influence these processes significantly. A more extensive register of soil data profiles and of associated groundwater qualities around the wetland would facilitate more information about the less-understood aspects.
Conclusions
The recent recovery of the area known as the Zurbano Wetland, closely related to the Vitoria-Gasteiz quaternary aquifer, has enabled the biogeochemical functionality of the zone to be investigated. The discharge from the wetland shows a notable decrease in nitrate by comparison with the concentrations observed in the waters from the aquifer. This helps to improve the water quality of the Alegria River which receives the discharge from the wetland.
Although it is not possible with the available data to understand the biogeochemical system fully, the existence of conditions conducive to nitrate loss is evident: very low hydraulic gradients, due to the closure of the main drainage canal, and the consequent rise in the water table; permanent humidity of the soils, due to the discharge nature of the zone and the superficial fluctuation of the water level in the aquifer; local presence of semiconfined flow; and abundant organic matter (the soils were cultivated until 1998).
The significant, short distance spatial variation of these conditioning factors means that the nitrate loss processes may vary considerably from one point to another. Thus, in the most favourable locations, such as the area surrounding piezometer P-5, very low contents of dissolved oxygen and relatively high contents of DOC are registered.
Notwithstanding this spatial variation, the quality of the water leaving the wetland has been improved by natural purification in an aquifer with high levels of nitrate content.
Acknowledgements
This work was funded by the HID99-0333 Project (CICYT, Spanish Government). The authors acknowledge contributions from Iñaki Arrate (EVE, Basque Government), Andres Alonso (Council of Vitoria-Gasteiz) and the Environmental Studies Centre and the Council of Vitoria-Gasteiz.
References
Andersen, L.J. and Kristiansen, R., 1984. Nitrate in Groundwater and Surface Water related by land Use in the Karup Basin, Denmark. Environ. Geol., 5, 207–212.
Arrate, I., 1994. Estudio hidrogeológico del acuífero cuaternario
de Vitoria-Gasteiz (Araba, País Vasco). PhD thesis, University
of Basque Country.
Arrate, I., Sánchez-Pérez, J.M., Antigüedad, I., Vallecillo, M.A., Iribar, V. and Ruiz, M., 1997. Groundwater pollution in quaternary aquifer of Vitoria- Gasteiz (Basque Country, Spain).
Environ. Geol., 30, 257–265
Bernhard, C., Carbiener, R., Cloots, A.R., Froehlicher, R., Schenk, Ch. and Zilliox, L., 1992. Nitrate pollution of groundwater in the Alsatian plain (France). A multidisciplinary study of an agricultural area : the central ried of the Ill river. Environ. Geol.
Water Sci., 20, 125–137.
Böhlke, J.K., 2002. Groundwater recharge and agricultural contamination. Hydrogeol. J., 10, 153–179
Burt, T.P., Matchett, L.S., Goulding, W.T., Webster, C.P. and Haycock, N.E., 1999. Denitrification in riparian buffer zones: the role of floodplain hydrology. Hydrol. Process., 13, 1451– 1463.
EC (European Community), 1980. EC Directive relating to the
quality of water intended for human consumption. Official
Journal of the European Community L229, 80/778/EEC. García-Linares, C., Martínez, M., Sánchez-Pérez, J.M.and
Antigüedad, I., (in press). Nitrate time-evolution in the waters of the quaternary aquifer of Vitoria-Gasteiz (Basque Country, Spain). Influence of wetlands. In: Nitrates in Groundwater in
Europe, IAH Selected Papers.
Gold, A.J., Groffman, P.M., Addy, K., Kellogg, D.Q., Stolt, M. and Rosenblatt, A.E., 2001. Landscape attributes as controls on ground water nitrate removal capacity of riparian zones. J.
Amer. Water Res. Assoc., 37, 1457–1464.
Gustafson, A., 1983. Leaching of nitrate from arable land into groundwater in Sweden. Environ. Geol., 5, 65–71.
McMahon, P.B., 2001. Aquifer/aquitard interfaces: mixing zones that enhance biogeochemical reactions. Hydrogeol. J., 9, 34– 43.
Mengis, M., Schiff, S.L., Harris, M., English, M.C., Aravena, R., Elgood, R.J. and MacLean, A., 1999. Multiple geochemical and isotopic approaches for assessing ground water N03- elimination
in a riparian zone. Ground Water, 37, 448–457.
Ritter, W.F., Chirnside, A.E.M. and Scarborough, R.H., 1990. Soil nitrate profile under irrigation on coastal plain soils. J. Irrig.