Icarus 350 (2020) 113925
Available online 12 June 2020
0019-1035/© 2020 Published by Elsevier Inc. This is an open access article under the CC BY license (http://creativecommons.org/licenses/by/4.0/). Contents lists available atScienceDirect
Icarus
journal homepage:www.elsevier.com/locate/icarus
Research Paper
An attempt to detect transient changes in Io’s SO
2
and NaCl atmosphere
Lorenz Roth
a,∗, Jeremie Boissier
b, Arielle Moullet
c, Álvaro Sánchez-Monge
d,
Katherine de Kleer
e, Mizuki Yoneda
f, Reina Hikida
g, Hajime Kita
h, Fuminori Tsuchiya
i,
Aljona Blöcker
a, G. Randall Gladstone
j, Denis Grodent
k, Nickolay Ivchenko
a,
Emmanuel Lellouch
l, Kurt D. Retherford
j, Joachim Saur
m, Peter Schilke
d, Darrell Strobel
n,
Sven Thorwirth
daSpace and Plasma Physics, Royal Institute of Technology KTH, Stockholm, Sweden bIRAM, 300 rue de la Piscine, 38406 St. Martin d’Heres, Grenoble, France cNASA, Ames Research Center, Space Science Division, Moffett Field, CA, USA dI. Physikalisches Institut, Universität zu Köln, Zülpicher Str. 77, Köln, Germany
eCalifornia Institute of Technology, 1200 E California Blvd. M/C 150-21, Pasadena, CA 91125, USA fTadano Ltd., Takamatsu, Japan
gDepartment of Earth and Planetary Science, University of Tokyo, Tokyo, Japan hInstitute of Space and Astronautical Science Japan Aerospace Exploration Agency, Japan iGraduate School of Science, Tohoku University, Sendai, Japan
jSouthwest Research Institute, San Antonio, TX 78238, USA
kLaboratoire de Physique Atmosphérique et Planétaire, STAR Institute, Université de Liège, Liège, Belgium
lLESIA–Observatoire de Paris, CNRS, UPMC Univ. Paris 06, Univ. Denis Diderot, Sorbonne Paris Cite, Meudon, France mInstitut für Geophysik und Meteorologie, Universität zu Köln, Albertus-Magnus-Platz, Cologne, D-50923, Germany nJohns Hopkins University, Baltimore, MD, USA
A R T I C L E
I N F O
Keywords: Io’s atmosphere Volcanic activity Magnetospheric variabilityA B S T R A C T
Io’s atmosphere is predominately SO2that is sustained by a combination of volcanic outgassing and subli-mation. The loss from the atmosphere is the main mass source for Jupiter’s large magnetosphere. Numerous previous studies attributed various transient phenomena in Io’s environment and Jupiter’s magnetosphere to a sudden change in the mass loss from the atmosphere supposedly triggered by a change in volcanic activity. Since the gas in volcanic plumes does not escape directly, such causal correlation would require a transient volcano-induced change in atmospheric abundance, which has never been observed so far.
Here we report four observations of atmospheric SO2and NaCl from the same hemisphere of Io, obtained
with the IRAM NOEMA interferometer on 11 December 2016, 14 March, 6 and 29 April 2017. These observations are compared to measurements of volcanic hot spots and Io’s neutral and plasma environment. We find a stable NaCl column density in Io’s atmosphere on the four dates. The SO2column density derived
for December 2016 is about 30% lower compared to the SO2column density found in the period of March to
April 2017. This increase in SO2from December 2016 to March 2017 might be related to increasing volcanic
activity observed at several sites in spring 2017, but the stability of the volcanic trace gas NaCl and resulting decrease in NaCl/SO2ratio do not support this interpretation. Observed dimmings in both the sulfur ion torus
and Na neutral cloud suggest rather a decrease in mass loading in the period of increasing SO2abundance.
The dimming Na brightness and stable atmospheric NaCl furthermore dispute an earlier suggested positive correlation of the sodium cloud and the hot spot activity at Loki Patara, which considerably increased in this period. The environment of Io overall appears to be in a rather quiescent state, preventing further conclusions. Only Jupiter’s aurora morphology underwent several short-term changes, which are apparently unrelated to Io’s quiescent environment or the relatively stable atmosphere.
∗ Corresponding author.
E-mail address: lorenzr@kth.se(L. Roth). https://doi.org/10.1016/j.icarus.2020.113925
1. Introduction
The atmosphere of Jupiter’s volcanic moon Io consists primarily of SO2 and is generated through a combination of direct volcanic
outgassing and sublimation of volcanic frost deposits (see e.g. review by Lellouch et al.,2007). The relative contribution of these two sources is subject of many studies with sometimes ambiguous results (e.g.,Clarke et al.,1994;Saur and Strobel,2004;Spencer et al.,2005;Retherford et al.,2007;Roth et al.,2011;Tsang et al.,2015;Jessup and Spencer, 2015;de Kleer et al.,2019a;Hue et al.,2019). Infrared (IR) observa-tions of an SO2absorption band obtained over a Jupiter season revealed
a stable SO2 atmosphere, with moderate but clear dependence on
heliocentric distance suggesting that both sublimation and (constant) volcanic outgassing are viable sources (Tsang et al.,2012). The most compelling evidence for sublimation being the dominating source was finally also provided by IR measurements:Tsang et al.(2016) detected an SO2 collapse by a factor of 5 ± 2 after Io entered the shadow of
Jupiter, which they explained with a decrease of surface temperature and thus of sublimation.
Besides sulfur and oxygen compounds, NaCl was detected in Io’s at-mosphere with submillimeter observations (Lellouch et al.,2003). The very low NaCl vapor pressure rules out sublimation as effective source to balance the fast loss via photodissociation (Moses et al., 2002). Instead, NaCl must be sustained through volcanic outgassing, and a localized confinement to individual volcanic sites is also consistent with observations (Moullet et al., 2010, 2015). Besides direct outgassing of gaseous NaCl, vaporization of NaCl condensates might become a possible source if volcanic eruptions lead to surface temperatures above 1000 K (Von Vartenberg and Albreeht,1921) as occasionally observed at Io (McEwen et al.,1998;Keszthelyi et al.,2007).
Through various processes, fast and slow Na atoms are generated and ejected from Io (Wilson et al., 2002) forming extended neutral clouds along Io’s orbit (Brown and Chaffee,1974;Schneider and Bage-nal,2007). Although only a rare trace species in the magnetosphere, the sodium atoms are easily detected because of their high resonance scattering efficiency and are therefore often used as a diagnostic for monitoring the Jovian neutral environments (e.g.,Mendillo et al.,1990; Grava et al.,2014).
An average amount of 1 ton/s of material, primarily sulfur and oxygen, is lost from Io’s atmosphere to the magnetosphere through collisions with the corotating plasma (Broadfoot et al.,1979). Model results suggest that 80% of this mass is lost as neutrals while 20% is directly ionized in the atmosphere and picked up by the magnetic field (Saur et al.,2003). Most of the lost neutrals are also eventually ionized and accumulate along Io’s orbit where they form the Io plasma torus near the moon as well as the magnetospheric plasma sheet when radially transported outwards (see e.g., review byThomas et al.,2004). The mass loss from Io’s atmosphere is the main source of plasma for Jupiter’s huge magnetosphere and substantially affects its dynamics and extent (Krupp et al.,2004;Khurana et al.,2004). A striking observ-able effect of the plasma input and transport within the magnetosphere is Jupiter’s bright main auroral emission. The region where the plasma rotation lags Jupiter’s corotation magnetically maps to the continuously present main emission of the aurora, initially explained through a stationary field-aligned electric current system (Cowley and Bunce, 2001;Hill,2001). Recent results from the NASA Juno mission indicate that the generation of Jupiter’s main auroral emission is more diverse and dynamic, including broadband or stochastic processes (Mauk et al., 2017;Saur et al.,2018) as well as magnetic loading and unloading (Yao et al.,2019).
Hence, it is generally agreed on that the mass loss from Io’s at-mosphere plays a crucial role for Jupiter’s magnetospheric processes. The source of this atmosphere on the other hand is either directly (outgassing) or indirectly (frost deposit sublimation) connected to Io’s volcanic activity, which is clearly time-variable (e.g., Williams and Howell,2007). Given the variable nature of the volcanism and Io’s role
as primary magnetospheric mass source, various transient changes in the sodium neutral cloud, the plasma and neutral torus, and Jupiter’s auroral morphology and brightness were proposed to originate from a sudden change of the atmospheric mass output triggered by changes in volcanic activity such as strong eruptions. We discuss some of these studies in the following.
Earlier studies claiming such volcanic control used data from in-dividual observing campaigns or specific events like the Cassini flyby at the Jupiter system.Brown and Bouchez(1997) observed a sharp increase in the sodium cloud followed by an increase in sulfur ion torus emissions and interpreted this as volcanic mass loading event.Delamere et al. (2004) modeled a change in torus properties detected during the Cassini survey (2000–2001) and derived a decrease of factor 3 within a month in Io’s mass loading.Bonfond et al.(2012) attributed a systematic change of Jupiter’s auroral emission in 2007 to an increase in volcanic activity, based on the imaging of the Tvashtar volcano plume during the flyby of the New Horizons spacecraft (Spencer et al., 2007). An increase in the sodium brightness happened around the same time (Yoneda et al.,2009).
Since 2013, the Io torus emissions as well as the brightness of Jupiter’s aurora were monitored systematically during Jupiter observ-ing seasons by the Hisaki space observatory (Yoshikawa et al.,2014). The most substantial event documented by Hisaki occurred in February 2015: The oxygen neutral density in the Io torus increased by factor of 2.5 (Koga et al., 2018a), simultaneously with an increase in the sodium cloud brightness seen in ground-based observations (Yoneda et al., 2015). An emission enhancement from singly ionized sulfur in the Io torus was also measured around the same time, and with some delay the emissions from ions of higher charge states increased as well (Yoshikawa et al., 2017; Yoshioka et al., 2018). Following this period, Hisaki detected more frequent intense auroral brightenings accompanied by changes in the color ratio of auroral UV emission that reflects the energy of precipitating electrons (Tsuchiya et al.,2018;Tao et al.,2018). All these observations were explained by reconfigurations of the torus (change of densities and temperatures) and magnetosphere after some period of increased mass loading.
The above mentioned studies claimed that the observed changes were triggered by volcanic activity on Io. The volcanic activity is commonly assessed through observations of thermal IR emissions from volcanic hot spots (e.g.,Blaney et al.,1995;Rathbun et al.,2004). How-ever, the temporal and causal relation of the magnetospheric events to the thermal hot spots is not clear.
An often cited study byMendillo et al.(2004) proposed that the hot spots emission on the sub-Jovian hemisphere, which is dominated by the brightness of Loki Patera, is positively correlated to the Na cloud brightness, but this correlation is derived from a rather small sample size (see theirFig. 2). Another method to constrain volcanic outgassing relation is provided by infrared observations of sulfur monoxide (SO) 1.7 μm forbidden emissions, which are thought to originate directly from outgassed excited SO (de Pater et al.,2002,2007). Recently,de Kleer et al.(2019a) did not find a significant dependence of the SO emissions to thermal hot spot activity and found a particularly high SO abundance during a time of particularly low thermal emissions at Loki Patera on one occasion. The latter suggests that hot spot activity is not necessarily coupled to plume activity and gas emission.
The systematic magnetospheric changes detected by Hisaski in 2015 were claimed to be associated with one single strong eruption at Kurdalagon Patera (e.g., Yoshikawa et al., 2017; Tao et al., 2018; Koga et al.,2018a). However, the continuous monitoring byde Kleer and de Pater(2016b) andde Kleer et al.(2019b) detected 19 events between 2013 and 2019 that the authors categorized as bright erup-tions like the Kurdalagon event in 2015. The argument for Kurdalagon as the trigger of the magnetospheric reconfiguration is only based on the temporal coincidence. It remains unclear why and how the Kurdalagon eruption could have affected the mass loss from Io in a way that a large magnetospheric reconfiguration occurred while other,
sometimes brighter, eruptions did not affect the magnetosphere at all. For example, the new bright outburst designated ‘UP 254’ in May 2018 had an intensity of 125 GW/μm/sr in the L’-band (de Kleer et al., 2019b) (compared to the maximum of 68 GW/μm/sr at Kurdalagon) but did not lead to measurable changes in the torus (Tsuchiya et al., 2019).
An alternative cause for change in mass loss from Io, independent of volcanic events, would be an reconfiguration of the Jovian magne-tosphere: A change in plasma density and temperature in Io’s orbit (through e.g. an interchange event, Bolton et al.(1997)) affects the plasma-atmosphere interaction and thus the mass loading (Saur et al., 1999). Such external triggers for transient or intermittent mass loading changes have not been studied so far to our knowledge.
Some recent studies even provided results that question the basic hypothesis that volcanic outbursts can lead to increased mass loading. In a fortunate IR high-resolution observation, Lellouch et al.(2015) measured a very strong thermal outburst in the continuum emission over the Pillan Patera. The strong continuum allowed a measurement of atmospheric line absorption in the thermal component from the hot spot, which did not reveal any measurable extra SO2abundance above
this region. This result shows that even extreme thermal eruptions are not necessarily connected to changes in the bulk atmosphere. Further-more, Monte Carlo simulations byMcDoniel et al.(2017) suggest the active Pele plume contributes only about 1% to the atmospheric content and that the net increase from a plume to the hydrostatic atmosphere density on the dayside is only a fraction of the increase on the night side.
Direct escape of volcanic plume gases is marginal, because the plume ejection velocities are generally below Io’s escape velocity of 2.6 km/s. For a ballistic trajectory, the highest observed plumes of 400 km would imply an ejection velocity of 1.2 km/s, the largest estimated gas temperatures of 800 K (for NaCl,Lellouch et al.(2003)) correspond to a root-mean-square velocity for SO2of 0.6 km/s. In addition, simulations
revealed that the ejected plume gas is effectively contained by the canopy shocks further reducing the possibility to escape (Zhang et al., 2003; Geissler and Goldstein, 2007). This means that mass loading of volcanic gases probably occurs through the same processes as for the global sublimated atmosphere, namely through primarily elastic collisions of ions and neutrals and secondarily photo-ionization (Saur et al.,1999;Dols et al.,2012;Blöcker et al.,2018).
The fact that large amounts of plume gases cannot escape directly means that if volcanic eruptions indeed affect the bulk mass loss tem-porarily, they also need to lead to measurable short-time changes in the bound atmosphere. However, volcanically induced aperiodic changes in Io’s SO2 atmosphere have never been confirmed observationally. The
SO2survey over 10 years byTsang et al.(2012) revealed only seasonal
changes but no stronger aperiodic deviations (see e.g. their figure 12). In this study, we report four submillimeter observations of SO2and
NaCl atmospheric emission lines taken over a period of four months in 2016/2017 with the goal to detect volcanically induced changes. The data acquisition and processing is described in Section2. By fitting results from an atmosphere model to the extracted emission lines, we derive global abundances for SO2and NaCl on the observed hemisphere (Section 3). In Section 4, we discuss the obtained abundances on the four different days and in particular the time-variability in the atmosphere and compare them to observations of Io’s volcanic hot spots, the sodium cloud, the sulfur ion torus and Jovian aurora from the same period. Section5summarizes the results.
2. Observations and data processing 2.1. Observations
Io was observed by the NOrthern Extended Millimetre Array (NOEMA) interferometer of the Institut de Radioastronomie Millimetrique (IRAM) on four occasions, seeTable 1. The observations
Table 1
Details and geometry parameters of the IRAM/NOEMA observations.
Obs Observation Start End Sun Earth Io Observed # Date time time distance distance diameter Io CMLa
(UT) (UT) (AU) (AU) (arcsec) (degree) 1 2016-Dec-11 04:12 11:20 5.46 5.86 0.86 221–280 2 2017-Mar-14 22:30 03:53+1 5.45 4.55 1.11 219–266 3 2017-Apr-06 23:10 04:04+1 5.45 4.45 1.13 228–269 4 2017-Apr-29 21:58 01:53+1 5.45 4.52 1.12 221–254 aIo’s central meridian (West) longitude as seen from Earth.
were taken in an intermediate array configuration (‘C’) providing spa-tial resolution similar to the size of Io’s diameter (∼1 arcsec). A spectral setting was selected such that four SO2pure rotational emission lines
(𝐽𝐾
𝑎,𝐾𝑐 = 324,28− 323,29at 258.389 GHz, 207,13− 216,16at 258.667 GHz, 93,7−92,8at 258.942 GHz, and 304,26−303,27259.599 GHz) were covered
simultaneously with a NaCl line (𝐽 = 20 − 19 at 260.223 GHz) at a resolution of 0.20 MHz (or 0.24 km s−1).
All four tracks were scheduled such that the anti-Jovian to trailing hemisphere is observed, where the atmospheric density is comparably high (Spencer et al.,2005;Feaga et al.,2009;Tsang et al.,2013;Jessup and Spencer, 2015) and a large fraction of the bright transient hot spots is found (de Kleer and de Pater,2016a). The similar longitude coverage enables a comparison of the fluxes measured during each of the observations as well as to the volcanic activity of hot spots on the same hemisphere. The ranges in Io’s central meridian West longitude for each track (CML in Table 1) are roughly centered on 245◦W, corresponding to a longitude range of 155–335◦W of the entire
observed hemisphere from dawn to dusk limb. 2.2. Data processing
The whole data reduction was performed using the CLIC and MAP-PING packages of the GILDAS1software suite (Gildas Team,2013). For each track, we followed the same sequence of operations consisting of a standard calibration (1), flux calibration (2), and the spectral line extraction(3). The three steps are explained in more detail now, the adopted calibration parameters and references are given inTable 2.
In the first step of the standard calibration (1) the system response is calibrated by measuring a continuum on a strong calibrator. In the second step, atmospheric and instrumental phase and amplitude variations are calibrated for, using measurements of a gain calibrator (a point source with phase and amplitude that should remain constant over the observed time). The best phase rms (root-mean-square) after calibration was obtained for 2017-Apr-29 data set while 2016-Dec-11 was observed under poor conditions (Table 2). The derived amplitude root-mean-squares (rms) were between ∼10 and ∼25%. In the final step of the standard calibration, the absolute amplitude scale of the data was determined based on observations of one of the secondary flux calibrators for NOEMA where fluxes are monitored against planets all along the year. Given the high frequency and the relatively poor observing conditions this flux calibration provides a global uncertainty on the order of 15%.
The flux calibration (2) is carried out using Io’s continuum emission. Io is commonly used as primary flux calibrator and good model predic-tions exist for its thermal emission. Since the goal of our project was to study line emission, we could use Io’s thermal emission to improve the flux calibration as described for the last step of the standard calibration. In the first part of the flux calibration, the emission from line-free channels in the calibrated visibility spectral tables were averaged to generate continuum visibilities for a first image of Io’s continuum emission. Given the high signal to noise ratio of the obtained map,
Table 2
Data processing and calibration parameters and objects, including the root-mean-square values of the phase (𝜙 rms) and amplitude (A rms).
Obs RF bandpass calibration Gain calibration Flux cal. Synthesized beam
# Source 𝜙rms A rms Source 𝜙rms A rms Source (at 258.942 GHz)
1 3C84 0.8–2.4◦ 1.3–2.7% 3C279 30–90◦ 17%–24% Lkh𝛼101 1.64′′×0.56′′
2 0851+202 0.5–1.9◦ 0.5–2.1% 3C279 15–71◦ 09%–18% MWC349 2.14′′×1.23′′
3 3C273 0.9–2.2◦ 1.2–4.9% 3C279 24–71◦ 13%–18% MWC349 2.98′′×1.74′′
4 3C279 0.6–2.2◦ 0.8–3.5% 3C279 10–63◦ 08%–23% MWC349 3.59′′×1.47′′
Table 3
Areas under fitted Gausian profiles for the extracted SO2 and NaCl spectra from the four observing days.
SO2 lines NaCl line
Obs 258.389 GHz 258.667 GHz 258.942 GHz 259.599 GHz 260.223 GHz # (K km/s) (K km/s) (K km/s) (K km/s) (K km/s) 1 14.9 ± 1.9 6.2 ± 2.1 15.7 ± 1.8 13.9 ± 1.8 15.2 ± 1.8 2 15.3 ± 1.0 5.8 ± 0.9 18.2 ± 0.8 16.7 ± 0.9 12.9 ± 0.9 3 18.1 ± 1.5 5.9 ± 1.2 20.8 ± 1.4 17.6 ± 1.2 20.7 ± 1.9 4 16.5 ± 1.2 5.8 ± 1.3 19.4 ± 1.1 19.4 ± 1.0 16.1 ± 1.3
an iteration of self-calibration was then performed to estimate phase gains and apply them to the visibilities, leading to improved image quality. Io’s disk integrated flux 𝑆ObsIo was obtained by fitting a disk model to the observed visibilities. Finally, a theoretical Io flux 𝑆ModelIo was extracted from the model available in the Common Astronomy Software Application (CASA, McMullin et al., 2007). The model is described in the ALMA memo 594 (Butler,2012). The amplitude scale derived in the last step of the standard calibration was then scaled by the factor 𝑆ModelIo ∕𝑆ObsIo . According toButler(2012) the uncertainty on Io’s continuum flux should be within 5% and hence significantly better than the original flux calibration.
For the spectral line extraction (3), continuum visibilities were first obtained again from the line-free channels in the rescaled visibility table. Self-calibration gains were measured again. The success of the flux rescaling was confirmed by repeating this step and checking that the measured flux of Io matched the value given by the model. The self-calibration gains were then applied to all channels of the visibil-ity table. The continuum emission was subtracted from the visibilvisibil-ity spectra by fitting a first order polynomial function to the line-free channels.
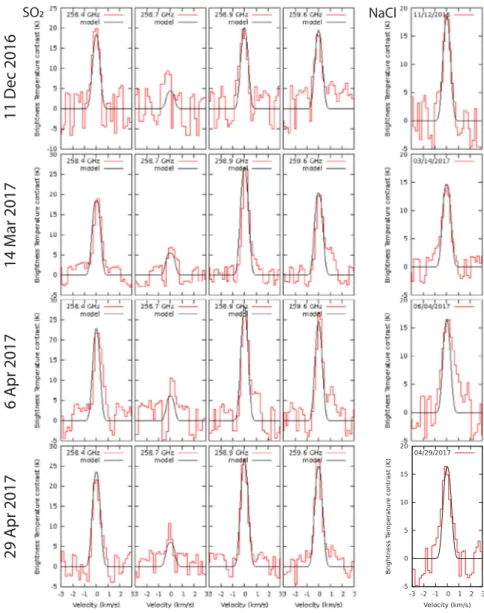
Self-calibrated, line-only visibilities were imaged and deconvolved to build cubes around all the targeted spectral lines. Line integrated maps of SO2 and NaCl are presented inFig. 1. For each channel, an
Io-sized disk model was fitted to the visibilities and the total fluxes (i.e. fluxes at zero radius in the aperture plane) were used to build the surface integrated spectra, shown inFig. 2.
In order to roughly estimate the fluxes in each line, we fitted Gaussian profiles to the extracted line spectra. The areas under the Gaussian profiles calculated with the fitted peak and width parameters are summarized inTable 3and can serve as a first approximation for the line intensities and their variability. For the three stronger SO2lines (258.389 GHz, 258.942 GHz, 259.599 GHz), the intensity is lower in the first observations in December, when compared to the observations in March and April 2017. The NaCl line intensity appears to be more variable on first inspection yet without showing a clear trend. While some of the changes in the intensities derived from the Gaussian fit areas originate from changes in the peak emission, others arise from only changes in the line widths. For a more reliable and comprehensive comparison, we apply an atmospheric model and fit model spectra to the extracted line spectra.
3. Atmosphere modeling
The observed SO2and NaCl lines are fitted using the radiative
trans-fer model used inMoullet et al.(2010). The atmosphere is assumed to
be concentrated to a band around the equator with a uniform column density within 35◦N/S latitude, similar to the distribution inStrobel and Wolven (2001). Io’s atmosphere is furthermore assumed to be in hydrostatic equilibrium, with a gas temperature horizontally and vertically uniform. Line opacity is calculated for each 0.25 km thick layer up to two scale heights, using the transition parameters (intensity and lower level energies) from the JPL and CDMS databases (Pickett et al.,1998; Müller et al.,2001; Endres et al.,2016) as provided in the Splatalogue catalog (https://www.cv.nrao.edu/php/splat/). Then local brightness temperature is calculated over a grid of observable disk locations, taking into account airmass, assuming a surface continuum brightness temperature of 100 K (Moullet et al.,2008). Finally a disk-averaged model line is derived, directly comparable to disk-disk-averaged observations.
On each observation date, the four simultaneously observed SO2
lines strongly constrain the gas temperature. Specifically, in an opti-cally thin regime, the ratio of line contrasts between two transitions is equal to the ratio of their line intensities. The intensity of a given transition varies with atmospheric temperature, more or less steeply depending on the transition’s lower energy level. Hence there is only a limited range of temperature solutions which can reproduce the ob-served line contrast ratio between two transitions. Thanks to the large span in lower energy levels in the observed lines (from 35 to 360 cm−1),
the atmospheric temperature can be tightly constrained by finding the best temperature which fits all contrast ratios between different lines. In partially optically thick regimes, one can determine simultaneously the atmospheric temperature and SO2column density, by considering both the relative and absolute contrasts, with the relative contrasts still being primary diagnostic for the temperature. The line-widths are also sensitive to gas temperature, optical depth (i.e. SO2 column density) and other broadening mechanisms (e.g., planetary-scale winds or plume dynamics).
Because the spatial resolution of our observed maps is not sufficient to derive a reliable velocity field, we first assume that the atmosphere is co-rotating with the solid surface (no winds) and retrieve best-fit SO2
column density and temperature. While the line contrasts could be fit well (except for the weak and noisy 258.667 GHz line on Dec 11), the line-widths were significantly underestimated by our no-wind models. In particular, we noted that in the new IRAM data, almost all SO2lines
are significantly lopsided towards red-shifts. If these red-shift signatures are real, there are different possible explanations for the related global atmospheric motions away from the observer. The dominant red-shift could be related to winds from the observed trailing/anti-Jovian hemi-sphere towards the opposite (leading/sub-Jovian) hemihemi-sphere. Such wind direction could be driven by a pressure gradient from the dayside to the nightside or related to drag forces exerted by the flow of the surrounding plasma from the upstream trailing hemisphere to the downstream leading hemisphere.
The mismatch in line widths, with broader observed lines than estimated by the models, is a recurring issue in the modeling of Io’s atmospheric submillimeter lines. Moullet et al. (2010) showed that a strong prograde wind, as observed in Moullet et al. (2008), could be introduced in the radiative transfer model to fit line-widths. The assumption of prograde winds is not based on a known physical process that could drive such winds, but has a more practical mod-eling reason. Prograde winds are corotating with Io’s rotation, thus producing broader model lines at reasonable wind speeds of a few
Fig. 1. IRAM/NOEMA maps of the emission for the 258.942-GHz SO2line and the NaCl line (260.223 GHz) after self-calibration for the four observation days. The levels of the contour lines (thin black) are in 2-sigma steps. Io’s disk is shown in solid white. The beam size is illustrated in the inlet in the lower left and given inTable 2for the SO2line.
Fig. 2. Disk-averaged spectra (red) of the four SO2lines (left four columns) and the NaCl 260.223 GHz line (rightmost column) for the four IRAM observing tracks. The continuum was subtracted. The model results for fitting the brightness temperature (simultaneously for the four SO2 lines) are shown in black. The corresponding images for the SO2 258.942 GHz line and the NaCl line are shown inFig. 1. (For interpretation of the references to color in this figure legend, the reader is referred to the web version of this article.)
Table 4
SO2and NaCl column densities, temperature and wind parameters derived for the four observation days, assuming an equatorial, homogeneous model atmosphere.
Observation NSO2 TSO2 vwind NNaCl Mix. ratio
date (cm−2) (K) (m/s) (cm−2) NaCl/SO 2 2016-Dec-11 (0.75 ± 0.11) × 1016 260 250 (1.40 ± 0.20) × 1013 1.9(±0.4) h 2017-Mar-14 (1.10 ± 0.09) × 1016 220 300 (1.20 ± 0.09) × 1013 1.1(±0.1)h 2017-Apr-06 (1.05 ± 0.12) × 1016 240 250 (1.20 ± 0.15) × 1013 1.1(±0.2)h 2017-Apr-29 (1.10 ± 0.06) × 1016 255 280 (1.30 ± 0.10) × 1013 1.1(±0.1)h
hundreds of meters per second, similar to the expected sound speed at low altitudes (Strobel et al.,1994). For a better agreement with the observations, we also included prograde winds in our modeling with the wind speed as free parameter in addition to the gas temperature and column density. We emphasize however that our disk-integrated data does not enable a characterization of any wind pattern. Earlier spatially resolved observations byMoullet et al.(2008) were not in agreement with sub-solar to anti-solar wind but only with prograde winds. In our observations, a different global velocity field may be at play (especially considering plumes can also have an effect on the line structure).
The fitted parameters are summarized inTable 4.Fig. 2shows the model fits to the four SO2 lines for the four observations, respectively.
In order to derive NaCl abundance and compare it to the SO2
content, we assume that the two species are colocated and share the same kinetic temperature. However, NaCl is likely highly spatially inhomogeneous and not colocated with SO2(Moullet et al.,2015), since
SO2 is mainly sourced from sublimation while NaCl originates from
volcanic activity. The assumption of a global abundance leads to lower column densities, and the obtained NaCl values inTable 4can in that sense be considered lower limits.
The other extreme case would be high NaCl column densities in only few small regions on the surface (at active volcanoes), which means higher optical depth and at some NaCl density saturated lines. However, we have no information on the distribution or degree of confinement of the NaCl abundance. The goal of the study is to con-strain the temporal evolution of the atmosphere. Therefore, we chose to neglect spatial variations and used the simplest assumption, keeping the shortcomings in mind.
The model fits to the NaCl lines for the four observations are shown in the rightmost column ofFig. 2.
4. Results and discussion 4.1. Atmosphere
The obtained SO2 temperatures and abundances are in general
agreement with previous submillimeter and Lyman-𝛼 observations of the trailing hemisphere (e.g.Moullet et al., 2008; Feaga et al.,2009; Moullet et al., 2010). We note that there are however some differ-ence in obtained temperature and density when comparing to values using other methods. For example, higher densities are often derived from thermal infrared and near-ultraviolet measurements (e.g.,Spencer et al.,2005;Tsang et al., 2012; Jessup and Spencer,2015) and solar reflected mid-infrared spectra suggest lower temperatures (Lellouch et al., 2015). Such differences can be caused by differing sounding altitudes in the atmosphere for example.
During the three observations taken in March and April 2017 the SO2 column density appears to be stable, i.e. the results are consistent
with a constant abundance with the 1-𝜎 uncertainties (Fig. 3c and Table 4). Compared to the average of the three 2017 observations, the SO2column density derived for December 2016 is lower by 30(±14)%,
suggesting a significant (∼2𝜎) change. Comparing the combined fluxes directly derived from the four SO2spectra (Table 3), the Dec 2016 value
is also lower than the average from the March and April 2017 tracks (by 15(±7)% as compared to 30(±14)% from the model), suggesting that a change in the SO2atmosphere did happen in this period.
In contrast to this trend, the highest NaCl column density was derived for the December 2016 observation (Table 4). However, the modeled NaCl abundance appears overall to be stable and all four observations are consistent with the mean value within their 1-𝜎 un-certainties (green dotted line in Fig. 3c). Given the discussed short NaCl lifetime (Moses et al.,2002) and likely dynamic volcanic sources, the stability is generally surprising. Again looking at fluxes under the NaCl spectra (Table 3), they undergo more variability with a peak on April 6 between the March 14 and April 29 observations. The maximum originates from the wide red-shifted wing which is not captured by the model (Fig. 2, right column). If real, this extended wing might originate from a specific eruption, e.g. located on the dusk hemisphere which moves away from the observer.
The resulting NaCl/SO2 mixing ratio are on the low side of
previ-ously derived ratios (Lellouch et al., 2003; Moullet et al., 2010). As discussed in Lellouch et al. (2003) the derived values can vary by more than an order of magnitude for different assumptions on the NaCl distribution. When assuming a localized abundance only in plumes the fitted NaCl abundance would be higher.
Given the trends in SO2 and NaCl, the NaCl/SO2 mixing ratio
decreases from 11 December 2016 to the observations taken on 14 March, 6 and 29 April in 2017 (Table 4, rightmost column). During the period in March and April it remains stable within uncertainties. Again relating the difference between December 2016 and March/April 2017 to the stable 2017 ratio, we find a relative decrease by 64%(±36%).
The stability of the NaCl column density might be interpreted as a quiet atmospheric state, where volcanic outgassing sources are small. Low volcanic activity would imply low supply of NaCl through outgassing. The increase in SO2 abundance on the contrary suggests
an increase in the atmospheric sources related to volcanic activity. Seasonal changes (due to the heliocentric distance) and related changes in sublimation yields are negligible within the studied period.
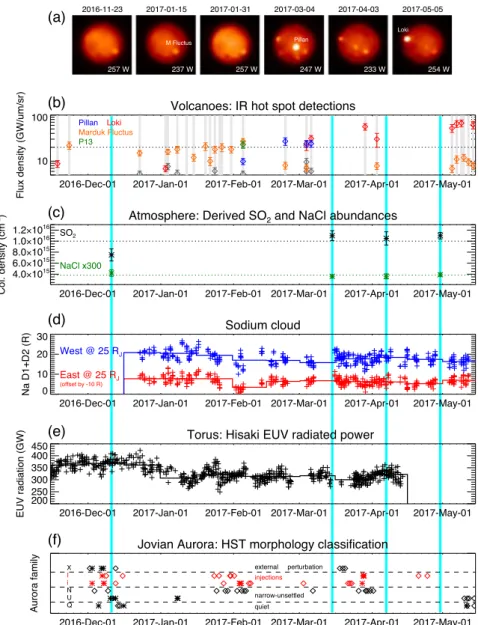
In the following sections, we compare our results with the vari-ability observed in the presence of hot spots on Io, the Jovian neutral sodium cloud, the sulfur ion torus and Jupiter’s polar aurora. 4.2. Hot spot activity
The thermal emission from volcanic hot spots has been monitored since 2013 with high cadence by the Keck and Gemini telescopes (de Kleer and de Pater,2016b;de Kleer et al.,2019b). Here, we focus on the brighter hot spots on the hemisphere covered by IRAM and use the power measured in the L’ filter (3.8 μm) as diagnostic for the activity level. In 26 IR images taken between November 2016 and mid-May 2017 the hemisphere targeted by IRAM was (partly) observed by Gemini or Keck. The times of these 26 observations are shown by gray (sometimes overlapping) vertical lines inFig. 3b (for complete list of images and CMLs see table 4 inde Kleer et al., 2019b). A selection of six Gemini images is shown in the top panel (a). Hot spot emission in the category of bright eruptions (>20 GW/μm/sr) as defined inde Kleer et al.(2019b) were measured on four different locations: Marduk Fluctus (orange diamonds inFig. 3b), Pillan Patera (blue), Loki Patera (red), and an unnamed patera designated P13 (green). The power of all other hot spots (gray) did not exceed 20 GW/μm/sr, even when including the measurements of the opposite hemisphere not shown in the figure. We first discuss possible relations to the changes at Loki Patera, because of its particular role as periodically brightening patera (de Kleer et al.,2019c) and because it is the brightest hot spot in this period.
4.2.1. Loki Patera
Mendillo et al.(2004) suggested that the activity level at Loki is positively correlated to the Jovian sodium cloud brightness through the volcanic outgassing of NaCl to the atmosphere. In our studied period, Loki awakened after a quiet period reaching strong emissions near the later IRAM observations in April. The NaCl abundance is stable and
Fig. 3. Comparison of various measurements obtained in the period from 15 Nov 2016 until 15 May 2017 that are possibly related to Io’s atmosphere: (a) Gemini images (3.8 μm)
of volcanic hot spots on the hemisphere (CML in white) observed by IRAM (Table 1) (b) Hot spot brightnesses extracted for specific volcanic regions (colored) from all Gemini and Keck IR images that covered the studied hemisphere (dates of used images shown by gray vertical line). (c) Atmospheric column densities for SO2(black) and NaCl (green, multiplied with 300) on the four days of our IRAM observations and averages (dotted lines). (d) Brightness of the Na D1 and D2 lines of the sodium cloud measured east (red crosses) and west (blue crosses) of Jupiter and half-month averages (solid lines). (e) Total radiated power of the Io torus (dominated by sulfur ion emissions) measured in the EUV channel of the Hisaki space observatory (crosses) and half-month averages (solid line). (f) Classification timeline of the morphology of Jupiter’s aurora from HST images byGrodent et al.(2018). The ‘‘injection’’ classes (i,I, in red) are suggested to be related to enhanced mass loss from Io’s atmosphere. The light blue vertical bars are added to guide the eye for the comparison with the IRAM observations. (For interpretation of the references to color in this figure legend, the reader is referred to the web version of this article.)
the NaCl/SO2 mixing ratio even significantly drops in the period of
the increased thermal activity at Loki. Thus, our results dispute the hypothesis that Loki feeds the sodium cloud through outgassing of NaCl.
On the other hand, the increasing activity at Loki Patera coincides with the obtained increase in SO2 abundance, possibly suggesting a
positive correlation of volatile (SO2) abundance and thermal hot spot
brightness. However, this is in fact rather unexpected, based on the current understanding of the periodic brightening at Loki Patera as overturning lava lake (Rathbun et al., 2002; Davies,2003; de Kleer et al., 2017). The volatile content in the repeatedly erupting lava is instead expected to be low and thus thermal eruptions not be accompanied by outgassing events. The lack of spatial resolution in the IRAM observations, however, prevents further investigations of the correlation of the minor increase in SO2and the wakening of the Loki
Patera.
4.2.2. Other volcanic spots
Apart from Loki, activity via hot spots detections was found at Pillan patera and the patera designated P13. The bright eruption at P13 was seen only in one image (February 5) and the power had already significantly decreased until February 23, where 2.2 GW/μm/sr (L’-band) were measured. It is unlikely that this activity affected the atmosphere density measured on March 14 or later by IRAM, given the atmospheric SO2lifetime of a few days (Strobel and Wolven,2001; Lellouch et al.,2007).
The transient brightening at the Pillan Patera was seen in late February and early March. A faint signal from the site can be seen in the Gemini image from 3 April (Fig. 3a). Hence, the temporal coincidence makes Pillan a possible candidate for causing the increase in SO2abundance between Dec 2016 and March 14. However, previous
observations did not reveal a measurable effect on the SO2abundance
The IR images from early March revealed a few other hot spots with L’-band brightnesses >5 GW/μm/sr (Fig. 3b, gray diamonds), which potentially could be related to the SO2increase.
The Marduk Fluctus hot spot on the other hand remains relatively bright over the observed period, similar to the behavior observed in the years before the studied period (de Kleer and de Pater,2016b). A measurable change of the SO2abundance due to the activity is thus not
expected.
We note also that the maximum power of the bright hot spots (other than Loki) did not reach the high level of other events detected in the years before and after (de Kleer et al.,2014,2019b).
Taken together, the presented data sets do not allow a reliable conclusion on the relation between hot spots and atmospheric abun-dances. The only detectable change in the IRAM data occurred during the long observational gap between Dec 2016 and March 2017 and it is generally difficult to relate this change to some volcanic event in this longer period. Given the short atmospheric life times, a volcanic outburst might lead to only transient changes over a few days. The sparsity of hot spot observations directly before the IRAM observations in March and April 2017 further hampered the interpretation. 4.3. Magnetospheric neutral and plasma environment
4.3.1. Sodium cloud
The neutral sodium cloud across Jupiter’s magnetosphere was ob-served frequently between 23 Dec 2016 until later in 2017 from Mt. Haleakal̄a, Maui, Hawaii. The measured brightness relates to the reso-nantly scattered sunlight from the sodium D1 and D2 lines. For more
details on instrument, method and data processing, seeYoneda et al. (2009).Fig. 3d shows each measurement on the eastern (red crosses) and western sides (blue crosses) of Jupiter at a distance of 25 R𝐽 to the planet. The majority of the measurements are consistent (within the measurement uncertainties, not shown in plot) with the average brightnesses of 17 R (East) and 18 R (West) of this period. These average brightnesses are also similar to values previously found for periods of stable sodium cloud brightness (Yoneda et al.,2009).
When comparing the early period (23 Dec to 15 Jan) to the period of March and April 2017, there is a minor decrease of 10% (East) and 14% (West). This could be related to the decrease in NaCl/SO2mixing
ratio in the IRAM data (Table 4). However, a change in total abundance of NaCl in the atmosphere was not derived and the only minor change in the cloud prevent further conclusions. For comparison, in an extreme case in early 2015, these sodium brightnesses increased to values higher than 60 R within about one month (Yoneda et al.,2015). Therefore, the period studied here shows a quiescent sodium cloud.
Of the detected bright volcanic eruptions, none appears to have affected the sodium cloud. In the same time period where the sodium cloud slightly decreases, the volcanic activity overall rather undergoes an increase (see discussion above and panels a and b in Fig. 3). In particularly, the Loki Patera, where the activity strongly increased from February 2017 (hardly detectable) until May 2017 (>80 GW/μm/sr), seems to be uncorrelated to the sodium cloud.
4.3.2. Plasma and neutral torus
Next, we look at the sulfur ion emissions from the Io torus, which was monitored by the Hisaki satellite (Yoshikawa et al.,2014) from November 2016 until 13 April 2017. Fig. 3e shows the total radia-tion power of the Io plasma torus integrated over the wavelengths between 65 and 78 nm, including line emissions of sulfur ions, S+,
S2+, and S3+(Kimura et al.,2017). We used the level-2 spectrograph
image, for which detected photons are accumulated for 1 min (Kimura et al., 2019). The level-2 images obtained during one Hisaki orbital period around the Earth(∼106 min) were integrated with resulting total integration times of 30–60 min.
There is a decrease by 15(±8)% from the average brightness of 370 GW in December 2016 down to 310 GW averaged over March and April
2017. Even though this trend is clear and significant, it is again only a minor change when compared for example to the event in 2015 where the power almost doubled in less than two months (e.g.,Yoshioka et al., 2018;Kimura et al.,2018).
The decrease in the torus coincides with the observed 30% increase in SO2 abundance in the atmosphere. The time scales derived for the changes in the neutral and plasma torus emissions measured by Hisaki in 2015 are between 10 and 40 days (Yoshioka et al.,2018;Koga et al., 2019). The different trends can thus hardly be explained by temporal delay of the response from the torus. The anti-correlation disagrees with the general understanding that higher atmospheric abundances leads to higher mass loss and thus higher torus. The torus trend could originate e.g. from changes in the electron temperature which affects the torus EUV emission in addition to the torus densities. In optical torus emis-sion measurements, which are more sensitive to density,Schmidt et al. (2018) did not report unusual SII brightness in the period March–May 2017 either.
The torus brightness decrease is, however, similar to the found decrease in the sodium cloud brightness (although the sodium mon-itoring started only later on Dec 23). This similar trend in ion torus emissions and sodium emissions together with opposed trend in the SO2atmosphere is more consistent with a change that originated in the
magnetosphere but inconsistent with an atmospheric change as trigger. The Hisaki data on the neutral oxygen torus emissions (Koga et al., 2018a,b) from the studied period are not yet calibrated and are there-fore not included in this discussion.
4.3.3. Aurora activity
Using the Hubble Space Telescope (HST),Grodent et al.(2018) sys-tematically imaged Jupiter’s aurora in the period between 30 Novem-ber 2016 and 18 July 2017. They systematically classified the ob-served emission morphologies into six aurora families. Fig. 3f shows the changes between the morphology families ‘quiet’ (Q), unsettled (U), narrow (N), injection (i, in orange), strong injection (I, in red), and external perturbation (X). The two ‘injection’ morphologies were interpreted to arise from magnetospheric plasma injections into the magnetosphere from Io after a strong volcanic eruption (or several strong eruptions) (Grodent et al.,2018;Bonfond et al.,2012).
HST detected clustered ‘injections’ morphologies (including ‘strong injection’) during several periods in late 2016 and early 2017. One such period happened around the first IRAM observation in December 2016, where the SO2 abundance was lowest. Another one between
the second and third IRAM observation. None of these periods with multiple ‘injection’ morphology detections seem to be reflected by any of the other data discussed here, although the observing times are not always overlapping. For example, there were frequent IR observations of Io’s volcanic activity before the ‘strong injection’ aurora period in late January 2017, but the only brighter detected hot spot was at the ‘Marduk Fluctus’ region, which had been constantly active long before (see panel b). Further comparisons are difficult, as the aurora morphology is very dynamic and changes quickly on time scales of days. These changes are probably dominated by various processes of the magnetospheric dynamics and not by the mass loss from Io.
An aurora morphology similar to the ‘injection’ class that did not coincide with any known volcanic activity of magnetospheric changes was observed before for example byBadman et al.(2016). Explanations other than enhanced mass loading for the particular aurora morphology could be that a global magnetospheric reconfiguration that includes the inward injections is triggered further out in the magnetosphere (Louarn et al.,2014;Haggerty et al.,2019).
5. Summary and open questions
We have observed line emissions from SO2and NaCl in Io’s
atmo-sphere over roughly the same hemiatmo-sphere on four days between 11 December 2016 and 29 April 2017. By fitting simulated fluxes from
an atmosphere model to the observed fluxes, we find that the SO2
abundance on the three days in 2017 is stable with a column density of NSO2 = 1.1 × 1016 cm−2. Compared to this stable period, a 30%
lower column density was derived for December 2016. The model fits for the simultaneously measured NaCl line revealed a roughly stable NaCl abundance of NNaCl = 1.2 − 1.4 × 1013 cm−2 for all four dates.
Our abundances are generally consistent with earlier observations, but we note that the absolute abundances of the species depend on model assumptions, and the focus of this work is on relative changes between the observations.
The increase in SO2 from December 2016 to March/April 2017
cannot be explained by seasonal variations, suggesting that it is instead related to changes in the volcanic source of the atmosphere. The constant abundance of the volcanic trace gas NaCl (and thus decreasing NaCl/SO2mixing ratio) does however not support this possible change in volcanic supply to the atmosphere. Although the change in SO2has
a 2-𝜎 significance, we note that the observing conditions were least favorable during the Dec 2016 track (unfavorable weather, smallest angular size of Io) possibly affecting the signal.
The change in the bulk SO2atmosphere observed by IRAM coincides with a significant increase of the Loki hot spot brightness. However, a significant effect on the SO2 from Loki is not expected given our
un-derstanding of the patera as periodically overturning lava lakeRathbun et al.(2002).
Mendillo et al.(2004) had suggested that the Jovian sodium cloud brightness is correlated to Loki’s activity via the outgassing of NaCl. Dissociation of NaCl in Io’s atmosphere and production of fast Na atoms is generally agreed on to be the primary source for the sodium cloud. A change in the sodium cloud would thus require a change in atmospheric NaCl, which is not seen in the IRAM data. Furthermore, the sodium cloud brightness became fainter during the period of the wakening of the activity at Loki and the EUV torus brightnesses faded as well. Taken together, the presented data sets contradict the results of the study byMendillo et al. (2004), which is often cited as main evidence for a connection of volcanic activity to mass loss from the moon.
The other hot spot activity during the observed period revealed considerable brightenings (at the lower end of the ‘‘bright eruption’’ category of de Kleer et al. (2019b)) at two sites (Pillan Patera and P13) between the first and later IRAM observations. The eruptions at these hot spots could possibly be related to the increase in the bulk SO2 atmosphere, but the limited coverage and overlap prevent further
conclusions.
The monitoring of the Jovian sodium cloud and Io plasma torus in general revealed a quiescent (i.e., no transient changes) environment, consistent with a stable atmosphere. Observed frequent appearances of a fainter, more extended main emissions in Jupiter’s aurora, earlier suggested to relate to increased mass loading (Bonfond et al.,2012), are not reflected in any of the other data and are thus likely unrelated. Taken together, both the atmosphere and the Jovian environment can be considered quiescent in the studied period. This prevents fur-ther conclusions on the volcanic changes of the magnetospheric envi-ronment. Hence, the detection of an unambiguous transient volcanic change in Io’s bulk atmosphere remains an unresolved task. Indepen-dently of the observational evidence, key questions on the influence of changes in Io’s volcanic activity on the magnetospheric environment through the atmospheric mass loss remain unanswered:
• Can changes in volcanic activity lead to significant changes in the bulk atmospheric loss?
• If so, what are the characteristics of such ‘volcanic mass loading events’ and under what conditions do they happen?
• What are the time scales of the involved processes?
Possible scenarios could be that the outgassing level from the volcanic sites undergoes global changes that are not directly observable through hot spot emissions or otherwise. The location of the outgassing sites could also play a role for the effectiveness of atmospheric sputtering to
allow the plume gas to escape. However, a change in mass loading from Io’s atmosphere through the ion-neutral collisions can also be caused by an ‘external trigger’ in plasma torus properties like an increase in density not triggered or initiated by Io’s volcanic activity (as mentioned in the introduction). In order to address and possibly resolve this issue in the future, continuous dedicated monitoring of key atmospheric species (such as SO2 and NaCl) with spatial resolution across Io’s
disk and optimally during a period of strong changes in the plasma environment is needed.
Acknowledgments
L. R. appreciates the support from the Swedish National Space Agency (SNSA) through grant 154/17 and the Swedish Research Coun-cil (VR) through grant 2017-04897. A. S.-M., P. S. and S. T. (Cologne) have been supported via Collaborative Research Centre 956, funded by the Deutsche Forschungsgemeinschaft, Germany (DFG; project ID 184018867) and DFG, Germany SCHL 341/15-1 (‘‘Cologne Center for Terahertz Spectroscopy’’).
References
Badman, S.V., Bonfond, B., Fujimoto, M., Gray, R.L., Kasaba, Y., Kasahara, S., Kimura, T., Melin, H., Nichols, J.D., Steffl, A.J., Tao, C., Tsuchiya, F., Yamazaki, A., Yoneda, M., Yoshikawa, I., Yoshioka, K., 2016. Weakening of Jupiter’s main auroral emission during January 2014. Geophys. Res. Lett. 43, 988–997.
Blaney, D.L., Johnson, T.V., Matson, D.L., Veeder, G.J., 1995. Volcanic eruptions on Io: heat flow, resurfacing, and lava composition. Icarus 113, 220–225.
Blöcker, A., Saur, J., Roth, L., Strobel, D.F., 2018. MHD modeling of the Plasma interaction with Io’s Asymmetric Atmosphere. J. Geophys. Res. (Space Phys.) 123, 9286–9311.
Bolton, S.J., Thorne, R.M., Gurnett, D.A., Kurth, W.S., Williams, D.J., 1997. Enhanced whistler-mode emissions: Signatures of interchange motion in the Io torus. Geophys. Res. Lett. 24, 2123–2126.
Bonfond, B., Grodent, D., Gérard, J.C., Stallard, T., Clarke, J.T., Yoneda, M., Radioti, A., Gustin, J., 2012. Auroral evidence of Io’s control over the magnetosphere of Jupiter. Geophys. Res. Lett. 39, L01105.
Broadfoot, A.L., Belton, M.J., Takacs, P.Z., Sandel, B.R., Shemansky, D.E., Holberg, J.B., Ajello, J.M., Moos, H.W., Atreya, S.K., Donahue, T.M., Bertaux, J.L., Blamont, J.E., Strobel, D.F., McConnell, J.C., Goody, R., Dalgarno, A., McElroy, M.B., 1979. Extreme ultraviolet observations from Voyager 1 encounter with Jupiter. Science 204, 979–982.
Brown, M.E., Bouchez, A.H., 1997. The response of Jupiter’s magnetosphere to an outburst on Io. Science 278, 268–271.
Brown, R.A., Chaffee, Jr., F.H., 1974. High-resolution Spectra of Sodium Emission from Io. Astrophys. J. 187, L125.
Butler, B., 2012. Flux Density Models for Solar System Bodies in CASA. Technical Report 594, ALMA.
Clarke, J.T., Ajello, J., Luhmann, J., Schneider, N., Kanik, I., 1994. Hubble Space Telescope UV spectral observations of Io passing into eclipse. J. Geophys. Res. 99, 8387–8402.
Cowley, S.W.H., Bunce, E.J., 2001. Origin of the main auroral oval in Jupiter’s coupled magnetosphere-ionosphere system. Planet. Space Sci. 49, 1067–1088.
Davies, A.G., 2003. Temperature, age and crust thickness distributions of Loki Patera on Io from Galileo NIMS data: Implications for resurfacing mechanism. Geophys. Res. Lett. 30, 2133.
de Kleer, K., dePater, I., Molter, E.M., Banks, E., Davies, A.G., Alvarez, C., Campbell, R., Aycock, J., Pelletier, J., Stickel, T., Kacprzak, G.G., Nielsen, N.M., Stern, D., Tollefson, J., 2019b. Io’s Volcanic Activity from Time Domain adaptive optics observations: 2013-2018. AJ 158, 29.
de Kleer, K., Nimmo, F., Kite, E., 2019c. Variability in Io’s Volcanism on Timescales of periodic orbital changes. Geophys. Res. Lett. 46, 6327–6332.
de Kleer, K., de Pater, I., 2016a. Spatial distribution of Io’s volcanic activity from near-IR adaptive optics observations on 100 nights in 2013-2015. Icarus 280, 405–414.
de Kleer, K., de Pater, I., 2016b. Time variability of Io’s volcanic activity from near-IR adaptive optics observations on 100 nights in 2013-2015. Icarus 280, 378–404.
de Kleer, K., de Pater, I., Ádámkovics, M., 2019a. Emission from volcanic SO gas on Io at high spectral resolution. Icarus 317, 104–120,.
de Kleer, K., de Pater, I., Davies, A.G., Ádámkovics, M., 2014. Near-infrared monitoring of Io and detection of a violent outburst on 29 August 2013. Icarus 242, 352–364. de Kleer, K., Skrutskie, M., Leisenring, J., Davies, A.G., Conrad, A., de Pater, I., Resnick, A., Bailey, V., Defrère, D., Hinz, P., Skemer, A., Spalding, E., Vaz, A., Veillet, C., Woodward, C.E., 2017. Multi-phase volcanic resurfacing at Loki Patera on Io. Nature 545, 199–202.
de Pater, I., Laver, C., Marchis, F., Roe, H.G., Macintosh, B.A., 2007. Spatially resolved observations of the forbidden SO 𝑎1𝛥→𝑋3𝛴rovibronic transition on Io during an eclipse and a volcanic eruption at Ra Patera. Icarus 191, 172–182.
de Pater, I., Roe, H., Graham, J.R., Strobel, D.F., Bernath, P., 2002. NOTE: Detection of the Forbidden SO 𝑎1𝛥→𝑋3𝛴−Rovibronic Transition on Io at 1.7 𝜇m. Icarus 156, 296–301.
Delamere, P.A., Steffl, A., Bagenal, F., 2004. Modeling temporal variability of plasma conditions in the Io torus during the Cassini era. J. Geophys. Res. (Space Phys.) 109, 10216.
Dols, V., Delamere, P.A., Bagenal, F., Kurth, W.S., Paterson, W.R., 2012. Asymmetry of Io’s outer atmosphere: Constraints from five Galileo flybys. J. Geophys. Res. (Planets) 117, 10010.
Endres, C.P., Schlemmer, S., Schilke, P., Stutzki, J., M´’uller, H.S.P., 2016. The cologne database for molecular spectroscopy, CDMS, in the Virtual atomic and molecular data centre, VAMDC. J. Mol. Spectrosc. 327, 95–104.
Feaga, L.M., McGrath, M., Feldman, P.D., 2009. Io’s dayside SO2 atmosphere. Icarus 201, 570–584.
Geissler, P.E., Goldstein, D.B., 2007. Plumes and their deposits. In: Io After Galileo: A New View of Jupiter’S Volcanic Moon. In: Springer Praxis Books / Geophysical Sciences, pp. 163–192.
Gildas Team, 2013. GILDAS: Grenoble Image and Line Data Analysis Software..
Grava, C., Schneider, N.M., Leblanc, F., Morgenthaler, J.P., Mangano, V., Barbieri, C., 2014. Solar control of sodium escape from Io. J. Geophys. Res. (Planets) 119, 404–415.
Grodent, D., Bonfond, B., Yao, Z., Gérard, J.C., Radioti, A., Dumont, M., Palmaerts, B., Adriani, A., Badman, S.V., Bunce, E.J., Clarke, J.T., Connerney, J.E.P., Glad-stone, G.R., Greathouse, T., Kimura, T., Kurth, W.S., Mauk, B.H., McComas, D.J., Nichols, J.D., Orton, G.S., Roth, L., Saur, J., Valek, P., 2018. Jupiter’s Aurora observed with HST during Juno Orbits 3 to 7. J. Geophys. Res. (Space Phys.) 123, 3299–3319.
Haggerty, D.K., Mauk, B.H., Paranicas, C.P., Clark, G., Kollmann, P., Rymer, A.M., Gladstone, G.R., Greathouse, T.K., Bolton, S.J., Levin, S.M., 2019. Jovian injections observed at high latitude. Geophys. Res. Lett. 46, 9397–9404.
Hill, T.W., 2001. The Jovian auroral oval. J. Geophys. Res. 106, 8101–8108. Hue, V., Greathouse, T.K., Bonfond, B., Saur, J., Gladstone, G.R., Roth, L., Davis, M.W.,
Gérard, J.C., Grodent, D.C., Kammer, J.A., Szalay, J.R., Versteeg, M.H., Bolton, S.J., Connerney, J.E.P., Levin, S.M., Hinton, P.C., Bagenal, F., 2019. Juno-UVS observa-tion of the Io Footprint during Solar Eclipse. J. Geophys. Res. (Space Phys.) 124, 5184–5199.
Jessup, K.L., Spencer, J.R., 2015. Spatially resolved HST/STIS observations of Io’s dayside equatorial atmosphere. Icarus 248, 165–189.
Keszthelyi, L., Jaeger, W., Milazzo, M., Radebaugh, J., Davies, A.G., Mitchell, K.L., 2007. New estimates for Io eruption temperatures: Implications for the interior. Icarus 192, 491–502.
Khurana, K.K., Kivelson, M.G., Vasyliunas, V.M., Krupp, N., Woch, J., Lagg, A., Mauk, B.H., Kurth, W.S., 2004. The configuration of Jupiter’s magnetosphere. In: Bagenal, F., Dowling, T.E., McKinnon, W.B. (Eds.), Jupiter. In: The Planet, Satellites and Magnetosphere, Cambridge University Press, pp. 593–616.
Kimura, T., Hiraki, Y., Tao, C., Tsuchiya, F., Delamere, P.A., Yoshioka, K., Murakami, G., Yamazaki, A., Kita, H., Badman, S.V., Fukazawa, K., Yoshikawa, I., Fujimoto, M., 2018. Response of Jupiter’s Aurora to Plasma mass loading rate Monitored by the Hisaki Satellite during Volcanic Eruptions at Io. J. Geophys. Res. (Space Phys.) 123, 1885–1899.
Kimura, T., Nichols, J.D., Gray, R.L., Tao, C., Murakami, G., Yamazaki, A., Bad-man, S.V., Tsuchiya, F., Yoshioka, K., Kita, H., Grodent, D., Clark, G., Yoshikawa, I., Fujimoto, M., 2017. Transient brightening of Jupiter’s aurora observed by the Hisaki satellite and Hubble Space Telescope during approach phase of the Juno spacecraft. Geophys. Res. Lett. 44, 4523–4531.
Kimura, T., Yamazaki, A., Yoshioka, K., Murakami, G., Tsuchiya, F., Kita, H., Tao, C., Yoshikawa, I., Kumamoto, A., Yamauchi, C., 2019. Development of ground pipeline system for high-level scientific data products of the Hisaki satellite mission and its application to planetary space weather. J. Space Weather Space Clim. 9, A8. Koga, R., Tsuchiya, F., Kagitani, M., Sakanoi, T., Yoneda, M., Yoshioka, K., Kimura, T.,
Murakami, G., Yamazaki, A., Yoshikawa, I., Smith, H.T., 2018a. The time variation of atomic oxygen emission around Io during a volcanic event observed with Hisaki/EXCEED. Icarus 299, 300–307.
Koga, R., Tsuchiya, F., Kagitani, M., Sakanoi, T., Yoneda, M., Yoshioka, K., Yoshikawa, I., Kimura, T., Murakami, G., Yamazaki, A., Smith, H.T., Bagenal, F., 2018b. Spatial distribution of Io’s Neutral Oxygen cloud observed by Hisaki. J. Geophys. Res. (Space Phys.) 123, 3764–3776.
Koga, R., Tsuchiya, F., Kagitani, M., Sakanoi, T., Yoshioka, K., Yoshikawa, I., Kimura, T., Murakami, G., Yamazaki, A., Smith, H.T., Bagenal, F., 2019. Transient change of Io’s Neutral Oxygen cloud and Plasma Torus observed by Hisaki. J. Geophys. Res. (Space Phys.) 124, 10, 318–10, 331.
Krupp, N., Vasyliunas, V.M., Woch, J., Lagg, A., Khurana, K.K., Kivelson, M.G., Mauk, B.H., Roelof, E.C., Williams, D.J., Krimigis, S.M., Kurth, W.S., Frank, L.A., Paterson, W.R., 2004. Dynamics of the Jovian magnetosphere. In: Bagenal, F., Dowling, T.E., McKinnon, W.B. (Eds.), Jupiter. In: The Planet, Satellites and Magnetosphere, vol. 1, Cambridge University Press, pp. 617–638.
Lellouch, E., Ali-Dib, M., Jessup, K.L., Smette, A., Käufl, H.U., Marchis, F., 2015. Detection and characterization of Io’s atmosphere from high-resolution 4-𝜇m spectroscopy. Icarus 253, 99–114,.
Lellouch, E., McGrath, M.A., Jessup, K.L., 2007. Io’s atmosphere. In: Io After Galileo: A New View of Jupiter’s Volcanic Moon. In: Springer Praxis Books / Geophysical Sciences, pp. 231–264.
Lellouch, E., Paubert, G., Moses, J.I., Schneider, N.M., Strobel, D.F., 2003. Volcanically emitted sodium chloride as a source for Io’s neutral clouds and plasma torus. Nature 421, 45–47.
Louarn, P., Paranicas, C.P., Kurth, W.S., 2014. Global magnetodisk disturbances and energetic particle injections at Jupiter. J. Geophys. Res. (Space Phys.) 119, 4495–4511.
Mauk, B.H., Haggerty, D.K., Paranicas, C., Clark, G., Kollmann, P., Rymer, A.M., Bolton, S.J., Levin, S.M., Adriani, A., Allegrini, F., Bagenal, F., Bonfond, B., Connerney, J.E.P., Gladstone, G.R., Kurth, W.S., McComas, D.J., Valek, P., 2017. Discrete and broadband electron acceleration in Jupiter’s powerful aurora. Nature 549, 66–69.
McDoniel, W.J., Goldstein, D.B., Varghese, P.L., Trafton, L.M., 2017. The interaction of Io’s plumes and sublimation atmosphere. Icarus 294, 81–97.
McEwen, A.S., Keszthelyi, L., Geissler, P., Simonelli, D.P., Carr, M.H., John-son, T.V., Klaasen, K.P., Breneman, H.H., Jones, T.J., Kaufman, J.M., Magee, K.P., Senske, D.A., Belton, M.J.S., Schubert, G., 1998. Active Volcanism on Io as Seen by Galileo SSI. Icarus 135, 181–219.
McMullin, J.P., Waters, B., Schiebel, D., Young, W., Golap, K., 2007. CASA Architecture and applications. In: Shaw, R.A., Hill, F., Bell, D.J. (Eds.), Astronomical Data Analysis Software and Systems XVI. p. 127.
Mendillo, M., Baumgardner, J., Flynn, B., Hughes, W.J., 1990. The extended sodium nebula of Jupiter. Nature 348, 312–314.
Mendillo, M., Wilson, J., Spencer, J., Stansberry, J., 2004. Io’s volcanic control of Jupiter’s extended neutral clouds. Icarus 170, 430–442.
Moses, J.I., Zolotov, M.Y., Fegley, B., 2002. Alkali and Chlorine Photochemistry in a Volcanically Driven atmosphere on Io. Icarus 156, 107–135.
Moullet, A., Gurwell, M.A., Lellouch, E., Moreno, R., 2010. Simultaneous mapping of SO2, SO, NaCl in Io’s atmosphere with the Submillimeter Array. Icarus 208, 353–365.
Moullet, A., Lellouch, E., Gurwell, M., Moreno, R., Black, J., Butler, B., 2015. Distribution of alkali gases in Io’s atmosphere. In: AAS/Division for Planetary Sciences Meeting Abstracts #47. p. 311.31.
Moullet, A., Lellouch, E., Moreno, R., Gurwell, M.A., Moore, C., 2008. First disk-resolved millimeter observations of Io’s surface and SO2atmosphere. Astron. Astrophys. 482, 279–292.
Müller, H.S.P., Thorwirth, S., Roth, D.A., Winnewisser, G., 2001. The Cologne Database for Molecular spectroscopy. CDMS. Astron. Astrophys. 370, L49–L52.
Pickett, H.M., Poynter, R.L., Cohen, E.A., Delitsky, M.L., Pearson, J.C., Müller, H.S.P., 1998. Submillimeter, Millimeter, and Microwave spectral line catalog. J. Quant. Spectrosc. Rad. Transfer 60, 883–890.
Rathbun, J.A., Spencer, J.R., Davies, A.G., Howell, R.R., Wilson, L., 2002. Loki, Io: A periodic volcano. Geophys. Res. Lett. 29, 1443.
Rathbun, J.A., Spencer, J.R., Tamppari, L.K., Martin, T.Z., Barnard, L., Travis, L.D., 2004. Mapping of io’s thermal radiation by the galileo photopolarimeter-radiometer (ppr) instrument. Icarus 169, 127–139.
Retherford, K.D., Spencer, J.R., Stern, S.A., Saur, J., Strobel, D.F., Steffl, A.J., Glad-stone, G.R., Weaver, H.A., Cheng, A.F., Parker, J.W., Slater, D.C., Versteeg, M.H., Davis, M.W., Bagenal, F., Throop, H.B., Lopes, R.M.C., Reuter, D.C., Lunsford, A., Conard, S.J., Young, L.A., Moore, J.M., 2007. Io’s atmospheric response to Eclipse: UV Aurorae observations. Science 318, 237–240.
Roth, L., Saur, J., Retherford, K.D., Strobel, D.F., Spencer, J.R., 2011. Simulation of Io’s auroral emission: Constraints on the atmosphere in eclipse. Icarus 214, 495–509. Saur, J., Janser, S., Schreiner, A., Clark, G., Mauk, B.H., Kollmann, P., Ebert, R.W.,
Alle-grini, F., Szalay, J.R., Kotsiaros, S., 2018. Wave-particle interaction of Alfvén Waves in Jupiter’s Magnetosphere: Auroral and Magnetospheric particle acceleration. J. Geophys. Res. (Space Phys.) 123, 9560–9573.
Saur, J., Neubauer, F.M., Strobel, D.F., Summers, M.E., 1999. Three-dimensional plasma simulation of Io’s interaction with the Io plasma torus: Asymmetric plasma flow. J. Geophys. Res. 104, 25105–25126.
Saur, J., Strobel, D.F., 2004. Relative contributions of sublimation and volcanoes to Io’s atmosphere inferred from its plasma interaction during solar eclipse. Icarus 171, 411–420.
Saur, J., Strobel, D.F., Neubauer, F.M., Summers, M.E., 2003. The ion mass loading rate at Io. Icarus 163, 456–468.
Schmidt, C., Schneider, N., Leblanc, F., Gray, C., Morgenthaler, J., Turner, J., Grava, C., 2018. A survey of visible S+emission in Io’s plasma Torus during the Hisaki Epoch. J. Geophys. Res. (Space Phys.) 123, 5610–5624.
Schneider, N.M., Bagenal, F., 2007. Io’s neutral clouds, plasma torus, and magneto-spheric interaction. In: Lopes, R.M.C., Spencer, J.R. (Eds.), Io After Galileo: A New View of Jupiter’S Volcanic Moon. In: Springer Praxis Books / Geophysical Sciences, p. 265.
Spencer, J.R., Lellouch, E., Richter, M.J., López-Valverde, M.A., Jessup, K.L., Greathouse, T.K., Flaud, J., 2005. Mid-infrared detection of large longitudinal asymmetries in Io’s SO2atmosphere. Icarus 176, 283–304.
Spencer, J.R., Stern, S.A., Cheng, A.F., Weaver, H.A., Reuter, D.C., Retherford, K., Lunsford, A., Moore, J.M., Abramov, O., Lopes, R.M.C., Perry, J.E., Kamp, L., Showalter, M., Jessup, K.L., Marchis, F., Schenk, P.M., Dumas, C., 2007. Io Volcanism seen by new Horizons: A major eruption of the tvashtar volcano. Science 318, 240–243.
Strobel, D.F., Wolven, B.C., 2001. The atmosphere of Io: Abundances and sources of Sulfur Dioxide and Atomic Hydrogen. Astrophys. Space Sci. 277, 271–287. Strobel, D.F., Zhu, X., Summers, M.E., 1994. On the vertical thermal structure of Io’s
atmosphere. Icarus 111, 18–30.
Tao, C., Kimura, T., Tsuchiya, F., Muirakami, G., Yoshioka, K., Yamazaki, A., Bad-man, S.V., Misawa, H., Kita, H., Kasaba, Y., Yoshikawa, I., Fujimoto, M., 2018. Variation of Jupiter’s Aurora observed by Hisaki/EXCEED: 3. Volcanic control of Jupiter’s Aurora. Geophys. Res. Lett. 45, 71–79.
Thomas, N., Bagenal, F., Hill, T.W., Wilson, J.K., 2004. The Io neutral clouds and plasma torus. In: Bagenal, F. (Ed.), Jupiter. In: The planet, satellites and magnetosphere, Cambridge Univ. Press, pp. 561–591, chapter 23.
Tsang, C.C.C., Spencer, J.R., Jessup, K.i.L., 2013. Synergistic observations of Io’s atmosphere in 2010 from HST-COS in the mid-ultraviolet and IRTF-TEXES in the mid-infrared. Icarus 226, 604–616.
Tsang, C.C.C., Spencer, J.R., Jessup, K.i.L., 2015. Non-detection of post-eclipse changes in Io’s Jupiter-facing atmosphere: Evidence for volcanic support?. Icarus 248, 243–253.
Tsang, C.C.C., Spencer, J.R., Lellouch, E., Lopez-Valverde, M.A., Richter, M.J., 2016. The collapse of Io’s primary atmosphere in Jupiter eclipse. J. Geophys. Res. (Planets) 121, 1400–1410.
Tsang, C.C.C., Spencer, J.R., Lellouch, E., López-Valverde, M.A., Richter, M.J., Greathouse, T.K., 2012. Io’s atmosphere: Constraints on sublimation support from density variations on seasonal timescales using NASA IRTF/TEXES observations from 2001 to 2010. Icarus 217, 277–296.
Tsuchiya, F., Yoshioka, K., Kimura, T., Koga, R., Murakami, G., Yamazaki, A., Kag-itani, M., Tao, C., Suzuki, F., Hikida, R., Yoshikawa, I., Kasaba, Y., Kita, H., Misawa, H., Sakanoi, T., 2018. Enhancement of the Jovian Magnetospheric Plasma Circulation caused by the change in plasma supply from the satellite Io. J. Geophys. Res. (Space Phys.) 123, 6514–6532.
Tsuchiya, F., Yoshioka, K., Kimura, T., Murakami, G., Yamazaki, A., Kagitani, M., Tao, C., Kita, H., Koga, R., Suzuki, F., Hikida, R., Kasaba, Y., Misawa, H., Sakanoi, T., Yoshikawa, I., 2019. Impact of Io’s volcanic activity to environment and dynamics in the Jovian magnetosphere: from HISAKI results. In: Proc. of the 20th Symposium on Planetary Sciences 2019.
Von Vartenberg, H., Albreeht, P., 1921. Die dampfdrucke einiger salze. Z. Elektrochem. Angew. Phys. Chem. 27, 162–167.
Williams, D.A., Howell, R.R., 2007. Active volcanism: Effusive eruptions. In: Lopes, R.M.C., Spencer, J.R. (Eds.), Io After Galileo: A New View of Jupiter’S Volcanic Moon. In: Springer Praxis Books / Geophysical Sciences, pp. 133–161. Wilson, J.K., Mendillo, M., Baumgardner, J., Schneider, N.M., Trauger, J.T., Flynn, B.,
2002. The dual sources of Io’s Sodium clouds. Icarus 157, 476–489.
Yao, Z.H., Grodent, D., Kurth, W.S., Clark, G., Mauk, B.H., Kimura, T., Bonfond, B., Ye, S.Y., Lui, A.T., Radioti, A., Palmaerts, B., Dunn, W.R., Ray, L.C., Bagenal, F., Badman, S.V., Rae, I.J., Guo, R.L., Pu, Z.Y., Gérard, J.C., Yoshioka, K., Nichols, J.D., Bolton, S.J., Levin, S.M., 2019. On the relation between Jovian Aurorae and the loading/unloading of the magnetic flux: Simultaneous measurements from Juno, Hubble space Telescope, and Hisaki. Geophys. Res. Lett. 46, 11, 632–11, 641. Yoneda, M., Kagitani, M., Okano, S., 2009. Short-term variability of Jupiter’s extended
sodium nebula. Icarus 204, 589–596.
Yoneda, M., Kagitani, M., Tsuchiya, F., Sakanoi, T., Okano, S., 2015. Brightening event seen in observations of Jupiter’s extended sodium nebula. Icarus 261, 31–33. Yoshikawa, I., Suzuki, F., Hikida, R., Yoshioka, K., Murakami, G., Tsuchiya, F., Tao, C.,
Yamazaki, A., Kimura, T., Kita, H., Nozawa, H., Fujimoto, M., 2017. Volcanic activity on Io and its influence on the dynamics of the Jovian magnetosphere observed by EXCEED/Hisaki in 2015. Earth Planets Space 69, 110.
Yoshikawa, I., Yoshioka, K., Murakami, G., Yamazaki, A., Tsuchiya, F., Kagitani, M., Sakanoi, T., Terada, N., Kimura, T., Kuwabara, M., Fujiwara, K., Hamaguchi, T., Tadokoro, H., 2014. Extreme ultraviolet radiation measurement for planetary At-mospheres/Magnetospheres from the earth-orbiting spacecraft (extreme ultraviolet spectroscope for exospheric dynamics: EXCEED). Space Sci. Rev. 184, 237–258. Yoshioka, K., Tsuchiya, F., Kagitani, M., Kimura, T., Murakami, G., Fukuyama, D.,
Yamazaki, A., Yoshikawa, I., Fujimoto, M., 2018. The influence of Io’s 2015 Volcanic activity on Jupiter’s magnetospheric dynamics. Geophys. Res. Lett. 45, 10, 193–10, 199.
Zhang, J., Goldstein, D.B., Varghese, P.L., Gimelshein, N.E., Gimelshein, S.F., Levin, D.A., 2003. Simulation of gas dynamics and radiation in volcanic plumes on Io. Icarus 163, 182–197.