A TARGET PROJECTOR FOR VIDEOGRAMMETRY UNDER VACUUM
CONDITIONS
Stéphane Roose1, Alexandra Mazzoli1, Pascal Barzin1, Pierre Jamotton1
Steven Sablerolle2, André Tavares3, Dominic Doyle3
1 Centre Spatial de Liège, Université de Liège, Avenue du Pré-Aily, B-4031 Angleur-Liège 2 SERCO Nederland BV, Kapteynstraat 1, NL-2201 BB Noordwijk
3 European Space Agency ESA-ESTEC, Keplerlaan 1, NL-2201AZ Noordwijk
ABSTRACT
Videogrammetry is a 3-dimensional co-ordinate measuring technique that (now) uses digital image capture as the recording method. Images are taken from at least two different locations and the light-rays from the camera to the measurement object are intersected by triangulation into 3D point coordinates. With a large number of images, the camera orientation and 3D point locations are accurately determined with the use of a full mathematical model (bundle adjustment). Adhesive targets are commonly used for point materialization. Those targets consist of a retro-reflective material, with an adhesive backing for sticking to the structure under investigation. A drawback of these types of targets is that they can lose their adhesion and shape during thermal vacuum cycling, especially when cryogenic temperatures are involved. In addition the operation of placing and removing targets is a critical procedure that can lead to undesirable contamination and damage to the test item. Because they require to be physically attached to the surface to be measured, this can also compromise the quality assurance of the test object. Such problems were encountered during cryogenic thermal vacuum qualification testing of the ESA Planck Surveyor mission telescope reflectors.
In the development described here the aim was to replace the use of adhesive targets by projected dots. The idea is not fundamentally new. Indeed a US company, Geodetic Systems Inc. (GSI) [1] proposes already a commercial target projector for videogrammetry which uses a flashlamp and is adequate for workshop and laboratory applications. Dot projection videogrammetry is also suggested as a shape measurement method of Gossamer structures, membrane reflectors, etc… [2][3].
Note that there are fundamental differences in use and applications of retro-reflective targets and dot projection:
• Retro-reflective targets are materialized on the test article. They appear as fiducials attached to the test article. Any relative distortion of the materialized point can be tracked with respect to the test article itself. • Projected dots are not materialized on the object. Practically a specific point cannot be tracked by this method. The dense cloud of projected dots allows sampling the surface or the shape in an arbitrary way.
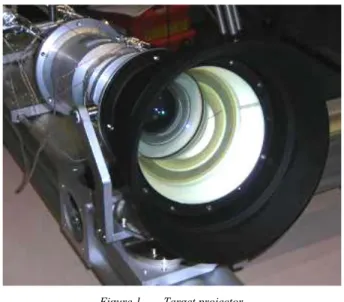
The Target Projector System (TPS), described here (Fig.1), was designed and manufactured to operate in the Large Space Simulator (LSS) of ESAof ESA under thermal vacuum conditions and to have a minimized temperature exchange with its environment. It is operational over a temperature range of 90K to 350 K, and has a wavelength of 808 nm.
Figure 1. Target projector.
Qualification tests and results under vacuum, along with an assessment of the videogrammetric accuracy achievable for various configurations of this unique device are presented.
1 INTRODUCTION
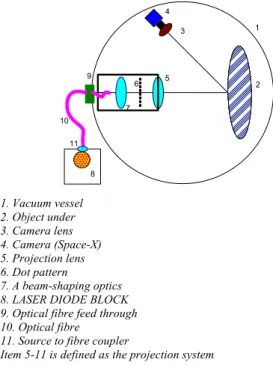
The TPS is modular in design and construction. We considered a concept, where there no electrical functions inside the vacuum chamber, except for thermal regulation of the projector barrel. Consider the functional lay–out of Figure 2.
A system is developed based on the LUMICS 144W Fibre Coupled Laser Diode (FCLD) system. The power demands require a fibre of 0.6 mm fibre, 808 nm, NA 0.22. The projector lens design is based on the centercentral wavelength @ 750 nm.
4 1 3 5 6 7 2 8 9 10 11 1. Vacuum vessel 2. Object under 3. Camera lens 4. Camera (Space-X) 5. Projection lens 6. Dot pattern 7. A beam-shaping optics 8. LASER DIODE BLOCK 9. Optical fibre feed through 10. Optical fibre
11. Source to fibre coupler
Item 5-11 is defined as the projection system
Figure 2. The proposed target projector system
2 OPTICAL DESIGN
The projection optics were designed to be broadband achromatic with a projected field of 60°. The fibre-coupled laser diode illumination optics is designed to deliver sufficient radiometric power to allow image acquisition (0.1s integration time) of the projected spots on all types of surfaces of up to 25 m2, with at least a minimum of 10% reflectivity, and at a maximum standoff distance of 5m from the object under test. Two optical designs have been made to cope with ESA requirements concerning object sizes varying between 2.5 m and 5 m. The first projector covers the Full Field of View (FFOV) (Fig.2), which is 5 m diameter; the second projector, the Semi Field of View (SFOV) (Fig.3), covers objects of 2.5 m diameter (at 5m standoff distance).
Both projectors are achromatic in the range of 500 nm to 1000 nm. The aberration balancing was made such that the geometric spot size will never exceed 1 (0.5) arcminute for FFOV (SFOV) projector, and that the spot image scene by the camera is never which is equivalent to less than half a SPACE-X camera pixel [4], when one projects the image on the SPACE-X camera.
307.238 mm
20 mm
Figure 3. Optical design of the FFOV projector.
Both projectors have the same object-field of 40 mm x 40 mm. This means that the dot-patterns (made using Chrome on Quartz lithographic techniques) are interchangeable. All lenses where custom manufactured. The illumination optics (Fig 3) before the dot-pattern is a commercial aspheric condenser lens.
3 MECHANICAL DESIGN
Dedicated barrels where made. These barrels are manufacturing in aluminium within centering and thickness tolerances: i.e the as-build lenses (thicknesses, diameters, refractive index, have been used to reiterate on lens spacing. A CMM metrology of the barrel allowed to tunetuning the final spacer thicknesses.
Figure 4. Semi Large FOV lens barrel, inside detail.
The optical design remains within its tolerances in a temperature range of 220K-320K, except for the distance between dot pattern and first lens (effective object distance). The working temperature of this distance shall remain within 293±5 K. The barrels are foreseen with a regulation thermistance and heaters.
ILLUMINATION
OPTICS PROJECTION
OPTICS
Figure 5. FFOV projector attached to water cooling system with double enclosure system. A hose protects and surrounds the
waterpiping and their fittings..
The throughput of the projector and dot-pattern is about 2%. Consequently 98% of the injected light is trapped and heats up in the barrel structure. A closed water circulation is foreseen. In order to remove heat injected by the source block, we one mounted a cooling baffle with water circulation around the cavity made by the illumination optics (Fig.4). We One foresaw a flexible metallicflexible metallic hose protecting the water pipes and preventing water leaks in the LSS.
4 THERMAL DESIGN
The TPS is isolated from the environment with MLI. Only the front lens exchanges heat with the environment. The thermal equilibrium of the TPS was calculated for the extreme temperature that can be expected in the LSS: hot case (350 K) and cold case (90K). One noticesnoticed (Fig.7, Fig.8) that the temperature of the barrel and the optics remain within the range of 220K-320K. This is within the acceptable tolerance range of the opticsderived from an opto-mechanical analysis.
Note that all these thermal simulations assume that the regulation heaters are onoperating. Also, water-cooling is mandatory in hot cycles.
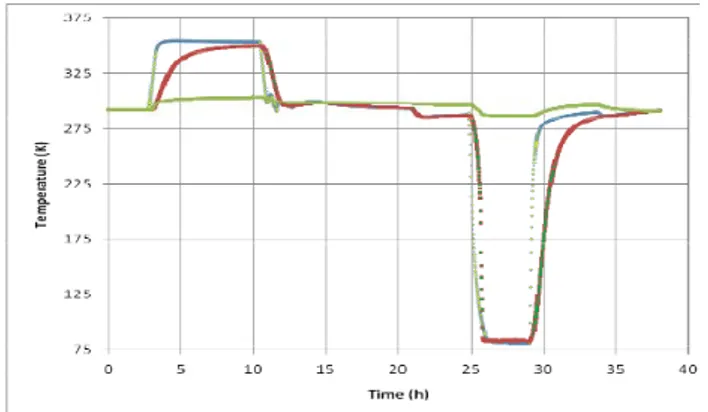
The front lens is a hot spot dissipating 6 W, in the cold case. 0 20 40 60 80 100 120 292 294 296 298 300 302 304 306 308 310 312 T_L_ext T_L_int T_holes T_fibres
Figure 6. Transient temperature evolution in the hot case (T_Shrouds 350 K) (Temperature (K) vs. Time (Minutes). Black: fibre
temperature. Green: dot pattern temperature. Blue: Barrel temperature. Red: Front lens temperature.
0 10 20 30 40 50 60 70 80 290 292 294 296 298 300 302 T_L_ext T_L_int T_holes T_fibres
Figure 7. Transient temperature evolution in the cold case (T_Shrouds 90 K) (Temperature (K) vs. Time (Minutes). Black: fibre
temperature. Green: dot pattern temperature. Blue: Barrel temperature. Red: Front lens temperature.
5 QUALIFICATION TESTING 5.1 Thermo-mechanical qualification
The thermo-mechanical qualification aimed to demonstrate the thermo-mechanical stability and design performance in the operating temperature range.
The system was tested in thermal vacuum in CSL in FOCAL5.
The TPS was submitted to a varying temperature (hot and cold cycle) and viewing permanently an object at 5 meter.
As required by ESA the centroidisation was stable during 10 minute of recording and achieved in plane stability of better than 0.1 mm.
Figure 8. Isometric view of the thermal set up in FOCAL 5
Figure 9. Shroud temperature of the SFOV projector head. Blue=>Front panel, Red=>Shroud around projector, Green=>Front
lens temperature.
Figure 10. Dot pattern of the SFOV observed by the camera. The object is black coated radiative shroud. One notices some highly reflective areas which are due to the MLI. There are 3 apertures in the
shroud covered with MLI. Some highly reflective points are due to screws. A strong loss of contrast due to reflections of the MLI tent on
the shroud.
Figure 11. FFOV projector in 353 K environment. The average of the Stdev on 10 dot positions acquired every minute: X-stdev=0.063, Y-stdev=0.062 on 480 points. (0.1mm= 0.075 pixel)
5.2 Performance testing
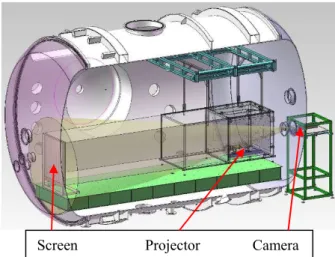
In this test we have tested the TPS in a realistic and representative Videogrammetry measurement. The FFOV and SFOV have been used in videogrammetry set-up simulating the configuration of a test geometry in the LSS (Fig. 12, Fig. 13, Fig. 14).
We demonstrated that the dot projector is feasible with a full videogrammetric measurement and with ESA’s the FODIS® software [5].
The accuracy obtainable using the TPS is at least as good as if not better than that achievable using retro-reflective targets in the same configuration. Accuracies of better than 0.1 mm are achieved.
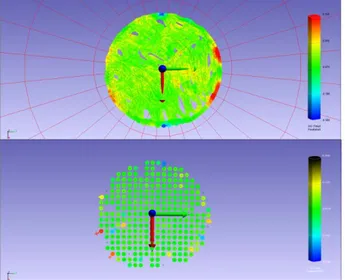
One of the objects in the test set-up was an antenna dish. ESA has made a comparison between the videogrammetry data, CMM and Laser Tracker data (Fig. 15) of the parabolic antenna dish. A paraboloid was fitted through the data of Laser Tracker. The second set of data was compared to the paraboloid. The RMS of the residuals are smaller than 0.073 mm (in Z-direction, normal to antenna surface). This gives an indication of the high -reliability of the 3D data.
Figure 12. Test object scene: a) Coded retro-reflective targets to allow FODIS® videogrammetry software to recognize the scene, these where attached on the wall of the clean room, b) scalebars with
retro-reflective targets, c) parasite retro-retro-reflective targets which already pre-exist on the test object.
Figure 13. Example of a network configuration representative for one used in the LSS. Blue: Camera stations. One recognizes the dish antenna with the projected dots and a rectangular pattern with
retro-reflective targets.
Figure 14. Data comparison: A paraboloid was fitted through the data recorded with a Laser Tracker (above). The videogrammetry data was compared to the paraboloid of the laser tracker (below) The
green color corresponds to differences of less than 0.1 mm.
Measurement RMS dX dY dZ Videogrammetry NW 3 0.0038 0.0044 0.0421 Laser Tracker LT 0.003 0.003 0.032 Fitting Paraboloid to the LT point: 0.007 0.0089 0.0727
Table 1. Fitting comparison:Videgrammetry vs LaserTracker data
The projected target centres are measurable to an accuracy of 3/100 of a pixel, considering the Space-X camera sensor system with an object depth of a minimum of 0.5 meters. Their use provides an accuracyaccuracy in object space of 20 ppm.
5.3 Radiometric aspects
Furthermore we have characterised the radiometric estimates, and demonstrated that these estimated are conform withto the predictions. Keeping in mind that theThe exposure time is strongly depended on object reflectivity and BRDF roughness of the surfaces. In this action we compared experiment and radiometric estimates made during the system design.
Object reflectivity Pixel level (% of FullWell) Exposure time (s) FCLD Current (A) 100% 100% 0.2 12 50% 50% 0.2 12 10% 10% 0.2 12
Table 2. Estimate of exposure times for various object reflectivities over the complete power range of the FCLD.
The figures of Table 2 shall be compared with the one we have obtained experimentally (Table 3). The reflectivity of the object is probably closer to 50%. The maximum greylevel is 256.
Exposure
time (s) FCLD current (A) Pixel level (greylevel)
0.2 12 140 (about 55% FW)
Table 3. Experimental integration time and radiometric budget at an object distance of 5 m.
5.4 Angular aspects
In this test we one rotated and estimated the level of the return signal. Camera and projector have a coincident position and angle with object.
Table 4. Antenna rotated with an angle of 60 degrees. The missing or attenuated dots are due to a lower reflectivity/specular reflective
materials such as MLI, Kapton with different colors.
Antenna Angle (arcdeg)
Signal level In center of Antenna (greylevel)
0 230 30 200 45 160 60 120
Table 5. Experimental signal level (white coating) for a given antenna angle.
5.5 Functional qualification
The equipment has been integrated in the LSS for a functional test and fit check of the interfaces.
The following functions have been successfully verified under ESA technical officer’s control:
- Water circulation (cooling) - Thermal regulation (heating) - Temperature monitoring
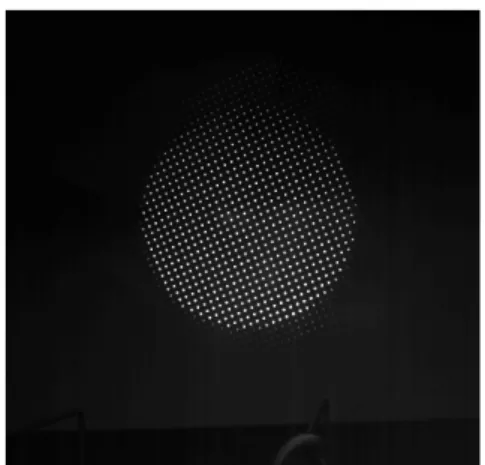
- Dot projection, recording of images (Fig. 15, Fig. 16)
Figure 15. High density dot pattern projected by the FFOV projector, recorded with the SPACE-X camera on screen.
Figure 16. Low density dot pattern projected by the SFOV projector, recorded with the SPACE-X camera on screen.
6 CONCLUSION
The (FFOV and SFOV) TPS are unique devices, developed for thermal vacuum testing in the LSS. Performances have been tested using the SPACE-X cameras and results are equivalent to measurements obtained with the use of retro-reflective adhesive targets.
The system has been evaluated/qualified in CSL in FOCAL 5. From this view point we can deriveconclude that it is “portable” (transportable/transferrable) to other thermal vacuum chambers (as for example from
FOCAL 5 to the LSS) for potential thermal vacuum applications).
We can consider that ESTEC has taken a unique advantage in acquiring such a TPS, and positions itself a major service provider for dot projection videogrammetry in thermal vacuum chambers.
The development of the TPS had a boundary, which was to obtain a product with high reliability, modularity and meet the requirements of the user. However in the design phase we have explored other design alternatives, but they require more bread-boarding activities, and feasibility assessments. One of them is the use of visible light, LEDs [6] and dedicated micro-lens arrays, in order to optimise the radiometric budget. This could be done by replacing the dot-patterns, which are energetically inefficient. IWhen indeed the pattern blocks more than 90% of the light, this unused light remains in the lens barrel and appears as a hot point in the vacuum chamber, to be cooled permanently..
This work is done under ESA GSTP contract 22012/08/NL/PA.
7 REFERENCES
[1]. http://www.geodetic.com.
[2]. R.S. Pappa et al, Dot projection photogrammetry and videogrammetry of Gossamer Space structures, Journal of Spacecraft and Rockets 40, 858 (2003). [3]. S. Roose et al. “Optical methods for non contact measurements of membranes”, Acta Astronautica 65(9-10), 1317-1329 (2009).
[4]. A. Cozzani et al., “Development of a Space Micro-Camera System for Videogrammetry Applications”, Proceedings of 21st Aerospace Testing Seminar, Manhattan Beach (CA, USA) (2003).
[5]. J. Parian et al., Network and System Design for a Photogrammetric Measurement of Large Space Structures using Projected Light Spots Targeting Approach: 2007. 6th International Symposium on Environmental Testing for Space Programmes, 12-14 June 2007, ESTEC, Noordwijk, The Netherlands. [6]. G. Casarosa et al., “Instrumentation for the New Videogrammetry System: Development of a Flashing System to be Used in Thermal Vacuum”, ESA SP. (2007).