VOL. 78, NO. 22 •OURNAL OF GEOPHYSICAL RESEARCH AUGUST 1, 1973
Ultraviolet
Observations
of Equatorial
Dayglow
above
the
Peak
A. BOKSENBERGDepartment o! Physics and Astronomy, University College, London, Enoland J.-C. G/•RAra)
Institute o! Astrophysics, University o! Liege, Belgium
Ultraviolet emissions above 540 km have been detected in the equatorial zone at a local time near 1800 with instruments aboard the TD1 A astronomical satellite. The main features of the emissions can be accounted for by resonance scattering of sunlight by Mg + ions. The observations confirm previous mass spectrometric measurements of metallic ions in the equatorial ionosphere and generally are consistent with the vertical transport mechanism proposed by Hanson and others. The emissions often are highly asymmetrical with respect to the magnetic dip equator, possibly indicating the effect of transequatorial neutral winds. Additional weaker equatorial emissions have been tentatively identified with Fe +, O +, and possibly Si + ions geographically distinct from the Mg + ions.
TD1 A was launched from Western Test
Range, California, at 0155 GMT on March 12, 1972. It was injected into a fully sunlit, nearly circular orbit of height about 550 km and period 95.5 min, with an inclination of 97.55 ø to the earth's equator to produce a sun-synchronous precession of 360 ø yr -•, or about 4 arcmin per orbit period. Thus the orbit tends to maintain its initial inclination of near perpendicularity
to the sun.
The spacecraft is fully stabilized in three axes. One axis points to the center of the sun with an accuracy of a few arcsec, and the per- pendicular axes roll about the earth-sun line
once each orbit. Of the seven scientific instru-
ments on board, two (coded S2/68 and S59) are
designed for stellar measurements in the ground- inaccessible ultraviolet. The optical axis of
S2/68 is aligned to one of the latter axes with the direction of view pointing away from the earth, and that of S59 (in standby mode) is usually directed 8.5 ø away from that of S2/68, in the direction of motion. As a consequence of
the earth's motion around the sun, the celestial sphere is scanned by these instruments along
ecliptic meridians, separated by about 4 arcmin, and complete sky coverage is achieved in 6 months. TD1 A passes into the earth's shadow for a part of each orbit about seven months
Copyright (•) 1973 by the American Geophysical Union.
after launch. Stabilization then is lost and ob-
servations are suspended until the satellite is again in continuous sunlight. Thus in relation
to the earth the active orbits are all confined near the terminator.
The purpose of this paper is to report on incidental observations of equatorial ultraviolet dayglow above the satellite altitude made by S2/68 and S59 while carrying out their main function of observing stars. The characteristics and interpretation of the dayglow measurements follow a description of the instruments.
DESCRIPTION OF THE INSTRUMENTS
S2/68. The largest of the experiments on
board TD1-A, S2/68, was prepared jointly by
teams from Belgium and Britain [Wilson et al., 1972]. It consists of a telescope feeding a three- channel grating spectrophotometer and one- channel filter photometer. The telescope mirror is an off-axis paraboloid of diameter 27.5 cm. Two main slots are set in its focal plane, one each for the spectrophotometer and photometer. The progressive scanning motion of the satellite causes the star images entering the telescope field to traverse the slots in turn. The spectro- photometer.slot is 11.9 arcmin wide in the direc- tion of motion, much wider than a star image, and 17 arcmin long. The photometer slot is 1.8 arcmin wide and 17 arcmin long.
4642 BOKSENBERG AND GI•RARD.' ULTRA¾IOLET F•UATORIAL DAYGLOW Beyond the spectrophotometer slot an ellip-
soidal secondary mirror directs a convergent beam to a plane grating, and the spectrum is formed with a dispersion of 36 A mm -• in the
plane of three fixed exit slits I mm wide. Be-
hind these slits are three photomultiplier de-
tectors. A similar detector with filter also is
placed behind the prime focus photometer slot. The traverse of a star image across the wide entrance slot of the spectrophotometer effec- tively causes the corresponding spectrum image
to move over the three exit slits in the direction
of dispersion, thus realizing a spectrum scanning action without the need for moving parts. Re- ferred to the entrance slot, the dispersion of the spectrophotometer is 126 A mm -•. The motion of the primary image during each de- tector integration interval (0.148 sec) is 0.154 mm, equivalent to 19.4 A. The effective pass- band during each integration interval has a full width at half height of 35-40 A, depending on the channel. The wavelength range 1330- 2580 A is fully covered in three slightly over-
lapping bands, 1330-1780 A, 1730-2180 A, and
2130-2580 A, by the respective channels A2, A3, and A4 in 3.3 sec, yielding a total of about
60 data points. The short-wavelength limit of this range was set at 1330 A to avoid inter-
ference-from the strong ultraviolet dayglow emissions Ly • 1216 A and OI 1304 A.
The response of the spectrophotometer to a
diffuse source is different from that for a point
source; this is discussed below in the context of the observed dayglow emissions.
The passband of the photometer channel, defined by a glass transmission filter and the tube photocathode response, is centered on 2750 A and has a full width at half height of 300 A. Near each end of the photometer slot is an additional small attitude, or guard, slot also addressing the photometer detector. When stars are being recorded, signals in these slots indicate that the primary image may be partially vig- netted by the edges of the main photometer slot and by the spectrophotometer slot.
EMR model 542 Ascop photomultipliers are used in all four detector channels. The photom- eter channel (A1) and the medium- and long- wavelength spectrophotometer channels (A3 and A4, respectively) all have a caesium tellu- ride photocathode and lithium fluoride window. In addition, the A4 detector has a spectrosil
filter to reject the overlapping second-order spectrum. The short-wavelength spectropho- tometer channel (A2) has a caesium iodide photocathode and lithium fluoride window. The photomultipliers are operated in the pulse- counting mode with the photocathode at earth potential.
A crucial feature of S2/68 is the ability to observe faint stars while exposed to full sun- light and earthlight and, to a lesser extent, moonlight. Taking into account the respective spectral ranges and fields of the photometer and spectrophotometer and the spectra of these stray light sources, the photometer is the more sensitive to stray illumination. In order to observe stars of ninth blue magnitude without significant interference from stray light, the total attenuation of sunlight, in terms of inci- dent sunlight at the full telescope aperture, is required to exceed 10 •5. The levels of attenuation required for earthlight and moonlight are corre-
spondingly lower. The direct entry of earthlight
into the telescope is not possible during normal
observing, but earthlight can enter indirectly, largely by reflection from the rear surface of
the S2/68 diffraction baffles, at times approach-
ing eclipse near the extremes of the observing period. Lunar illumination, although much weaker than the direct illumination of the other
sources, nevertheless is potentially important, since direct entry into the telescope tube can occur during normal observing.
The stray light baffle system incorporates a means of excluding direct sunlight by the use of 'diffraction baffles' which allow only components of second- or higher-order diffraction (and of scattering by dust) to enter the telescope tube. Two such baffles are fitted to the spacecraft and two more to the telescope structure mounted concentric with the tube. Carefully placed baffles within the telescope tube, largely finished with 3M 401-C10 matt black paint, then further at- tenuate the residual stray light. As far as possi- ble, these internal black baffles prevent the
primary mirror from seeing the walls of the
tube. Finally, small baffles are incorporated
near the prime focus slots to limit their view to lhe primary mirror only. It remains that
stray light can reach the detectors mainly by diffuse and near-specular reflection of the frac- tion incident on the primary mirror. Careful attention was given to the question of cleanli-
BOKSENBERG AND GI•RARD' ULTRAVIOLET EQUATORIAL DAYGLOW 4643 ne•, baffle edge profiles including paint, and
general light tightness, both for the spacecraft
and the instrument.
The design of the stray light baffle system was optimized with the aid of a Monte Carlo com- putational technique specially developed at University College in London. A detailed de- scription of the technique and the full results obtained will be published elsewhere. The flight data obtained show that the required perform- ance was fully achieved, the level of stray light being quite negligible.
S59. The instrument S59, provided by the Netherlands [Hoekstra et al., 1972] consists of a gimballed telescope spectrophotometer combination containing its own star-tracking system. Like S2/68, it incorporates efficient
stray light baffling.
In the standby mode the telescope axis is directed 8.5 ø away from that of S2/68 into the direction of the satellite scanning motion, and the light intensity in each ultraviolet channel is monitored in a 3-A band (for point sources). When an object with an ultraviolet flux ex- ceeding a certain threshold, selected from the ground, is registered in one of the detector channels, the mode is switched to 'tracking.' The telescope then locks on the star for 4 min, performing a movement counter to that of the spacecraft, while three wavebands 90 A wide centered near 2110, 2540, and 2820 A are
scanned with a resolution of 1.8 A. After com-
pletion of the measurements the instrument is returned to the standby mode.
The telescope is a Dall Kirkham with a nearly square primary mirror of sides 22 cm. A stellar image is formed about halfway between the primary and secondary mirrors, and the field of view of the telescope is restricted at this posi- tion to 50 arcmin by 10 arcmin by the spectro- photometer entrance slot. The spectrophotom- eter has a collimator and grating, both being off-axis paraboloids, and the spectra are re- corded by three pulse-counting photomultiplier detectors placed behind scanning exit slits. The photomultipliers are EMR model 641 Ascop tubes having a caesium telluride photocathode and windows of magnesium fluoride for the short-wavelength channel and 9741 glass for the other two. About 20% of the light from the collimator is directed to the tracking sys- tem, which senses the position of a star image
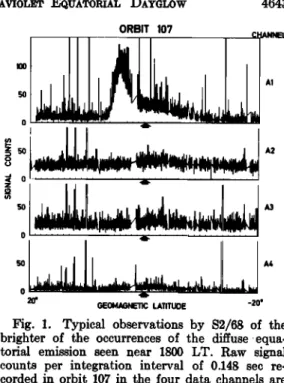
ORBIT 107 IOO 50 0 .• z 50 .• o 50 0 GEOMAGNETIC LATITUDE -20*
IANNEL
Fig. 1. Typical observations by S2/68 of the brighter of the occurrences of the diffuse equa- torial emission seen near 1800 LT. Raw signal
counts per integration interval of 0.148 sec re- corded in orbit 10'7 in the four data channels are plotted against geomagnetic dipole latitude. The position of the dip equator is indicated by the broad arrow. The satellite is at 543 km and the instrument is pointing nearly at zenith.
by means of a vibrating knife edge and tw.o
visible sensitive photomultipliers.
Because of the large spectrophotometer en- trance slot, the response of the instrument to a diffuse source is grossly different from that for a star being tracked. This is discussed
below.
THE OBSERVATIONS
In the main, the observations discussed here are those obtained by S2/68, to which we had direct accel. Where it is helpful in the identi- fication of the emission features, we also refer to observations by S59 (supplied by K. A. van der Hucht and R. I-Ioekstra).
Typical measurements of the diffuse emissions seen by S2/68 are shown in Figures I and 2. The data in Figure I were obtained in the first operational orbit of S2/68, orbit 107, which happened to show a good example of one of the brighter occurrences of the emission. In this figure, the raw signal counts (in the integration intervals of 0.148 sec) recorded in the four data channels are plotted against geomagnetic. lati- tude. We give this form of presentation because
4644 BOKSENBERG AND /•,HARD' ULTRAVIOLET EQUATORIAL DAYGLOW the emission always is observed to occur close
to the magnetic equator. The satellite is at 543 km, and the instrument is pointing nearly
at zenith. The local time is close to 1800 and is the same for all the observations discussed
here. The large narrow spikes in A1 are star recordings in the photometer channel. Corre- sponding wider spikes appear in the spectro- photometer channels A2-A4 and are displaced in the scan direction, since star images enter the spectrophotometer aperture first; these spikes actually are the three segments of the spectrum covered by the spectrophotometer. An increase in signal above background appears near the dip equator in all four channels, but is much greater in A1 than the others. The A1 signal is also quite different in shape from the others, and it appears that the signals in A2-A4 are more or less spatially related to the tail, not the main peak, of the A1 signal; also they are noticeably different from each other, that in A2 showing the broadest hump of the three and A3 the narrowest, and the center of the
hump in A4 being somewhat displaced from
those in A2 and A3.
Figure 2 shows signals in A1 and A4 for a succession of orbits plotted as in Figure 1. In each case, the satellite altitude is close to that in orbit 107. The sharply rising portions of the signals in both channels in orbits 115-118 are
due to the direct effect on the detectors of the
penetrating high-energy charged particles in the region of the South Atlantic anomaly, and they occur also in the auroral regions but less strongly. The thin vertical lines appearing in the off-scale portions of the record are due to range changes in the detector counter chains. A similar steep rise in signal is seen also in A3, but ap- pears only weakly in A2. The fact that the A2 detector is structurally and electrically identical
to the other three indicates that the increase
in signal is caused by scintillations induced in the lithium fluoride windows of the detectors, emitting predominantly at wavelengths longer than the cutoff of the A2 photocathode, the photocathode being the only difference between
• 50 i.- z • 0 z • 50
CHANNEL A1 oRerr CHANNEL A6
. .
2O' -20' 2O' -20'
GEOMAGNETIC LATITUDE GEOMAGNETIC LATITUDE
Fig. 2. Observations in the A1 and A4 channels of S2/68 for a succession of orbits plotted as in Figure 1. The position of the dip equator is again indicated by a broad arrow. The effect on the detectors of the penetrating high-energy charged particles in the region of the South Atlantic anomaly is seen in orbits 115-118. As in orbit 107, the main emission features appear at a local time near 1800 and are seen in A1 but not significantly in A4. The satellite
BOKSENBERG ANI) G•RARI): ULTRAVIOLET EQUATORIAL DAYGLOW 4645 the A2 detector and the others. Incidentally, no
confusion between the direct optical signals and particle-induced background exists either for
the stronger emissions, which occur predomi- nantly in A1, whereas particle-induced back-
ground would occur almost equally in A1, A3, and A4, or for the weaker emissions having a contribution in A2, since this channel is quite insensitive to the high-energy particles.
Referring again to Figure 2 and ignoring
the parts affected by high-energy particles, it is obvious that there is a marked difference in the
emissions seen in one orbit and the next. Major
humps in the A1 signal appear in orbits 115,
116, 117, and 119 and in general are unaccom- panied by obvious signals in A4. However, some minor humps in the A1 signal do have apparent counterparts in A4, as is seen in orbits 114 and 115. Similar humps appear in A2 and A3 in these orbits, although those in A3 are weaker
than in the others.
Another characteristic of the signals, evident
in Figure 1, is the high level of general back- ground (20-25 counts per interval) recorded in A2 and A3 relative to A1 and A4 when the
satellite is outside the regions of significant particle radiation. When a shutter in the focal plane of the telescope was closed, the back- ground levels in A2 and A3 were as low, or lower, than in A1 and A4. These high levels of background are not due to stray sunlight or earthlight, since A1 would be the channel thus most affected, and this did not show a signifi- cant increase in count rate on opening the shutter. Incidentally, this demonstrates the ex- cellence of the stray light baffle system. In the case of the background in A2, the level is much higher than expected, at the satellite altitude, for either of the dayglow zenith emissions O I 1356 A, which falls within the passband, and O I 1304 A, which does not and must be instrumen- tally scattered into the detector. But the signal is readily accounted for in terms of instrumen- tally scattered dayglow Ly a 1216 A. Labora- tory measurements of the instrumental scatter- ing in Ly a, obtained during the calibration and testing phases, gave a value of approximately
4 X 10 -'• for the relative flux scattered into the
A2 detector from Ly a radiation entering the spectrophotometer from anywhere in the prime focus slot. Taking the accepted value of a few
kilorayleighs for the 540-km zenith intensity of the Ly a dayglow and applying the above scattering factor and the instrument parameters gives a value for the background counting rate close to that observed. This explanation also accounts for the background in A3. A1 and A4 have filters preceding the detectors (the former to define the passband, the latter to exclude the second-order spectrum) which do not pass Ly a, and so these channels are not affected.
Returning to the main emission observed near
the dip equator, directly corresponding signals such as those recorded in A1 are observed in
all three channels of S59, generally when the instrument is in the stand-by mode and there-
fore directed 8.5 ø away from S2/68. The lack of detectable spatial dispersion between the signals recorded by the two instruments, which
both have a small field of view compared with
their angular separation, immediately rules out
the features as direct emissions from distant
objects. Several other possibilities were inves-
tigated
and also
rejected,
among
them: sunlight
reflected off local debris or an ejected portion
of the spacecraft, moonlight entering the tele-
scopes,
and sunlight locally scattered from
gas releases
during the frequent periods
of
momentum unloading. The only convincing ex-
planation
that emerged
was that the emission
occurs in the terrestrial atmosphere.
The general characteristics of the airglow
have been deduced from only a small sample of the full data available for the first few
months of operation. It is evident that the main emission is highly variable from orbit to orbit but occurs always near the dip equator and
always
on the dusk side of the earth at a local
time near 1800. Frequent occurrences of rela-
tively high signal level, as in orbit 107, are observed throughout the period studied, but
mostly
the level is lower than this, as in orbits
115-117,
or barely observable,
as in orbit 114.
It is probable that the emission is always pres-
ent to a greater
or lesser
degree
but sometimes
is below detection for these instruments, which
are not designated
to be efficient
for the detec-
tion of diffuse sources.
Quantitative
details
relating
to the intensity
and spectral characteristics
of the observed
4646 BOKSENBERG AND GI•RARD' ULTRAVIOLET EQUATORIAL DAYGLOW SPECTRAL AND INTENSITY CI-IARACTERISTICS OF
TI-IE EQUATORIAL DAYGLOW
To interpret the observations outlined above,
we now consider the responses of the instru- ments to a spattally diffuse emission source.
Both the S2/68 and S59 spectrophotometers are essentially slitless, and in normal operation the spectral resolution is defined by the effective widths of the star images. But, as has already been stated, the diffuse atmospheric emissions are recorded by S59 generally not when it is in the tracking mode but in the standby mode, with the telescope and spectrophotometer pas- sive. Then, assuming first a monochromatic diffuse source, S59 behaves in similar fashion to the spectrophotometer part of S2/68: flux is received into the solid angle defined by the angular projection, into the focal plane of the telescope, of one or more of the exit slits at the appropriate wavelength positions in the pro- jected spectrum format. If more than one wave-
length is present, the situation is compounded accordingly.
The instrumental solid angles corresponding to a monochromatic diffuse source are 18.7
arcmin 2 for the three S2/68 spectrophotometer
channels and 1.2 arcmin • for the three S59 chan-
nels. The acceptance solid angle for the S2/68 photometer channel, defined by the main slot and the attitude slots combined, is 33.1 arcmin •. The monochromatic responses to a diffuse source are given for both instruments as a function of wavelength in Figure 3 and include all relevant instrument parameters. The ordinates are in units of signal counts per Rayleigh accumulated over the appropriate integration intervals: 0.148 sec for S2/68 and 1.02 sec for S59. The absolute spectral responses are shown to the limits of the detector channels for S2/68, but only within the normal mode passbands for S59. For the latter, the approximate spectral limits defined by the spectrophotometer en- trance aperture also are indicated.
S59 I i i i i i i 2 1
S2/68
25s0A
(S2168)I
I ~2sooA
(S 59) I A2 1.•00 2000 2500 3000 WAVELENGTH (•)Fig. 3. Monochromatic responses of S2/68 and S59 to a spattally diffuse source given as a function of wavelength. Note the difference in scale for the sensitivities of the two in- •truments. Complete responses are given for the four channels of $2/68, but responses (marked 1, 2, and 3) only within the spectral regions of the normal mode passbands for S59. The approximate spectral limits defined by the spectrophotometer entrance aperture also are indicated for the latter. The significance of the spectral region between the indicated bounds 2580 A and about 2800 A is discussed in the text.
BOKSENBERG AND GI•RARD: ULTRAVIOLET EQUATORIAL DAYGLOW It was stated in the preceding section that
the main emission features seen exclusively in the A1 channel of S2/68 also appear in all three channels of S59. As is indicated in Figure 3, we can deduce that the wavelength of the emission features, if the emission is monochromatic, must be bounded at 2580 A defined by S2/68, and at about 2800 A defined by S59. If not mono- chromatic, then the lower bound remains at 2580 A, and a substantial proportion of the
emission still must fall below about 2800 A. In the case of the main emission observed
in orbit 107, the peak signals in counts per integration interval are approximately 100 for the S2/68 A1 channel and approximately 4, 14, and 10 for the respective channels 1-3 of S59. If the diffuse source emits predominantly near 2800 A, we see from the figure that the respec- tive signal counts in the A1 channel of S2/68
and channel 3 of S59 should be in the ratio of
14. The ratio actually observed is 10. Alterna- tively, if the emission occurs predominantly near 2600 A, the corresponding instrumental ratio for the A1 channel of S2/68 and channel 2 of S59 is 6, to be compared with the observed count ratio of 7. However, no particular con- clusions can be drawn from these two, or any intermediate, cases, since the absolute photo-
metric calibrations of the two instruments are not expected to compare to better than 50%.
Assuming the emission to be predominantly in the indicated range of about 2600-2800 A, the peak intensity of the main feature observed in orbit 107 is in the range 500-1000 rayleighs, judging from the data and instrument param-
eters of S2/68. On the same basis, the peak intensities observed in orbits 115-117 are in
the approximate range 100-200 rayleighs.
SPECTRAL IDENTIFICATION
We now examine several likely candidates for the observed dayglow on the basis of the spectral characteristics deduced above. The main aim of this discussion is to identify the strong component of the emission seen in chan- nel A1 of S2/68. Where appropriate, we refer
also to the weak emissions evident in this and the other channels.
Photoelectron excitation o[ the N• Vegard- Kaplan bands. The Vegard-Kaplan (VK) bands may be excited either directly or by cascades from upper levels. The stronger bands
4647
in the region 2580-2800 A are 0-5 at 2604 A, 0-6 at 2761 A, and 1-6 at 2656 A. I-/owever, other bands of the same system should be ob- served also in other channels of S2/68' for example, 0-4 at 2462 A in A4. From the
relative transition probabilities of the bands in
the VK system [Shemansky, 1969] and the S2/68 spectral response, signal ratios in other S2/68 channels relative to A1 should be much higher than the observed upper limits. Further- more, the fact that the emission is spattally related to the magnetic dip equator, indicating a form of magnetic control, suggests that the species responsible for this is ionic, not neutral.
NO 7 band fluorescence scattering o) • sun- light. Two bands at 2670 A and 2800 A fall in the defined wavelength range. However, from the Strobel et al. [1970] model for NO vertical distribution the zenith intensity from 540 km
would be expected to be much less than I ray-
leigh. In any case, some of the stronger bands
of the NO 7 system lie below 2580 A, and these
are not detected as such in the other S2/68 channels. Finally, as in the case of N•, the observed spatial distribution argues against a neutral species.
Radiative recombination o• 0 •. The radia- tive recombination processes
O*(4S) -[-e--• O* -[- hy (continuum) (1)
O* --• O(3P) -[- hy (discrete)
(2)
have been put forward in explanation of an equatorial nightglow observed to lie in zones at 12-15 ø north and south of the magnetic dip equator [Hanson, 1969] and identified to be
predominantly 1304 and 1356 A line emissions
of atomic oxygen [Hicks and Chubb, 1970; She#er, 1971]. Tinsley et al. [19'72] have shown that these processes can account for the ob- served 0 I 1304 A and 1356 A intensities when a suitable electron density profile is used. If
the oxygen atom yielded by (1) is in the 3s5S ø term (upper term for the 1356 A line) the
associated continuum emission ranges between 2700 A and 2772 A. However, the emission rate
of this continuum is much lower than that of the 1356 A line, since the 3s5S ø term is strongly
populated also by cascades from upper terms, whereas the continuum is. emitted only through direct recombinations into this term. Tinsley
4648 BOKSENBERG AND GIRARD' ULTRAVIOLET ]•QUATORIAL DAYGLOW that the emission rate at 1356 A through proc-
esses (1) and (2) is about 20 times that of the
•2700-2772 A continuum. Our observations in
the S2/68 A2 and A1 channels, which include, respectively, these line and continuum emissions, are quite contrary to this. Thus we conclude
that the continuum emission cannot be the
explanation for the main component of the dayglow reported here. However, an identifica- tion with the 0 I 1356 A emission is still possi- ble for the weak hump in the A2 signal frequently observed.
Radiative recombination o• He* into the np3P ø (n _• 7) terms (• He I. Emission occurs
at wavelengths below 2764 A through the transi- tions 2s3S-np•P ø. However, the He* latitudinal distribution observed by Taylor et al. [1969] is quite different from that of the dayglow ob- served here. This, together with our observed dawn-dusk difference and day-to-day variabil- ity, not expected for He*, causes us to reject this mechanism in the present context.
Fe II a 6D-z •Dø(2586-2631 A) and Mg II 2796, 2803 A resonance scattering of sunlight. The presence of metallic ions of meteoric origin in layers centered near !00 k_m__ has been observed both by mass spectrometry [Narcisi, 1968) and by ultraviolet spectroscopy [Anderson and Barth, 1971]. As was described by Hanson et al. [1972], the polarization field associated with the equa- torial electrojet will raise ions out of dense source layer near 100 km, but only in a narrow region centered on the dip equator. Subsequent vertical E x B drift, coupled with motions along the magnetic field, can move the ions to greater heights and greater latitudes. Ions of mass 56 amu, taken to be Fe *, have been observed by a retarding potential analyzer on Ogo 6 in the nighttime equatorial ionosphere at altitudes
between 400 and 1000 km at densities oc-
casionally exceeding 2 X 10³ ions cm -3 [Hanson and Sanatani, 1970]. Good correlation between the presence of Fe * and irregularities in the total ion concentration (the latter, probably a mani- festation of equatorial spread F) was also observed [Hanson and $anatani, 1971]. The resolution of the Ogo 6 retarding potential analyzer was too low to detect the presence of Mg + (mass 24 amu), but a species of mass about 30 amu, possibly Si + (mass 28 amu), was ob- served in concentration comparable to that of
Fe + and exhibited the same latitude variations.
The theory of resonance scattering has been
discussed by Chamberlain [1961]. Assuming
the atmosphere to be optically thin (this can easily be checked a posterJori and is true for the cases considered here), the intensity in rayleighs of a diffuse source of resonant atoms or ions undergoing transitions between a lower level 1 and an upper level u, at wavelength A
(cm), is R = 10 -6
2
A,,•
ß
lß n,(z)
R = 10-6.gX
ß
nz(z) dz
(4)
where vFx is the solar flux (ph cm -2 sec-•(cm spectral interval)-•),
•'e2/m½
2 = 8.85 • 10
-13 cm
fx is the oscillator strength of the transition, n•(z) is the number density of the scattering species in the level 1 at height z and is integrated
above height Zo, A,•/W.•A,• is the branching ratio, taking into account other possible transi-
tions from the same upper !cvcl, and gx is the
emission rate factor.
Expression 3 can be used as such for singlet-
singlet transitions or for one component of a multipier. In the latter case •he integral is the slant density of atoms or ions in the J level
considered.
The problem is relatively simple for Mg*, which has two allowed transitions in the middle
ultraviolet forming a closely spaced doublet at wavelengths 2802.698 A corresponding to the
2 2po
3s S,•-3p •/• transition and 2795.523 A to the
2 2po
3s S,/•-3p •/• transition. Values of gx for this doublet have been calculated by Anderson and Barth [1971]'
Mg II' gesos•
= 3.7 X 10
-•' ph sec
-1
Mg II' ge•6• = 9.1 X 10
-• phsec
-1
The case for the Fe II a •D-z •D ø resonance multiplet is more complicated, since both mul- tiplet arrays are composed of five levels. One
should solve the whole set of fluorescence steady-
state equations, taking into account cascades populating or depopulating the upper or lower term, and should deduce the equilibrium popu- lation of the lower levels. The emission rate fac-
BOKSENBERG AND GIRARD' ULTRAVIOLET EQUATORIAL DAYGLOW 4649
tors then should be calculated for each line and
the sum obtained. This procedure requires
knowledge of all the Einstein factors B,,, which
unfortunately are lacking in the case of Fe II ultraviolet lines. However, here we are not interested in the individual intensities of the
lines but rather in the sum of the intensities.
This can be reasonably estimated by using a multipict / value/• defined by
M' -- i
where g, is the statistical weight of a lower level
of the multipier, •, is an individual • value, and g• is the statistical weight of all lower levels of the multipier. With regard to the branching ratio, the only nonintercombination transition
to the z 6Dø term in a 6•-z 6D ø, and since this is •orbidden (AL = 2) and involves a two-
•lectron jump, it is unlikely to contribute
ef•eiently in depopulating the upper term. For
the solar flux, a value (f'•) averaged over the multipict lines must be used. From Kachalov
and Yal•o.vleva [1962] we obtain (F•,) -- 8 X
10 • ph cm -• sec -• A -•. Then, based on/• - 0.26
[Takens, 1970], the resulting emission rate fac-
tor is
Fe II' g•.ss6-•.63•A
•--- 1.3 X 10 -•' ph sec
-•
Taking into account the S2/68 instrument parameters, the scale factors relating the count
rates in the A1 channel to the column densities
of Mg* and Fe* ions work out to be' Mg II'
4.4 • 10
• Mg* ions cm
-• count
-• in A1
Fe II'
-2 1
7.2 • 10 s Fe* ions cm count- in A1
Using a similar procedure to evaluate the sensi- tivity of S2/68 to the ultraviolet lines of the other Fe II resonance multipicts a *D-z•F ø and a •D-z •P•, which fall within the range of A4 channel, we obtain
Fe II' 3.0 X 10 • Fe + ions cm -• count -• inA4
It follows that if the main emission compo- nent is due to resonance scattering by Fe* ions, the signals in A1 and A4 should be in the ratio 4' 1. But the ratio is observed to exceed 20' 1, and so we reject Fe* ions as the cause of the more intense dayglow emission. However, the
minor hump in the tail of the A1 signal cen-
tered on the dip equator in orbit 107 is indeed about four times greater than the weak signal
in A4 at the same latitude, and perhaps can be
attributed to the presence of Fe* ions. How-
ever, in other orbits, corresponding weak sig-
nals in A1 and A4 not directly related to the main emissions do not consistently show in the
ratio 4:1.
Nevertheless, it remains that we ascribe the
main dayglow emission to resonance scattering of sunlight by Mg* ions above 540 km. A rough
estimate of the ion density at the satellite alti- tude can be made by assuming that the ion abundance decreases exponentially with a scale-
height of about 100 km. A signal level of 100
counts in A1 (orbit 107) would then correspond to a concentration of about 4.4 X 10 • Mg* ions
cm '-•. This is comparable to the concentrations of Fe* ions and ions of mass about 30 amu observed by Ogo 6 [Hanson and Sanatani,
1970].
Furthermore, if the signal level of about 5
counts in A4 observed in orbit 107 is assumed
to be due to Fe * ions of the same scale height as the Mg * ions, the concentration at the satel-
lite altitude is about 1.5 X 10 • Fe * ions cm -•.
This still is consistent with the Ogo 6 obser- vations. In addition, the general dispersion in the signals in A1 and A4 indicates a difference
in spatial distribution for Mg * ions and Fe * ions.
This also is true for 0 * if the signal frequently observed in A2 is attributed to this ion, as was
suggested above. In this context, there could be
an additional contribution to the signal in A2 from resonance scattering by Si * ions at 1533 A and 1527 A. Other resonance lines of Si * fall in A3 at 1808 A and 1817 A and may account for
a very weak signal often seen also in this channel.
CONCLUSION
The main equatorial dayglow features fie-
quently observed by the TD1 A sate]lite above
540 km in the late afternoon sector can be
accounted for by resonance scattering of sun- light by Mg + ions. The observations confirm previous mass spectrometric measurements of
metallic ions in the equatorial ionosphere as far as abundance and spatial distribution are con-
cerned and generally are consistent with the fountain mechanism proposed by Hanson et al.
4650 BOKSENBERG AND GIRARD' ULTRAVIOLET EQUATORIAL DAYGLOW
[1972]. The observed asymmetry with respect to the magnetic dip equator possibly indicates
the effect of transequatorial neutral winds, which were not specifically included in the sim-
plified theoretical models. Additional weaker equatorial emissions have been tentatively iden- tified with Fe +, O +, and possibly Si + ions geo- graphically distinct from the Mg + ions. These may point to a fundamental insufficiency in the
theory.
We have briefly attempted to relate the ob- served occurrences of the main emission with
solar (R•) and planetary (Kp) activity indices,
but could find no correlation. However, when
comparing with local K indices, either for the
noon or late afternoon periods, we find a sig- nificant anticorrelation: no case of appreciable
ultraviolet dayglow was evident for days of high activity. This suggests that quiet condi- tions are required for the fountain mechanism
to operate efficiently.
The complete analysis of the TD1 A results should provide useful information on the equa- torial E field configuration and its variability over long periods. Future work will include a statistical analysis of the morphology and fre- quency of occurrence of the emissions, a search for systematic longitudinal or seasonal effects, comparisons with bottomside and topside iono-
spheric soundings, and a study of the relation
with magnetic K indices and spread F occur-
rences.
Acknowledgments. We would like to thank
A. Monfils, R. Wilson, K. A. van der Hucht, and
R. ttoekstra for the use of the data from TD1 A,
and C. Jamar, A. Tilkin, B. E. Anderson, P. J. Barker, R. Evans, D. G. Ross, and H. Wroe for help in acquiring the data and in data reduction.
We are also indebted to B. Bates, M. Fridman,
N. V. Grevesse, D. Rees, and B. A. Tinsley for valuable suggestions and discussions.
One of us (G,•rard) was supported by the National Foundation for Scientific Research,
Belgium.
***
The Editor thanks T. A. Chubb and W. B. Hanson for their assistance in evaluating this
paper.
REFERENCES
Anderson, J. G., and C. A. Barth, Rocket investi- gations of the Mg I and Mg II dayglow, J. Geophys. Res., 76, 3723, 1971.
Chamberlain, J. W., Physics o! the Aurora and Airglow, Academic, New York, 1961.
Hanson, W. B., Radiative recombination of atomic ions in the night time region, J. Geophys. Res.,
74, 3720, 1969.
Hanson, W. B., and S. Sanatani, Meteoric ions above the F• peak, J. Geophys. Res., 75, 5503,
1970.
Hanson, W. B., and S. Sanatani, Relationship between Fe + ions and equatorial spread F, J.
Geophys. Res., 76, 7761, 1971.
Hanson, W. B., D. L. Sterling, and R. F. Wood- man, Source and identification of heavy ions in the equatorial F layer, J. Geophys. Res., 77,
5530, 1972.
Hicks, G. T., and T. A. Chubb, Equatorial aurora/ airglow in the far ultraviolet, J. Geophys. Res.,
75, 6233, 1970.
Hoekstra, R., K. van der Hucht, Th. Kamper- man, H. Lamers, A. Hammerschlag, and W. Werner, First ultraviolet stellar spectra from the orbiting stellar spectrophotometer S59, Nature Phys. Sci., 236(69), 121, 1972.
Kachalov, V. P., and A. V. Yakovleva, The ultraviolet solar spectrum in the region 2470-
3100 A, Akad. Nauk SSSR, 27, 5, 1962.
Narcisi, R. S., Processes associated with metal-ion
layers in the E region of the ionosphere, Space
Res., $, 360, 1968.
Pearce, J. B., Some observations of the earth's
ultraviolet dayglow, in The Radiating Atmos- phere, edited by B. M. McCormac, D. Reidel, Dordrecht, Netherlands, 1971.
Sheffer, E. K., Nocturnal emissions of the atmos- phere in the X 1304A oxygen line at low geomagnetic latitudes, Kosm. Issled. 9, 74, 1971. Shemansky, D. E., N• Vegard-Kaplan system
in absorption, J. Chem. Phys., 51, 689, 1969.
Strobel, D. F., D. M. Hunten, and M. B. McElroy,
Production and diffusion of nitric oxide, J.
Geophys. Res., 75, 4307, 1970.
Takens, R. J., On the determination of oscillator strengths from free burning arcs, Astro•. As- trophys., 5, 244, 1970.
Taylor, H. A., H. C. Brinton, D. L. Carpenter, F. M. Bonner, and R. L. Heyborne, Ion de-
pletion in the high latitude exosphere; Simul-
taneous Ogo 2 observations of the light ion
trough and the VLF cutoff, J. Geophys. Res.,
74, 3517, 1969.
Tinsley, B. A., A. B. Christensen, J. Bittencourt, H. Gouveia, P. D. Angreji, and H. Takahashi, Excitation of oxygen permitted line emissions in the tropical nightglow, J. Geophys. Res., 78,
1174, 1973.
Wilson, R., S. Gardier, C. Jamar, J.P. Macau, D. Malaise, A. Monfils, H. E. Butler, C. M. Humphries, K. Nandy, G. D. Thompson, P. J. Barker, H. Wroe, L. Houziaux, and A. Boksen- berg, Early data from the ultraviolet sky- scan telescope in the TD I satellite, Nature Phys. Sci., 238, 34, 1972.
(Received December 27, 1972;