DOI: 10.5897/AJB2017.16278 Article Number: D71B6C956211 ISSN 1684-5315
Copyright © 2018
Author(s) retain the copyright of this article http://www.academicjournals.org/AJB
African Journal of Biotechnology
Full Length Research Paper
Agronomic evaluation and web blight resilience of
common bean genotypes in the littoral region of
Ecuador
Ronald Villamar-Torres
1,2,7*, Luis Godoy Montiel
l ,2, Julio Muñoz-Rengifo
1,5, Samir Zambrano
Montes
2, Seyed Mehdi Jazayeri
8, Naga Raju Maddela
3,4, Luis Alcivar Torres
6, Alexis Matute
Matute
1, Marcos Heredia Pinos
1, Ousseini Issaka Salia
9and Felipe Garcés-Fiallos
10,111Secretaría Nacional de Educación Superior, Ciencia, Tecnología e Innovación (SENESCYT), Ecuador. 2Facultad de Ciencias Pecuarias. Universidad Técnica Estatal de Quevedo. Quevedo, Los Ríos, Ecuador. 3Department for Management of Science and Technology Development, Ton Duc Thang University, Ho Chi Minh City,
Vietnam.
4Faculty of Applied Sciences, Ton Duc Thang University, Ho Chi Minh City, Vietnam.
5Departamento Ciencias de la Tierra, Carera de Ingeniería Agropecuaria. Universidad Estatal Amazónica, Puyo, Pastaza, Ecuador.
6Facultad de Ciencias Agropecuarias. Universidad Técnica de Babahoyo. Babahoyo, Los Ríos-Ecuador. 7Programme de Doctorat en Biologie Intégrative, Diversité et Amélioration des Plantes. Université de Montpellier,
France.
8Departamento de Biología, Facultad de Ciencias, Universidad Nacional de Colombia. Bogotá, Cundinamarca, Colombia.
9Faculty of Sciences and Techniques. Abdou Moumouni University of Niamey, Niger. 10Facultad de Ciencias Agrarias, Universidad de Guayaquil (UG), Guayaquil, Ecuador. 11Facultad de Ingeniería Agronómica, Universidad Técnica de Manabí. Portoviejo, Ecuador.
Received 14 October, 2017; Accepted 13 February, 2018
Common bean is very important in the daily diet of Ecuadorians. Web blight (Rhizoctonia solani (Kuhn) is the major constraint faced by common bean farmers in Ecuador and everywhere in the world, causing high losses of yield grain every year. A constant selection of genotypes with excellent productive and resilience to disease features in each region is presented as a potential solution to these problems. The present study aimed to evaluate the phenology, web blight resilience and grain yield production of 17 common bean genotypes in field conditions, in the Guayas River Basin, Ecuador. Three commercial varieties (two belonging to determined feature and one to undetermined feature) and 14 more promising genotypes were evaluated. Day period for phenological stage R6 (full bloom) and R9
(flowering maturity), web blight resilience, number of harvested pods, number of grains per pod per plant, 1000-seed weight, grain yield and later yield per hectare were measured. Scott Knott test (p ≤ 0.05) was executed for mean comparisons and principal component analysis (PCA) statistical test was performed using the productive and agronomical variables, successfully distinguishing two group of genotypes according to their types of growth (determined and undetermined), highlighting the genotypes 6-103, 6, CAL-96, INIAP-473, AFR-619, INIAP-474, AFR-298, SER-29, SER-35, EVG-16-08 which showed the higher agronomic, sanitary, and productively averages in approximately all the studied variables.
INTRODUCTION
Factors such as increase of crop yield, lessening production costs, preserving the health of farmers by avoiding the use of chemicals on fields for pest and diseases control have been considered by the agronomists nowadays as parts of the programs for plant protection and breeding (Muñoz-Rengifo et al., 2014; Villamar-Torres et al., 2016; Martinez et al., 2017).. Common bean (Phaseolus vulgaris L.) in Ecuador is consumed owing to its nutritional value and accessibility, contributing as a main constituent of the primary diet of the Ecuadorian population. Many advantages are known about the consumption of common beans. Among them, one is providing important nutrients for a correct alimentation for humans as well as for animals, because it contains high proportion of proteins, vitamins, and minerals (Petry et al., 2015). On the other hand, common bean plants are also known to fix the atmospheric nitrogen and improve the soil fertility, hence contributing to the output of other crops (Rondon et al., 2007). An overview of five years' data from 2011 to 2015 on the production of common bean in Ecuador indicated that 311,147 ha in all parts of the Ecuadorian territory were harvested approximately, from which 174,964 ha were of dry bean and 136,183 ha of fresh bean, representing 56.23 and 43.77% of national production, respectively. Likewise, 59,139 ton of dry bean and 87,487 ton of fresh bean have been reported for this period. The average nationwide harvested area in 2012 was 63,487 ha, corresponding to 52.7% of dry bean and 47.3% to fresh bean, with a yield of 0.28 t ha-1 for dry bean and 0.53 t ha -1 for fresh bean respectively. A decline of 36% (~35,258 ha) in the sowing area respecting the year 2011 was observed. However, a higher yield percentage (15 and 10%, respectively) in 2012 has been noted.
Geographical distribution is given around the central area of the Ecuadorian coast, which is one of the most suitable zones for productive agricultural development of this leguminous plant, highlighting the cantons of: Milagro, Naranjito and Pedro Carbo in the province of Guayas; Babahoyo, Vinces and Quevedo in the province of Los Rios (Godoy-Montiel et al., 2011). This makes it one of the most representative areas for planting this valuable legume, although there is also an important representation in the meso-thermal high mountain valleys of the country (Falconí-Castillo, 2005; Torres-Navarrete et al., 2013). In the province of Los Rios and its influence area (neighboring cantons of the provinces of Guayas, Manabi, Bolivar and Azuay), mostly recommended materials for other areas of the country (Guayas, Manabi or Imbabura), recycled seeds usually from the informal market are used especially by small farmers. Habitually,
the producer does not obtain a germination rate above 80%, reflecting in a low crop production and less profitability for the producer. This crop is also suffering from a pathogen, namely necrotic fungus Rhizoctonia
solani (Kuhn), causing the leaf disease named web
blight. Web blight disease, impacting yield (Costa-Coelho et al., 2014; Rodríguez et al., 2015) and many plant features (number of nodes, number of pods and number of seeds per plant), is consequently considered as the main fungal disease, representing big losses for the small farmers in Latin America (Godoy-Lutz et al., 2008; Rodríguez et al., 2015), Ecuador and around of the Province of Los Rios (Garcés-Fiallos et al., 2013). The direction of Research, Science, and Technology (DICYT) of the Technical State University of Quevedo (UTEQ) has been working to obtain common bean varieties with ideal productive and sanitary features for the central coastal zone of Ecuador. Nowadays, it has led to obtaining the first and promising genotypes with determined and undetermined growth habit, that some of them were studied in this work. Consequently, based on the need to continue this study of common bean genotypes, the aim of this work was to evaluate the phenology, web blight resilience and grain yield production of common bean genotypes in Ecuador field conditions.
MATERIALS AND METHODS Trial management
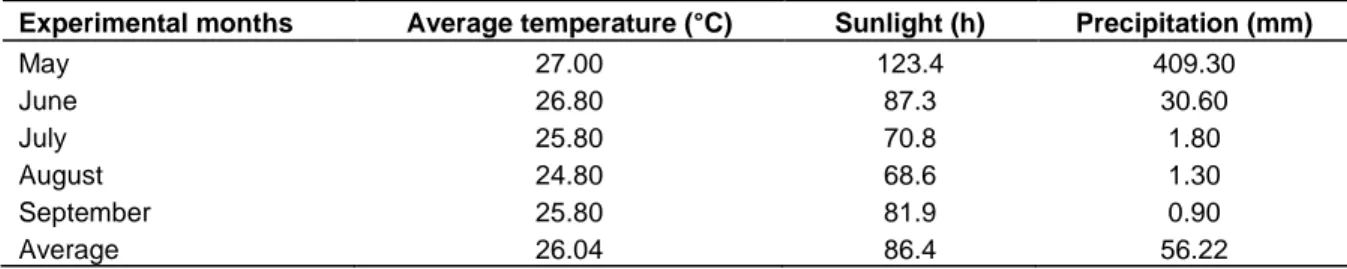
This experiment was carried out during the dry season (summer) of 2012 at the Experimental Farm of “La María”, UTEQ, Quevedo - Ecuador whose geographical coordinates are Western longitude 79° 27´ 42´´ and Southern latitude 01° 06´ 0´´. The conditions of the study site are as follow: moist forest – tropical climate zone, average temperature of 24.2°C, and relative humidity of 77.4%, total sunlight of 823 h/light/year, and annual precipitation of 1537 mm. The ground topography is flat with a clay-loamy soil texture and pH of 5.7. Climatic conditions during the experimental time when the crop was established maintained normal and suitable for agronomic and productive development of common beans. The temperature throughout the experiment had an average of 26.04°C, with accumulative sunlight and rainfall of 86.4 h and 56.22 mm respectively (Table 1).
With respect to the soil preparation, an only-pass plow and two dredges were performed three days before planting in order to prepare the experimental site. Before sowing, the seeds were previously disinfected by a dose of 1 g per 1 kg seed of a mixture of Carboxin and Captan (active ingredient). Subsequently, the seeds were planted manually using a handspike, placing two seeds per hole and after 12 days proceeded with the thinning. The spacing used between rows was 0.50 m, while the separation distance between plants was 0.20 m (5 plants per meter in row or 100,000 plants per hectare). The experimental area contained 68 plots, each with 7.5 m2 areas; constituted of four rows and totaling 510 m2.
*Corresponding author. E-mail: [email protected], [email protected]
Author(s) agree that this article remains permanently open access under the terms of the Creative Commons Attribution License 4.0 International License
Table 1. Temperature (°C), sunlight (hours) and water precipitation (mm) during crop cycle.
Experimental months Average temperature (°C) Sunlight (h) Precipitation (mm)
May 27.00 123.4 409.30 June 26.80 87.3 30.60 July 25.80 70.8 1.80 August 24.80 68.6 1.30 September 25.80 81.9 0.90 Average 26.04 86.4 56.22
Fertilization was done in two fractions, at phenological status V3 (3rd trifoliolate leaf unfolded at node 5), using a NPK source of: 80-40-40 kg ha-1. To control weeds in a pre-emergence manner,
herbicide application corresponding to Paraquat and Pendimethalin was done at doses of 2 and 2.5 L ha-1 respectively, and completed
by four manual weeding during crop development. Insect pests were controlled by applying Imidacloprid (0.4 L ha-1) and Carbaryl
(0.6 kg ha-1). Three sprinkler irrigations were made to compensate
for the crop water requirement; with the first at 15 days after sowing (DAS), the second before flowering and the third after grain filling. The harvest was performed manually during the phenological status R9 (115 DAS). The promising common bean genotypes as genetic
material were used in this study, of which 6 were genotypes usually offered in the market: EVG-6, EVG-6-103, 473 and INIAP-474 with feature determined whilst EVG-16 and EVG-16-08 of characteristic undetermined, respectively. The genotypes CAL-96, AFR-298, AFR-619, EVG-6 (determined) 03, 08, SER-20, SER-29, SER-31, SER-35, SEQ-1033 and SEQ-1039 (undetermined) were introduced from the International Center for Tropical Agriculture (CIAT, as its Spanish acronym), Cali, Colombia; through a scientific collaboration to evaluate genotypes that may adapt to this part of the coastal zone of Ecuador. The 17 genotypes were evaluated using Randomized Complete Block Design (RCBD) with four replications.
Plant phenological, sanitary and grain yield measurements
Day period for the phenological stage R6 (full bloom) and R9
(flowering maturity) were considered (Hall, 1994). The number of days was recorded from planting to when 50% of plants had one or more open flowers as well as to when 90% plants were completely dry. Web blight resilience was evaluated at reproductive growth stages R6 (full bloom) and R8 (pod filling) on leaflets, according to
CIAT scale (van Schoonhoven and Pastor-Corrales, 1987), where 1 (considered the fewer value into the scale), means there is no diseased leaf and 9 (the higher value into the scale), means that it exists in the 100% of foliar infected area. Furthermore, the variables related to grain yield and its components were estimated after harvesting of plants. Number of pods per plant and number of grains per pod per plant were variables evaluated in ten plants taken at random in each plot as post-harvest; thereafter, the number of pods and grains were quantified as well as their averages. For the variable 1000-seed weight (g), 1000 grains were weighed and expressed in grams, considering the healthiest ones (without presence of insect or disease damage) obtained from each plot. For grain yield (kg ha-1), all grains of each useful plot (two
central rows) were weighed and their value recorded in grams, being homogenous to water content. Finally, these values were transformed to unit kg ha-1 obtaining yield per ha.
Statistical analysis
Bartlett and Shapiro-Wilk tests were conducted to verify the
homoscedasticity (variances) and normality (residues). Two-way ANOVA was used for data analysis, considering two factors: genotypes (17), and replicates (four) correspondingly. For measure comparison between treatments, Scott Knott test (p ≤ 0.05) (Scott and Knott, 1974) was employed. Statistical program ASSISTAT 7.6 beta (Silva and Azevedo, 2016) was used for the first analysis. Moreover, Principal Component (PCA) and Cluster Analyses were carried out individually. XLSTAT (Statistical software and data analysis add-on for Excel) package free version 2015.1 was executed for PCA analysis and graphic representation, whilst, RStudio software free version 3.2.2 was used for the elaboration of graphical representation of the dendrograms by WARD2 method.
RESULTS AND DISCUSSION Phenology cultivars
Statistical differences for the phenological states R6 and R9 were found. The genotype EVG-6 after 29 days reached the phenological stage R6 (full bloom) in less time as early plant, however, the genotypes EVG-6-103, AFR-619 and INIAP-473 obtained averages numerically close to 31, 33 and 31 days respectively, while the tardy lines were SER-03, SER-35, SEQ-1039 and EVG-16-08 completing 43 days correspondingly for each one. The SER-35 and SEQ-1039 genotypes, both with 73 days were considered as the tardiest to reach the stage R9 (physiological maturation), compared to the others (Figure 1). The results obtained for the phenological behavior of the genotypes fluctuated around the values described (Garcés-Fiallos et al., 2011) for the Ecuadorian areas; as these might be related to similar genetic materials used by both studies, and to the behavior of cultivars under similar environmental conditions (Table 1). Evaluation of web blight resilience
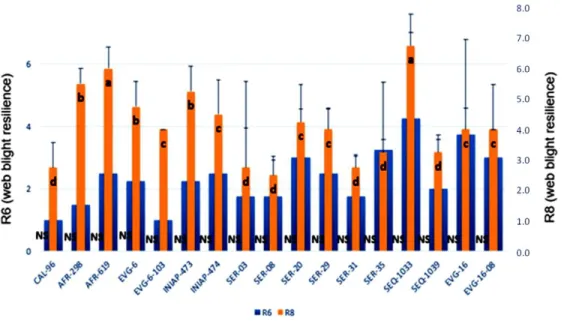
No significant differences at the stage R6 was found for the first evaluation of web blight resilience. Conversely, at the phenological stage, highly significant R8 differences were observed between the genotypes. The genotypes CAL-96, SER-03, SER-08, SER-31, SER-35 and SEQ-1039 had lower severity of disease compared to the other genotypes under study, reaching the follow values: 2.8, 2.8, 2.5, 2.8, and 3.3 respectively, highlighting as those with most resilience to web blight. These results are
Figure 1. Days from sowing to reproductive phenological stages R6 (full bloom) and R9 (physiological
maturation) in 17 common bean genotypes. Lowercase letters indicate significant differences between genotypes in each phenological stage (Scott Knott test (p ≤ 0.05)), n = 150 for each genotype.
Figure 2. Web blight resilience obtained for the genotypes studied. Evaluations done at
phenological stages R6 (full bloom) and R8 (pod filling) in 17 common bean geno-types. Lowercase
letters indicate significant differences between genotypes at phenological stage R8. Not
significance differences were found at phenological stage R6 (Scott Knott test (p ≤ 0.05)), n = 150
for each genotype.
opposed to the previous study (Garcés-Fiallos et al., 2013), who found a highest severity of the disease for the genotypes SER-03, SER-08, SER-31. These results might be related to the low fungal incidences during crop establishment time, as sowing was performed on leaving the rainy season, with an average 56.22% of water precipitations (mm) during crop cycle, thus, climatic
conditions were not optimal for a high severity of web blight disease (Figure 2). By contrast, the genotypes SEQ-1033 and AFR-619 had the highest web blight severity with an average of 6.8 and 6.0 each one (Figure 2). Genotypes can have different levels of resilience to the disease, nevertheless, tolerance and resistance to web blight disease will also depend on the
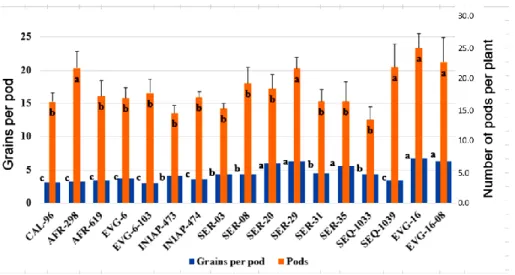
agro-Figure 3. Grains per pod and number of pods per plant in 17 common bean genotypes.
Lowercase letters indicate significant differences between genotypes (Scott Knott test (p ≤ 0.05)), n = 150 for each genotype.
Figure 4. 1000-seed weight (g) and grain yield of seventeen common bean genotypes.
Lowercase letters indicate significant differences between genotypes in each production (Scott Knott test (p ≤ 0.05)). Error bars represent the mean standard deviation, n = 150 for each genotype.
ecological adaptation of each material to the environmental conditions where they are growing (Alves et al., 2009).
Yield and its components
The genotypes including AFR-298, SER-29, SEQ-1039, EVG-16 and EVG-16-08 achieved highest number of pods per plant, in comparison with the other genotypes, obtaining 21.8, 21.7, 22, 25.1 and 23 pods per plant respectively. Equally, the uppermost number of grains per pod was reported for the genotypes SER-20, SER-29,
SER-35, EVG-16, EVG-16-18 compared with the others, and with averages 6.0, 6.0, 6.0, 7.0 and 6.0 grains per pod correspondingly. Both variables showed statistical differences (Figure 3).
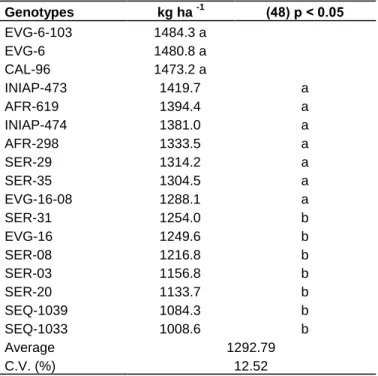
Concerning the variable 1000-seed weight (g), significant differences were reported, highlighting the genotypes EVG-6, CAL-96, INIAP-473 and EVG-6-103 with the averages 571.3, 580.8, 521.3 and 533.3 (g), respectively (Figure 4). Likewise, for grain yield, statistical significant differences were found, sticking out the genotypes CAL-96, AFR-298, AFR-619, EVG-6, EVG-6-103, INIAP-473, INIAP-474, SER-29, SER-35, EVG-16-08 which gained the higher yields with the (individual)
Table 2. Yield per ha of the 17 genotypes. Genotypes kg ha -1 (48) p < 0.05 EVG-6-103 1484.3 a EVG-6 1480.8 a CAL-96 1473.2 a INIAP-473 1419.7 a AFR-619 1394.4 a INIAP-474 1381.0 a AFR-298 1333.5 a SER-29 1314.2 a SER-35 1304.5 a EVG-16-08 1288.1 a SER-31 1254.0 b EVG-16 1249.6 b SER-08 1216.8 b SER-03 1156.8 b SER-20 1133.7 b SEQ-1039 1084.3 b SEQ-1033 1008.6 b Average 1292.79 C.V. (%) 12.52
Different letters in column shows significant difference at 5% probability, n = 150 for each genotype. According to the analysis for 48 freedom degree F = 3.038, with a likelihood to 5% = 1.859.
averages of 1473.2, 1335.5, 1394.4, 1480.8, 1484.3, 1419.7, 1381.0, 1314.2, 1304.5, and 1288.1 kg ha-1 respectively and compared to the other genotypes (Figure 4).
Several differences were obtained in other investigations for each one of the productive variables under study in the current research. Regarding the number of pods harvested per plant, our results were opposed to the findings reported by other authors. Infante et al. (2003) obtained averages from 26.67 to 38.38 and Santos et al. (2009) from 7.56 to 16.40 pods per plant correspondingly. The same happened with the variable grain per pod per plant, where the averages reported with significant differences, as shown by Infante et al. (2003) who reported averages from 8.83 to 9.95 and Barrios-Gómez et al. (2010) presented the values fluctuating from 3.1 and 4.4 grains per pod per plant.
Finally, relating to yield per hectare, significant differences were found, for the genotypes EVG-6-103, EVG-6, CAL-96, INIAP-473, 619, INIAP-474, AFR-298, SER-29, SER-35, EVG-16-08 which obtained a higher yield average (Table 2).
Results reported in this research for the variable yield ha-1 differ from that reported by other authors as González Torres et al. (2008) who found highest yield with averages between 1138 to 2550 kg ha-1 during irrigation season, whilst in optimal temporal season obtained an increasing of the 17% in the yield for almost
all the genotypes studied, compared with the irrigation season. These results also contrasted what was described by Santos et al. (2009) with averages from 393 to 1230 kg ha-1; and Godoy-Montiel et al. (2011) from 435.3 to 462 kg ha-1; both reporting fewer yields in their studies. Alteration probably could have been caused by the genetic and adaptive differences of the germplasm used in each one of the studies.
Set of genotypes grouped by productive and phenological variables
Principal components analysis (PCA)
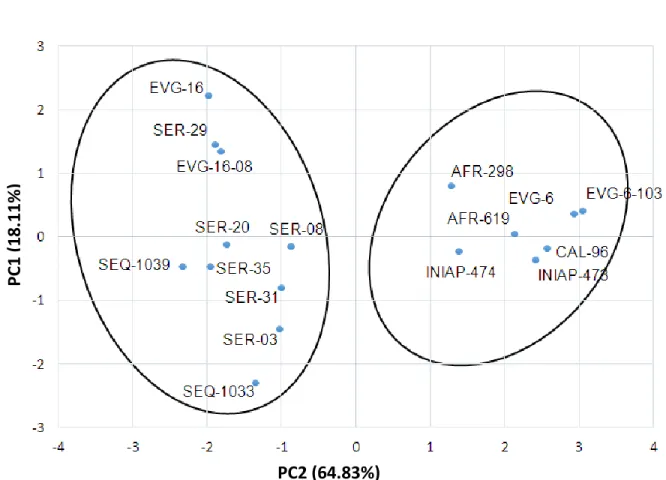
Six productive and phenological variables (R6, R9, Pods per plant, Grains per pod, 1000 seed-weight and yield ha -1), were selected to discriminate similarity among the genotypes. According to PCA, 100% of the variance total was distributed in five principal components. However, two firsts’ components shown in Table 3 present the values that explained 82.94% total of the existing variation jointly, with a contribution of 64.83% for the first component, where the features were grouped as to the majority of PCA. It was followed by the second component explaining the 18.11% of the variation (Table 3). In the first component, the most significant variables were R6 (−0.88), R9 (−0.91), grains per pod (−0.73),
Table 3. Principal component analysis of six productive and
phenological variables for the 17 common bean genotypes.
Variable PC1 PC2
R6 − 0.88 − 0.17
R9 − 0.91 − 0.12
Pods per plant − 0.40 0.83
Grains per pod − 0.73 0.42
1000 Seed-weight 0.96 0.04
Yield/ ha 0.81 0.42
Variability explained (%) 64.83 18.11
Figure 5. Two set of genotypes grouped by six productive and phenological variables for the 17 common bean
genotypes.
1000-seed weight (0.96) and yield per hectare (0.81), correspondingly. Therefore, according to these outcomes, it seems that the genotypes which precociously reached the phenological stage R6 arrived in less time to the stage R9 and obtaining a smaller number of grains per pod, nonetheless, these obtained a greater weight of 1000 seeds and yield ha-1. Subsequently, for the second component, the most outstanding variable was pod per plant; despite that grain per pod and yield ha -1 obtained a medium representation (Table 3). In addition, Figure 5 shows the distribution of the points, corresponding to the 17 genotypes. The graph allows to observe a wide
distribution of the genotypes in the plane and demarcated by the axes assigned to the components 1 and 2, highlighting two groups well-defined and probably segregated by a specific genetic character, related to the type of growing feature (determined and undetermined). To the left of the plane, the first group is observed including the genotypes EVG-16, SER-29, EVG-16-08, SER-20, SER-08, SEQ-1039, SER-35, SER-31, SER-03 and SEQ-1033 and the other one (second) is located to the right of the plane including AFR-298, EVG-6, EVG-6-103, AFR-619, CAL-96, INIAP-474 and INIAP-473. All these differences might be explained by a genetic basis.
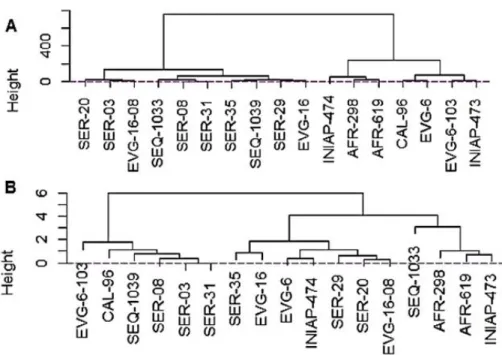
Figure 6. Dendrogram of similitude of 17 common bean genotypes. (A) Productive and
phenological variables. (B) Web blight resistance were subject to analyses.
The authors have demonstrated, that a high correlation between phenotypic and genotypic variability (Machado et al., 2017) exists. Ultimately, the relative regularity of the genotypes in the plane allows us to accept that for this experiment, we used an important and representative sample amount of the available genetic resources of common beans in Ecuador, and the others introduced from Colombia.
Cluster analysis
Dendrogram were obtained using the matrix of Euclidean distances by means of the method distance average of WARD2. The noted variability shown between the genotypes (Figure 5) and the variables used for dividing them separate them in two subsets in each cluster (Figure 6A and B). All the genotypes belonging to the first subset joined according to the common features, which were different for the genotypes of the other subset (second).
Regarding cluster A the variables used to shape the two subsets were the productive and phenological variables. It implies that the subset number one (from left to right) was shaped by 10 genotypes including SER-20, 03, EVG-16-08, SEQ-1033, 08, 31, SER-35, SEQ-1039, SER-29 and EVG-16. These genotypes showed the lower averages for phenological and reproductive variables, whilst the second subset (from right to left) including the 7 genotypes INIAP-474, AFR-298, AFR-619, CAL-96, EVG-6, EVG-6-103, INIAP-473 presented higher averages in almost all phenological and
productive variables (Figure 6A).
On the other hand, by the same procedure, for the elaboration of the dendrogram B, the variables related to the resilience against web blight R6 (full bloom) and R8 (pod filling) were considered. Two subsets were created. For the first subset (from left to right), presented by 6 genotypes EVG-6-103, CAL-96, SEQ-1039, SER-08, SER-03 and SER-31, the less attacked plants by the disease during the two resilience evaluations (R6 and R8) against web blight were seen. The remaining 11 genotypes including SER-35, EVG-16, EVG-6, INIAP-474, SER-29, SER-20, EVG-16-08, SEQ-1033, AFR-298, AFR-619 and INIAP-473 were more susceptible (Figure 6B).
Thus, PCA and dendrogram analysis enabled distinguishing of marked architectural differences among the germplasms under study, separated principally by their growth features in determined and undetermined genotypes respectively. These results agree with those obtained by Garcés-Fiallos et al. (2015), who in a study of 18 lines of common bean in the same zone of Quevedo reported similar outcomes identifying two clear set of genotypes grouped by variables agronomic, productive, and sanitary. It seems that this result might be related to the fact that the genetic material used in the present research saved certain similitude with the genetic material used by Garcés-Fiallos et al. (2015).
Conclusions
study for all the evaluated variables, phenological, web blight resilience as well as the productive variables were seen. Results evidenced that high-quality of plant architecture is a useful strategy for web blight management. A genetic material with certain double features as tolerance to disease and high yield ha-1 was found (three genotypes undetermined) apart from the seven determined genotypes which showed the higher yield characteristics. Our results allowed identifying the materials, which becomes an excellent option for sowing, and can be recommended to the farmers in this region of Ecuador. Nevertheless, it would be imperative to continue testing the genotypes, but in other conditions more auspicious for the disease (rainy season).
CONFLICT OF INTERESTS
The authors have not declared any conflict of interests. ACKNOWLEDGEMENTS
The first author RVT would like to extend his sincere thanks to Professor. Gorky Diaz Coronel for all his support rendered during this study. RVT is also grateful to Dr. Gregorio Vásconez for his advices, critics, and academic recommendations during his formation. Finally, we greatly acknowledge the entire field team of Direction of Research, Science, and Technology (DICYT) of the Technical State University of Quevedo (UTEQ) for their timely help during field study.
REFERENCES
Alves AF, Andrade, MJB, Rodrigues JRM and Vieira NMB (2009). Densidades populacionais para cultivares alternativas de feijoeiro no norte de minas gerais. Ciência E Agrotecnologia. 33(6):1495-1502. Barrios-Gómez EJ, López-Castañeda C, Kohashi-Shibata J,
Acosta-Gallegos JA, Miranda-Colín S and Mayek-Pérez N (2010). Rendimiento de semilla, y sus componentes en frijol flor de mayo en el Centro de México. Agrociencia 44(4):481-489.
Chévez MM, Olaya JC, Villamar-Torres R, Carranza M., Rengifo JM, Romero EJ, Jazayeri SM (2017). Evaluation of the diversity of Scolitids (Coleoptera: Curculionidae) in the forest plantations of the central zone of the Ecuadorian littoral. Revista Ciencia y Tecnología, 10(2):25-32.
Costa-Coelho GR, Café Filho AC and Lobo Jr M (2014). A comparison of web blight epidemics on common bean cultivars with different growth habits. Crop Protect. 55:16-20.
Falconí-Castillo E (2005). Identification of drought resistance in large seeded common bean genotypes. Michigan State University. M.Sc.
thesis. Available at:
http://repositorio.iniap.gob.ec/jspui/bitstream/41000/231/1/iniapsctF18 1i.pdf
Garcés-Fiallos, F.R. (2011). Modelo De Ponto Crítico Para Estimar Danos Causados Pela Mela Na Cultura Do Feijoeiro. Revista Ciencia y Tecnología. 4(1):1-4.
Garcés-Fiallos FR (2013). Cuantificación De Enfermedades En Líneas Promisorias Y Variedades De Fréjol En Quevedo, Ecuador. Biotecnología En El Sector Agropecuario Y Agroindustrial. 11(1):196-207.
Garcés-Fiallos FR, Olmedo-Zamora IM, Garcés-Estrella RE and Díaz-Coronel TG (2015). Potencial agronómico de 18 líneas de fréjol F6 en Ecuador. Idesia (Arica) 33(2):107-118.
Godoy-Lutz G, Kuninaga S, Steadman JR and Powers K (2008). Phylogenetic analysis of Rhizoctonia solani subgroups associated with web blight symptoms on common bean based on ITS-5.8S rDNA. J. General Plant Pathol. 74(1):32-40.
Godoy-Montiel LG, Coronel GD, Vasquenez-Montúfar GH, Defaz-Defaz E and Osorio BG (2011). Evaluación de dos variedades de fréjol durante tres épocas de siembra bajo sistema de cultivo asociado con maíz. Revista Ciencia y Tecnología 4(1):5-11.
González Torres G, Hernández M, Manuel F, Covarrubias Prieto J, Morán Vázquez N, Gallegos A, Alberto J (2008). Rendimiento y calidad de semilla de frijol en dos épocas de siembra en la región del Bajío. Agricultura Técnica En México 34(4):421-430.
Hall R (1994). Compendium of bean diseases. 2nd. ed. St. Paul-APS. P 73.
Infante N, Madriz P and González T (2003). Fases de desarrollo y componentes del rendimiento de tres cultivares de fríjol mungo (Vigna radiata (L) Wilczek) en Maracay, estado Aragua, Venezuela. Revista de La Facultad de Agronomía 20(4):417-429.
Machado BQV, Nogueira APO, Hamawaki OT, Rezende GF, Jorge GL, Silveira IC, Hamawaki CDL (2017). Phenotypic and genotypic correlations between soybean agronomic traits and path analysis. Genet. Mol. Res. GMR 16(2).
Muñoz JC, Miranda EC, Burgos JCV, Ríos P, Martínez VC, Llisto JM, Villamar-Torres R. (2014). Efectos del uso de contenedor profundo en quercus suber. Resultados preliminares de un proyecto de transferencia de tecnología (Sierra Calderona, España). Revista Amazónica Ciencia y Tecnología 3(2):140-160.
Petry N, Boy E, Wirth JP and Hurrell RF (2015). Review: The potential of the common bean (Phaseolus vulgaris) as a vehicle for iron biofortification. Nutrients 7(2):1144-1173.
Rodríguez E, Lorenzo E, Acosta M, González F, Mora B and Godoy G (2015). Manejo de la mustia hilachosa (Thanatephorus cucumeris (Frank)) en el cultivo del frijol comun (Phaseolus vulgaris L). Agronomía Mesoamericana 10(1):99-108.
Rondon MA, Lehmann J, Ramírez J and Hurtado M (2007). Biological nitrogen fixation by common beans (Phaseolus vulgaris L.) increases with bio-char additions. Biol. Fertil. Soils 43(6):699‑708.
Santos JF, Grangeiro JIT, Brito CH and Santos MCCA (2009). Produção e componentes produtivos de variedades de feijão-caupi na microregião Cariri Paraibano. Engenharia Ambiental - Espírito Santo do Pinhal 6(1):214-222.
Scott AJ and Knott M (1974). A Cluster Analysis Method for Grouping Means in the Analysis of Variance. Intern. Biometric Soc. 30(3):507-512.
Silva FAS and Azevedo CAV (2016). Comparison of means of agricultural experimentation data through different tests using the software Assistat. Afr. J. Agric. Res. 11(37):3527-3531.
Torres-Navarrete E, Quisphe Caiza D, Sánchez Laíño A, Reyes Bermeo M, González Osorio B, Torres Navarrete A, Cedeño Briones A, Haro Chong A (2013). Characterization of Production of Bean in Ecuador Cotopaxi Province: Case Commune Panyatug. Revista Ciencia y Tecnología 6(1):23-31.
Villamar-Torres R, Liu-Ba GA, Legavre T and Viot C (2016). Los compuestos orgánicos volátiles, defensa natural del algodón
Gossypium hirsutum mejorable gracias a la biotecnología.
CIBB-BA-EO-061. Available at: http://agritrop.cirad.fr/581908/
van Schoonhoven A and Pastor-Corrales MA (1984). Standard System for the Evaluation of Bean Germplasm. Centro Internacional de Agricultura Tropical, CIAT. P 53.