Université du Québec
Institut National de la Recherche Scientifique Centre Énergie, Matériaux et Télécomunications
Palladium-Copper-Gold Alloys for the Separation of
Hydrogen Gas
by
Bruno Manuel Honrado Guerreiro, M.Sc.
A thesis submitted for the achievement of the
degree of Philosophiae doctor (Ph.D.) in Energy and Materials Science December 2015
Jury Members
© All rights reserved – Bruno Guerreiro, 2015
President of the jury: Prof. Andreas Ruediger (INRS-EMT) Internal Examiner: Prof. Lionel Roué (INRS-EMT) External Examiner: Prof. Pierre Bénard (UQTR)
External Examiner: Prof. Sasha Omanovic (McGill University) Director of Research: Prof. Daniel Guay (INRS-EMT)
I
Abstract
The industrial applications of hydrogen gas have made this simple diatomic molecule an important worldwide commodity in the chemical, oil and even food sectors. Moreover, hydrogen gas is a promising energy carrier that aims the delivery of clean energy, bypassing the environmental problems created by carbon-based fuels. Hydrogen production is, however, still reliant on steam reforming of natural gas and coal gasification, despite the innumerous alternatives available. In order to introduce hydrogen in the energy market, hydrogen production costs need to be reduced, and more specifically, hydrogen purification needs to be simplified. In this regard, the use of dense palladium-based membranes for hydrogen purification are especially attractive, but their wide industrial application is impaired mostly by the high cost of palladium and by hydrogen sulfide poisoning. In the current work, the potential use of palladium-copper-gold alloys as membranes for the separation of hydrogen gas was tested.
PdCuAu alloys were first prepared by pulsed electrochemical co-deposition on a titanium substrate from Pd(NO3)2, Cu(NO3)2 and Au(OH)3 in HNO3 0.35 M, over a wide composition range ([Pd] = 14-74 at.%, [Cu] = 2-82 at.%, [Au] = 0-66 at.%). All alloys had a single face centered cubic (fcc) phase and were less than 1000 nm thick. The deposits presented different morphologies that were dependent on the palladium content. For example, Pd14.3Cu82.1Au3.6 alloy was composed of spherical structures, while Pd74.3Cu18.4Au7.3 had a more needle-like structure. Phase transition from fcc to the more H2-permeable body-centered cubic (bcc) phase was achieved by a simple heat treatment of 4 hours under Ar at 400ºC. The aforementioned transition was found to be composition dependent, occurring for alloys with 29.5 ≤ Pd ≤ 45.8; 45.3 ≤ Cu ≤ 63.0; and 0.0 ≤ Au ≤ 17.4, with [Pd] + [Cu] + [Au] = 100. The hydrogen solubility of the fcc alloys was measured in NaOH 0.1M by an electrochemical method and was found to be maximum for pure Pd. Replacement of copper with gold resulted in a an increase in solubility for alloys with palladium content between 27 and 54 at.%. At the same composition, the bcc phase showed a substantial reduction in solubility when compared with the fcc phase. For example the hydrogen solubility of the fcc alloy Pd33Cu50Au17 was 10.2%, while that of the corresponding bcc alloy was 0.5%.
II
Magnetron co-sputtering was also used for the production of fcc PdCuAu alloys on titanium substrates. The thickness of the films was below 500 nm. Phase transition from fcc to bcc upon annealing occurred in conditions analogous to the ones observed with the electrodeposited samples. Copper segregated at the surface of the alloy during heat treatment, as evidenced by X-ray photoelectron spectroscopy and cyclic voltammetry. The hydrogen solubility of both fcc and bcc phases was investigated. In the case of the fcc phase, it was found that the hydrogen solubility, as measured by an electrochemical method in NaOH 0.1M, increased with the palladium content, being maximum for pure Pd. In general, annealing of the fcc phase resulted in lower solubility either because there was a change in the crystallographic structure to the bcc phase or because of the larger crystallites formed during heat treatment. Further studies with the bcc samples by electrochemical in situ X-ray diffraction in H2SO4 0.1M revealed that hydrogen solubility increased from 0.5 to 2.1% when palladium content increased from 40.3 to 45.6 at%, while keeping [Au]=3.5 at.%. However, no effect of gold was observed for alloys with approximate palladium concentration, in contrast to what was observed with the electrodeposited samples with fcc phase. The hydrogen solubility of both fcc and bcc phase varied linearly with the palladium content, and the increased observed was similar in both phases (0.286 and 0.295 % per [Pd] at.%, for fcc and bcc phase, respectively). This is an indication that the palladium content is the main factor governing solubility in each phase.
Gas phase testing was performed on membranes prepared from PdCuAu ternary alloys and synthesized by mechanical alloying. Alloys with four different compositions were prepared, all with approximately the same palladium composition, and increased gold content, namely, Pd39Cu61,Pd41Cu56Au3, Pd40Cu43Au7, and Pd39Cu51Au10. NaCl was used as the process control agent at 2 wt%. The as-milled fcc alloys were first heat treated for 5 h under Ar 5% H2 at 400ºC, which promoted in general full transition to the bcc phase, in accordance with their composition. Membrane preparation from the bcc alloys involved a series of steps such as powder pressing into pellets, sintering, cold rolling, heat treatment and polishing. The final thickness of the membranes was between 277 and 327 nm. Hydrogen permeability was then measured at 464ºC between 30 and 60 psig H2 pressure. Under these conditions, hydrogen permeability was found to be composition dependent and was highest for the alloy with composition Pd40Cu43Au7 (2.1×10⁻⁸ mol·m-1·s-1·Pa-0.5) and lowest for the alloy Pd39Cu51Au10 (6.9×10⁻⁹ mol·m-1·s-1·Pa-0.5), while the hydrogen permeability of a reference 250 µm commercial foil was 1.2×10⁻⁸ mol·m-1·s-1·Pa-0.5. The
III
ideal selectivity of the membranes was higher than 130. The PdCuAu ternary alloy membrane with the highest permeability was further tested at different temperatures and in the presence of hydrogen sulfide. Between 358 and 464ºC, the natural logarithm of the permeability followed an Arrhenius-like relationship with 1/T, resulting in an activation energy of 10.0 kJ·mol-1, which was lower that the value for a pure Pd reference membrane (21.9 kJ·mol-1). Ten minutes into the test with H2S, H2 flow decreased to zero, indicating the formation of a hydrogen impermeable layer on the surface. Consequently, gold did not provide any extra resistance to H2S poisoning under the tested conditions. H2 flow resumed with time, however, post-testing SEM analysis revealed that the formation of pores had taken place. XPS analysis confirmed the presence of multiple sulfur-containing species, such as, Na2S, Na2S2O3, Na2SO3, Cu2S, CuS and CuSO4. Sulfur compounds with higher oxidation states were probably formed after H2S testing during storage of the membrane under air.
______________________ ______________________
Bruno Guerreiro Student
Daniel Guay
IV
Acknowledgements
I am especially grateful to my advisor Prof. Daniel Guay. This work would not had been possible without his support, generosity, encouragement and professionalism. But most importantly I am grateful for his enthusiasm not only towards science but also in life, and his exceptional empathy towards the well-being of those around him.
Over the four years that lasted this project, the periodical work meetings helped to enrich it with new ideas, not only from Prof. Daniel Guay but also from all the team involved, namely Prof. Lionel Roué, Julie Gaudet, Manuel Martin, Jules Galipaud and Jacques Tosques. I am also thankful for the teachings (and patience!) of Christophe Chabanier. Furthermore, I would like to thank A. Korinek for his work with the TEM images.
Many people accompanied me at the INRS, with whom I learned and laughed, namely Sébastien Garbarino, Régis Imbeault, Esen Sokullu, Denis Ferachou, Claudie Roy, Nicholas Sacré, Erwan Bertin, Teresa Simão, and many others.
These four years in Quebéc were made more special with the company of Lucie Côté and Luc Bergeron, who have been like a true family.
And also to my family back in Portugal, my sister, my mother and my father, I am very grateful for their support and love, in every step in life.
Finally, and most importantly, I would like to dedicate this work to the most important person in my life, Maria João; without her everything would be infinitely less complete.
V
Table of Contents
Abstract ... I Acknowledgements ... IV Table of Contents ... V List of Figures ... IX List of Tables ... XVIII1. Introduction...1
1.1. The role of hydrogen in the industrialized world ...1
1.2. Hydrogen production methods ...2
1.2.1. Steam reforming of natural gas and related technologies ...3
1.2.2. Gasification technologies (coal and biomass)...4
1.2.3. Water electrolysis and other water splitting-based methods ...5
1.2.4. Biological hydrogen production ...6
1.3. Hydrogen purification processes ...7
1.3.1. Pressure swing adsorption and cryogenic distillation ...7
1.3.2. Membrane Technology ...7
1.4. Objectives of the work ...9
1.5. Structure of the thesis... 10
1.6. References ... 11
2. Dense palladium based metallic membranes for the separation of hydrogen gas ... 15
2.1. Introduction ... 15
VI
2.3. Hydrogen solubility in palladium ... 24
2.4. Palladium alloys literature review ... 27
2.4.1. PdCu and PdAu binary alloys ... 27
2.4.2. PdCuAu ternary alloys... 35
2.5. Conclusions and perspectives ... 36
2.6. References ... 37
3. Synthesis and characterization techniques ... 46
3.1. Synthesis of PdCuAu ternary alloys ... 46
Pd, Cu, Au metallic targets ... 46
Pd, Cu, Au metallic powders ... 46
3.1.1. Preparation of PdCuAu films by electrodeposition... 47
3.1.2. Preparation of PdCuAu films by magnetron sputter deposition ... 50
3.1.3. Preparation of PdCuAu bulk alloys by mechanical alloying ... 52
3.1.4. Preparation of PdCuAu membranes for gas phase measurements ... 53
3.2. Physical-chemical characterization ... 54
3.2.1. X-Ray Diffraction (XRD) ... 54
3.2.2. Scanning Electron Microscopy (SEM) and Energy Dispersive X-ray spectroscopy (EDX) ... 58
3.2.3. X-ray Photoelectron Spectroscopy (XPS) ... 59
3.2.4. Transmission Electron Microscopy (TEM) and EELS ... 60
3.2.5. Electrochemical techniques ... 61
3.2.6. Mass of the deposits prepared by electro- or sputter deposition ... 63
3.2.7. Gas chromatography (GC) ... 64
VII
3.3.1. Electrochemical method for the measurement of hydrogen solubility... 65
3.3.2. Electrochemical in situ X-ray diffraction analysis for the measurement of hydrogen solubility (E in situ XRD) ... 66
3.3.3. Gas phase method for the measurement of hydrogen permeability ... 70
3.4. References ... 74
4. Hydrogen solubility in PdCuAu alloy thin films prepared by electrodeposition ... 80
4.1. Synthesis and characterization ... 80
4.1.1. Composition analysis by EDX ... 80
4.1.2. XRD characterization ... 82
4.1.3. Morphology analysis by SEM... 87
4.1.4. Characterization of annealed samples ... 90
4.2. Hydrogen solubility measurements ... 94
4.3. Conclusion ... 101
4.4. References ... 102
5. Hydrogen solubility in PdCuAu alloy thin films prepared by sputter deposition ... 105
5.1. Characterization of the as-deposited samples ... 105
5.2. Characterization of the annealed samples ... 111
5.2.1. XRD analysis ... 111
5.2.2. CV analysis ... 116
5.2.3. XPS and EDX analyses ... 119
5.2.4. Conclusion ... 125
5.3. Hydrogen solubility measurements ... 128
5.3.1. Electrochemical measurements in NaOH 0.1M ... 128
VIII
5.4. Conclusions ... 135
5.5. References ... 135
6. Hydrogen permeability of PdCuAu membranes prepared from mechanical alloyed powders ... 138
6.1. Synthesis and characterization of PdCuAu alloys ... 138
6.2. Membrane preparation from ball milled powders and characterization ... 143
6.2.1. Preparation method... 143
6.2.2. EDX/SEM analysis... 144
6.2.3. XRD analysis ... 147
6.2.4. Conclusions ... 153
6.3. Permeability measurements ... 153
6.3.1. Single gas experiments ... 153
6.3.2. H2 permeability in the presence of H2S ... 169
6.4. Conclusions ... 185
6.5. References ... 186
7. Conclusions and Future work ... 192
7.1. Conclusions ... 192
7.2. Future Work ... 193
7.3. References ... 194
IX
List of Figures
Figure 2. 1 – Schematic illustration of the mechanism of hydrogen permeation through a porous
membrane (denoted PM, on the left) and a dense metallic membrane (right). The latter is referred to as the solution-diffusion mechanism and is composed of 5 steps: I – H2 adsorption; II – H2 dissociation into atomic hydrogen; III – diffusion; IV – atomic H recombination; and V) H2 desorption. ... 16
Figure 2. 2 – Boundary conditions used in the integration of Fick’s law of diffusion. The
concentration gradient within the membrane is considered linear... 18
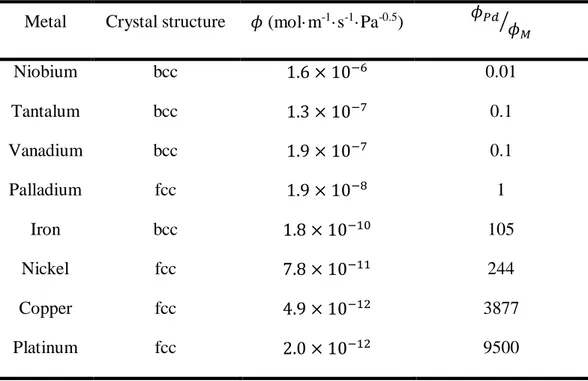
Figure 2. 3 – Permeability vs. reciprocal temperature for bcc (Nb, V, Ta and Fe) and fcc (Pd, Ni,
Cu and Pt) metals. The values were calculated from the data compiled by S.A. Steward [11]. ... 23
Figure 2. 4 – Pressure-composition-temperature phase diagram of the palladium-hydrogen system
(adapted from [13, 15, 16]) ... 25
Figure 2. 5 – Hydrogen solubility given by H/M ratios for PdCu [27] and PdAu [31] alloys. All
measurements are made at 25°C and atmospheric pressure in H2-stirred aqueous solutions. ... 28
Figure 2. 6 – Hydrogen permeability for PdCu and PdAu at 75 psig upstream pure hydrogen
pressure as a function of the palladium content of the alloy. The measurements were made at 350°C [5]. ... 29
Figure 2. 7 – Variation of the permeability ratio in function of the reaction time at 350°C and at
75 psig H2 with 4 ppm H2S; 25.4 µm thick foils were used. Time zero (t=0) is the time immediately after introducing the H2S mixture into the system. ... 30
Figure 3. 1 – Unassembled electrodeposition cell (left) and fully functional cell (right, adapted
from[12]). ... 49
Figure 3. 2 – Flow diagram representing the preparation of PdCuAu membranes from ball milled
X
Figure 3. 3 – Variation of the potential with time (A) and variation of the current with the potential
(B). ... 62
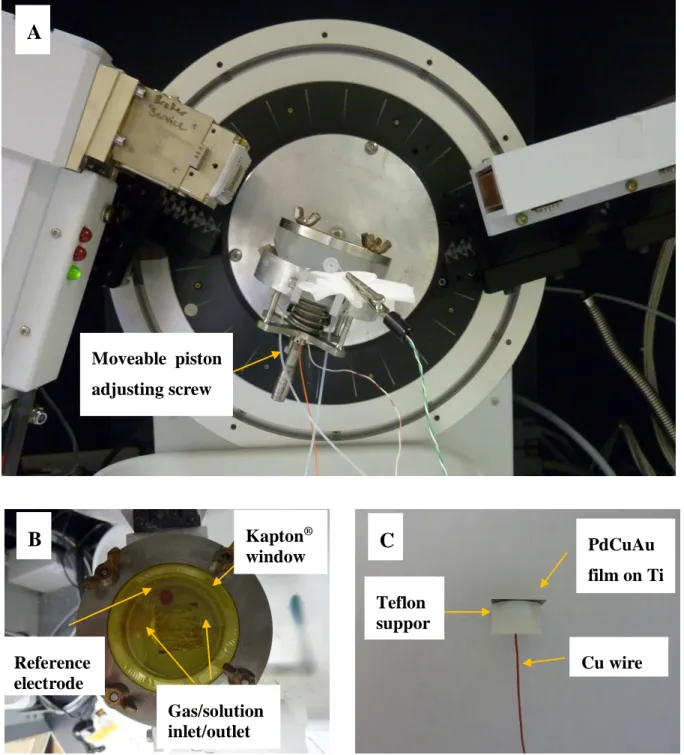
Figure 3. 4 – Experimental set-up for E in situ XRD A – general view, B – top view of cell; C –
working electrode. ... 68
Figure 3. 5 – Schematic representation of the experimental setup used for hydrogen permeability
measurement. The retentate and the permeate sides of the permeation chamber are represented, as well as the cylinder with the gas mixture, the pressure gauges (P) and mass flow meters (MF). The arrows indicate the direction of gas flow. ... 71
Figure 3. 6 – Gas panel evidencing the mass flow meters (yellow dotted square on the right) and
the pressure gauges (white dotted squares). ... 72
Figure 3. 7 – Furnace (A) and permeation chamber unassembled (B) and assembled (C). The disk
at the center of panel B is the membrane (1.1 cm diameter). On each side of the membrane, the stainless steel gaskets that were used can be seen. ... 73
Figure 4. 1 – Variation of the relative composition of the film vs the relative composition of the
bath: in (A) Pd, (B) Cu and (C) Au. The composition of the films was determined by EDX. ... 81
Figure 4. 2 – XRD patterns of CuPdAu ternary alloy thin films prepared by pulsed
electrodeposition on Ti substrates. Six different compositions are shown and are organized from the highest (top curve) to the lowest Au content (bottom curve). The composition of the alloys are (A) Pd50.4Cu9.1Au40.6, (B) Pd43.5Cu22.5Au31, (C) Pd47.9Cu25.8Au26.3, (D) Pd63.3Cu20.2Au16.5, (E) Pd38.2Cu57.1Au4.7, and (F) Pd31.2Cu67.8Au1. The peak position of the pure elements is shown at the bottom for reference. ... 82
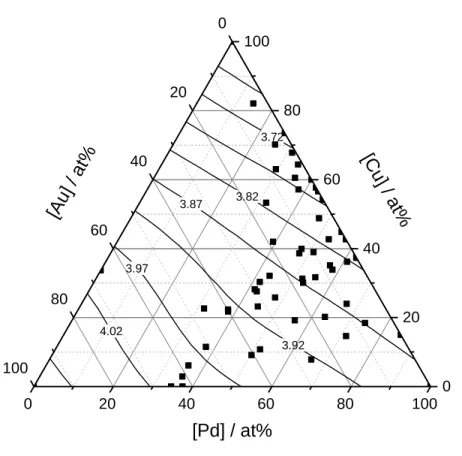
Figure 4. 3 – Ternary contour plot showing the variation of the experimentally determined lattice
parameter (maximum standard error of 0.01Å) with the film composition. ... 84
Figure 4. 4 – Variation of the experimentally measured lattice parameter with respect to the lattice
parameter expected from the composition of the film assuming that Vegard’s law holds true. The Gaussian shaped curve that is superimposed on the one-to-one straight line is centered at 3.82 Å and has a half width at half maximum of 0.10 Å. ... 85
XI
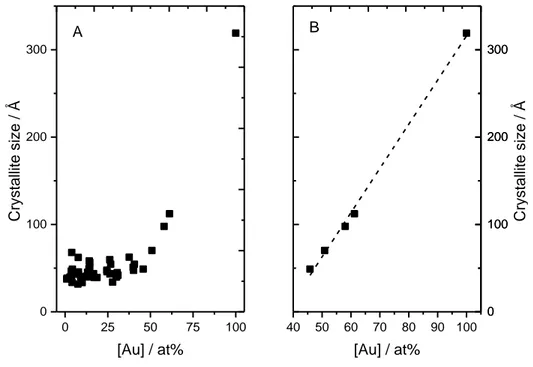
Figure 4. 5 – Crystallite size as a function of gold composition for PdCuAu alloys over the entire
composition range (A,) and for gold concentrations above 45 at% (B,). ... 87
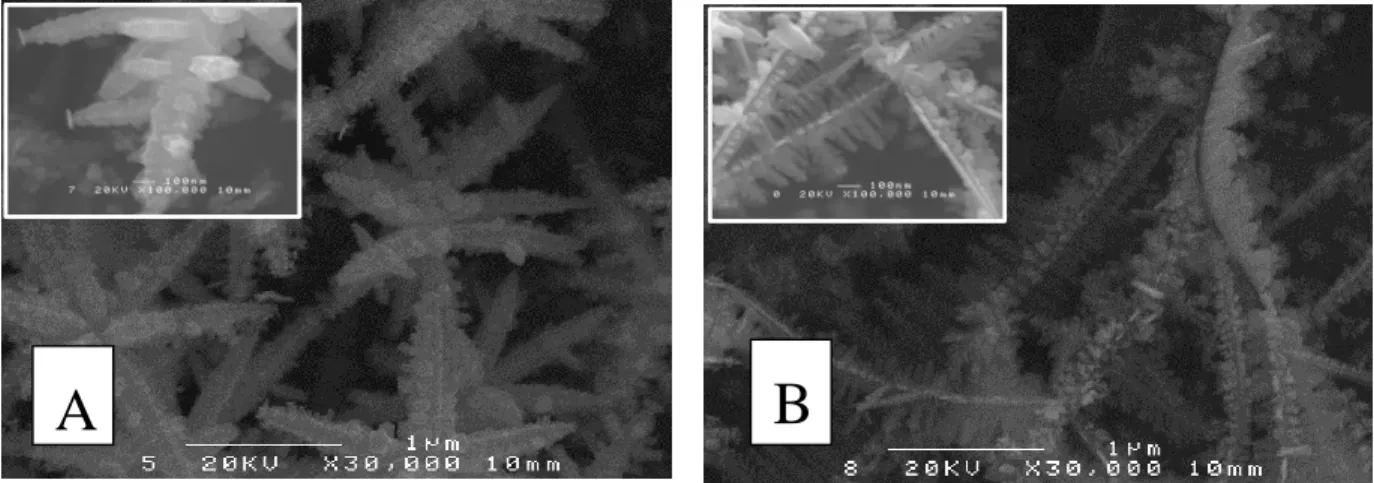
Figure 4. 6 – SEM micrographs of PdCuAu thin films that are arranged in order of increasingly
higher Pd content. In (A) Pd14.3Cu82.1Au3.6, (B) Pd38.2Cu57.1Au4.7, (C) Pd56.2Cu19.2Au24.6, (D) Pd66.1Cu7.8Au26.2, (E) Pd74.3Cu18.4Au7.3, and (F) Pd100Cu0.0Au0.0. ... 88
Figure 4. 7 – High magnification micrographs (30,000 times and 100,000 times in the insets) of a
pure palladium film electrodeposited on a titanium substrate. ... 89
Figure 4. 8 – Comparison of XRD patterns of film with composition Pd35.6Cu60.5Au3.9 (A) before (fcc phase) and (B) after (bcc phase) heat treatment at 400C. ... 90
Figure 4. 9 – Ternary contour plot showing the variation of the experimentally determined lattice
parameter for the bcc phase region with the film composition. The white squares are the EDX compositions of the samples used to construct this plot. ... 91
Figure 4. 10 – Ternary diagram showing final crystallographic phases after 4 hour-heat treatment
at 400ºC and under Ar. EDX compositions are used. FCC – face-centered cubic; BCC – body-centered cubic; TET – tetragonal; CUB – simple cubic... 92
Figure 4. 11 – SEM micrographs of Pd38.8Cu56.2Au5.0 thin film (A) before (fcc phase) and (B) after heat-treatment at 400 °C (bcc phase). ... 93
Figure 4. 12 – Variation of the reduction and oxidation times: 2, 3, 5 and 7 minutes. Each time
was applied twice. ... 95
Figure 4. 13 – Variation of the hydrogen solubility with the applied potential for PdCuAu alloys
at different compositions. All measurements were performed in NaOH 0.1M. ... 96
Figure 4. 14 – Variation of the hydrogen solubility of PdCuAu alloys with the palladium content.
All films are made of a fcc phase with a lattice parameter (3.885 ± 0.005) Å. The data taken from reference [22] is also shown for comparison. The copper and gold contents are shown in at.% in brackets. ... 97
Figure 4. 15 – Effect of copper and gold on the hydrogen solubility of PdCuAu alloys at constant
XII
Figure 4. 16 – Variation of the hydrogen solubility with the applied potential for PdCuAu alloy in
the fcc and in the bcc phase. All measurements were performed in NaOH 0.1M. ... 100
Figure 5. 1 – EDX film composition as a function of the power operating on the targets. On panel
A, the film composition is shown as a function of the power on the Cu target. The power of the palladium target was either 120 or 340 W, while that on the gold target was 80 W. On panel B, the film composition is shown as a function of the power on the Pd target. The power on the Cu and Au targets was 500 and 80 W, respectively... 106
Figure 5. 2 – Diffractograms of representative samples showing that an alloy was formed and that
peak shift occurs with changes in composition. The palladium content decreases from top to bottom and the composition of the samples is: (A) – Pd87.2Cu8.2Au4.6; (B) – Pd76.2Cu19.7Au4.1; (C) – Pd67.3Cu29.1Au3.6; (D) – Pd59.1Cu37.6Au3.3; (E) – Pd43.9Cu52.4Au3.7. ... 107
Figure 5. 3 – Comparison between the experimental lattice parameter and the lattice parameter
calculated considering Vegard’s law. ... 108
Figure 5. 4 – Elemental maps of Pd M45-edge, Cu L23-edge and Au M45-edge obtained with
EELS at a vertical cross section of Pd50.8Cu46.0Au3.2. The relative signals are shown here. ... 109
Figure 5. 5 – XRD diffractograms of alloy with composition Pd32.2Cu63.3Au4.5 taken before (A) and after (B) annealing at 400C for 4h under Ar. The as-deposited sample shows the characteristic fcc phase peaks while a single bcc phase is observed after annealing. ... 111
Figure 5. 6 – In (A), XRD patterns of fcc Pd67.3Cu29.1Au3.7 after annealing at 400C during different times (0, 4, 8 and 48 hours). Only the region between 2 = 66 and 73 is shown for clarity. In (B), variation of the full width at half maximum (FWHM) and peak position as a function of the annealing time. ... 112
Figure 5. 7 – Williamson-Hall plots for the as-deposited ternary alloy with composition
Pd67.3Cu29.1Au3.7. Left – uniform microstrain in all crystallographic directions was considered (Cauchy-Cauchy deconvolution; equation 3.7); center – anisotropic microstrain was considered (Cauchy-Cauchy deconvolution; equation 3.9); right – anisotropic microstrain was considered with Gauss-Cauchy deconvolution (equation 5.2). ... 114
XIII
Figure 5. 8 – Lattice parameter, crystallite size and uniform stress calculated for samples annealed
0, 4 and 8 hours. The crystallite size and uniform stress were calculated using equation 5.2. ... 115
Figure 5. 9 – Cyclic voltammograms (50 mV·s-1) taken before (black line; 2nd cycle) and after (red dashed line; 10th cycle) measuring the hydrogen solubility in NaOH 0.1M. The samples shown were all prepared under the same experimental conditions, except the annealing time at 400ºC under Ar, which varied from 0, 4, 8 or 48 h. All samples have fcc crystallographic structure and have the same starting composition Pd67.3Cu29.1Au3.7. ... 116
Figure 5. 10 – Cyclic voltammograms (50 mV·s-1) taken before (black line) and after (red dashed line) measuring the hydrogen solubility in NaOH 0.1M for samples with composition Pd43.9Cu52.4Au3.7. Results for both pristine (0 h) and annealed (4 h) samples are shown. Samples have fcc and bcc structure before and after annealing, respectively. ... 118
Figure 5. 11 – Variation of the Pd and Cu content as a function of heat treatment. Composition
was determined by EDX and XPS. Two different ternary PdCuAu alloys were investigated alloy 1 (Pd50.8Cu46.0Au3.2), on the left, with no heat treatment; and alloy 2 (Pd67.3Cu29.1Au3.6), on the right, annealed at 400 °C during 48 hours. ... 119
Figure 5. 12 – Copper 2p3/2 high resolution spectra for alloy 1 (Pd50.8Cu46.0Au3.2; panels 1,2 and 3), alloy 2 (Pd67.3Cu29.1Au3.6 panels 4 and 5), and copper film on silicon substrate (panel 6). Alloy 1 was not heat treated while alloy 2 was annealed for 48 hours at 400ºC under Ar. ... 121
Figure 5. 13 – Comparison between the copper content measured by EDX before and after
hydrogen solubility measurements in NaOH 0.1M (for the fcc phase) or 0.1M H2SO4 (bcc phase).The dashed line represents the equality, when the final and initial concentrations are the same. ... 125
Figure 5. 14 – Variation of the lattice parameter of the bcc phase with respect to the palladium
content taken after the hydrogen solubility measurements. A comparison is performed between the experimental values for PdCuAu alloys and literature values for PdCu [16]. Dashed and dotted lines represent the best linear regression to each set of data (PdCuAu3.5 and PdCu alloys, respectively). ... 126
XIV
Figure 5. 15 – Hydrogen solubility of the fcc phase in function of the (A) lattice parameter and
(B) palladium content. The results are for both as-deposited samples and for samples annealed at 400ºC during different times. ... 129
Figure 5. 16 – E in situ XRD for bcc alloy with composition Pd40.4Cu56.1Au3.5 showing the diffractograms recorded before applying any potential (OCP), during charging (-600 mV) and during discharging (+300 mV). Two different 2 regions (37-45 and 75-81°) are shown. ... 131
Figure 5. 17 – Peak fitting of Ti (112) peak and (221) bcc alloy peak collected at open circuit
potential before applying any potential. The composition of the alloy is Pd40.4Cu56.1Au3.5. ... 132
Figure 5. 18 – Hydrogen solubility of the bcc phase in function of the lattice parameter (A) and
the palladium content (B). Gold content of the samples is given aside the data points in at.%. . 133
Figure 5. 19 – Comparison between the hydrogen solubility of the bcc phase with fcc phase in
function of the palladium content. Dashed lines represent the best linear fit for each set of data. Values aside the data points represent the gold content of the alloy. ... 134
Figure 6. 1 – Micrographs of A) Pd40Cu53Au7 (synthesis 3 in Table 6.1) and B) pure Pd, both at 600 times magnification, after 18 hours of ball milling. Grains of NaCl are clearly visible in micrograph B. ... 139
Figure 6. 2 – Diffractograms of the as-milled powders (panel 1) and after 5-hour heat treatment
(panel 2) arranged by increasing gold content from 0% (A) to 10% (D) (A – Pd39Cu61; B – Pd41Cu56Au3; C – Pd40Cu43Au7; D – Pd39Cu51Au10). ... 140
Figure 6. 3 – Experimental lattice parameter as a function of gold content for as-milled powders
(A) and annealed samples (B). ... 141
Figure 6. 4 – Comparison between the experimental and Vegard’s lattice parameter for the
mechanically alloyed powders. ... 142
Figure 6. 5 – Method for the production of PdCuAu membranes from mechanically alloyed
XV
Figure 6. 6 – EDX mapping of the membranes’ surface. Each row represents one different
composition (A – Pd40Cu60; B – Pd40Cu57Au3; C – Pd39Cu53Au7; D – Pd40Cu49Au11) and each column represents one element (from left to right, Pd L1, Cu K1 and Au L1). ... 145
Figure 6. 7 – SEM micrographs at 500 times magnification of membranes after the second heat
treatment (step 6 in Fig. 6.5); A – Pd40Cu60; B – Pd40Cu57Au3; C – Pd39Cu53Au7; D – Pd40Cu49Au11. ... 146
Figure 6. 8 – SEM micrograph before (left) and after (center and right) polishing was performed.
Membrane with composition Pd39Cu53Au7 is shown as an example. ... 147
Figure 6. 9 – X-ray diffractogram of Pd40Cu43Au7 powder after the first heat treatment (step 2), and pellet after sintering (step 4), cold rolling (step 5) and after second heat treatment (step 6). The dotted line indicates the average peak center (42.8°) for all samples except the one that underwent cold rolling. The inset shows the diffratogram of the cold rolled sample between 38 and 59º in order to emphasize the presence of the fcc peaks. ... 148
Figure 6. 10 – X-ray diffractogram of Pd40Cu43Au7 powder after ball milling (step 1), and of Pd40Cu43Au7 pellet after cold rolling (step 5) and after second heat treatment (step 6). The latter was acquired in both Bragg-Brentano (curve in magenta) and in grazing incidence (GI) with =5º (curve in green) configurations. The (111) and (200) fcc peaks are visible, as is also the (110) bcc peak. ... 149
Figure 6. 11 – Bragg-Brentano X-ray diffractograms of the membranes after the second heat
treatment (step 6 in diagram of Fig. 6.5) arranged by increasing gold content from 0% ( A) to 10% (D) (A – Pd40Cu60; B – Pd40Cu57Au3; C – Pd39Cu53Au7; D – Pd40Cu49Au11)... 151
Figure 6. 12 – Williamson-Hall analysis (equation 3.13) applied to PdCuAu alloys after ball
milling (step 1) and after the second heat treatment (step 6). Results for the strain energy density (A) and the crystallite size (B) are shown. ... 152
Figure 6. 13 – Micrograph of membrane with composition Pd38.9Cu54.5Au6.6 that failed the He leak test after the H2 permeation experiment. Regions A and B are shown in more detail in the insets. ... 154
Figure 6. 14 – Variation of H2 flow with time at 30, 45 and 60 psig H2 feed pressure and 464ºC. The permeate side was not submitted to any pressure control and no sweeping gas was used.
XVI
Measurements were made with the following membranes: Pd 250 µm commercial foil form Alfa Aesar (A), a Pd pellet prepared from commercial Pd powder (B; 250 µm) and the four PdCuAu alloys prepared, Pd40Cu60Au0 (C; 327 µm), Pd40Cu57Au3 (D; 300 µm), Pd40Cu53Au7 (E; 277 µm); Pd40Cu49Au11 (F; 304 µm). ... 156
Figure 6. 15 – Hydrogen flux in function of the difference of the square root of pressure drop
across the membrane at 464°C. The dotted lines represent the calculated linear regressions. All membranes showed 0.00 ml·min-1 He flow before and after the H2 testing. Measurements were made with the following membranes: Pd 250 µm commercial foil form Alfa Aesar (A), a Pd pellet prepared from commercial Pd powder (B; 250 µm) and the four PdCuAu alloys prepared, Pd40Cu60Au0 (C; 327 µm), Pd40Cu57Au3 (D; 300 µm), Pd40Cu53Au7 (E; 277 µm); Pd40Cu49Au11 (F; 304 µm). ... 158
Figure 6. 16 – Experimentally determined H2 permeability of membranes prepared from the consolidation of PdCuAu mechanically alloyed powders (membranes C to F in Figs. 613 and 6.14 and table 6.1). Literature permeability values for PdCu alloys 25.4 foils µm [11] are also shown, along with indication of the crystallographic phase for the PdCu alloys ( - fcc phase; - bcc phase) [1]. ... 162
Figure 6. 17 – H2 permeability of the PdCuAu ternary alloy membranes at 464ºC in function the gold content. As a reference, results for Pd foil and for a pellet prepared from Pd powder are also shown. ... 164
Figure 6. 18 – Variation of H2 flow with time at 464ºC. The H2 feed pressure was constant at 45 psig for all experiments, except for sample A which was kept at 30, 45 and 60 psig for 2, 0.5 and 0.5 hours, respectively. The permeate side was not submitted to any pressure control and no sweeping gas was used. Measurements were made with the following membranes: Pd 250 µm commercial foil form Alfa Aesar (A), a Pd pellet prepared from commercial Pd powder (B; 250 µm) and the four PdCuAu alloys prepared, Pd40Cu60Au0 (C; 327 µm), Pd40Cu57Au3 (D; 300 µm), Pd40Cu53Au7 (E; 277 µm); Pd40Cu49Au11 (F; 304 µm). ... 165
Figure 6. 19 – Permeability vs. 1/T for Pd 250 µm foil from Alfa Aesar and Pd40Cu53Au7 membrane. The dotted lines represent the best linear regression of the data, considering an Arrhenius-type relationship. ... 166
XVII
Figure 6. 20 – Variation of flow with time when the membranes are exposed to either pure H2 or a mixture of H2 and 941 ppm H2S. Two different membranes were analyzed: Pd 250 µm foil from Alfa Aesar (left panel) and Pd39Cu54Au7 membrane E-2 (right panel). Experiments were performed at 464ºC. ... 169
Figure 6. 21 – Diffractograms of Pd 250 µm foil (panel 1) and membrane E-2 Pd39Cu54Au7 (panel 2) after exposure to H2S. Both retentate (panels A) and permeate (panels B) sides of the membrane were analyzed. ... 173
Figure 6. 22 – Grazing incidence X-ray diffractograms ( = 5º) for membrane E-2 Pd39Cu54Au7, after exposure to H2S, for both retentate and permeate sides. A comparison is made with the pristine sample. ... 174
Figure 6. 23 – SEM micrographs for the Pd 250 µm foil (top) and membrane E-2 Pd39Cu54Au7 (bottom). Both retentate (left) and permeate sides (right) of the membranes are shown. ... 176
Figure 6. 24 – Variation of composition as determined by EDX measurements for membrane
E-2. The data were taken on both surfaces of the membrane and at various locations on the cross section: (1) surface of pristine sample; (2) surface of retentate upon exposure to H2S treatment; (3) surface of permeate upon exposure to H2S; (4) cross section close to retentate side; (5) middle of cross section; (6) cross section close to permeate side. ... 177
Figure 6. 25 – Pd, Cu, Au, Na and S concentration profile of membrane E-2 that was in contact
with H2S 941 ppm gas mixture. Analysis started at the retentate side of the membrane here referenced as 0 nm depth. Depth was estimated using equation 3.15. ... 180
Figure 6. 26 – Cu 2p3/2 high resolution spectra for membrane E-2 after being in contact with H2S 941 ppm. Both sides of the membrane were analyzed and are compared with a pristine sample. Analyzes were performed without (panel 1) and with etching (panel 2). ... 181
Figure 6. 27 – S 2p high resolution spectra for membrane E-2 after being in contact with H2S 941 ppm. Both sides of the membrane were analyzed. Analyzes were performed without (panel 1) and with etching (panel 2). ... 182
XVIII
List of Tables
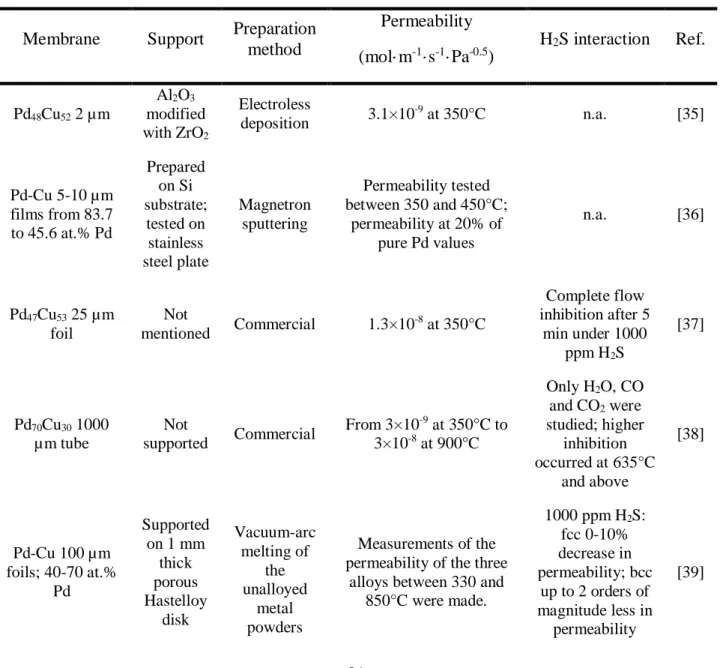
Table 2. 1 – Hydrogen permeability for different metals at 500°C... 21 Table 2. 2 – Literature review of the hydrogen permeability of PdCu and PdAu alloys and the
effect of hydrogen sulfide. ... 31
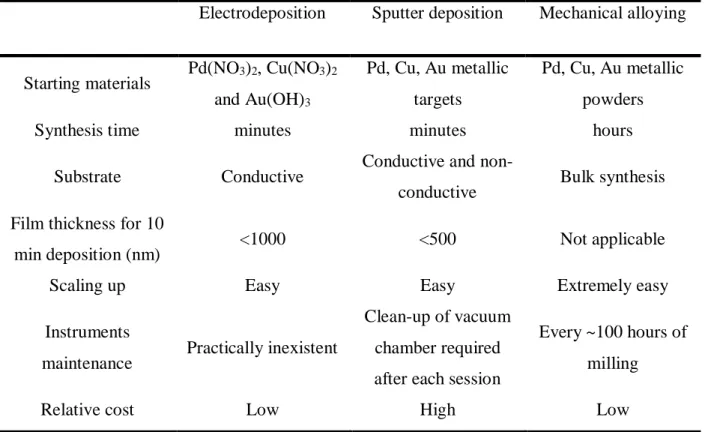
Table 3. 1 – Comparison between the preparation methods used for the synthesis of PdCuAu
alloys. ... 46
Table 3. 2 – Different ball milling conditions used to prepare the PdCuAu alloys. ... 53
Table 5. 1 – Binding energies (B.E.) and amount of reduced surface copper for samples shown in
Fig. 5.12 and literature values for comparison. ... 123
Table 6. 1 – Nominal and EDX compositions for the 4 synthesis performed. ... 138 Table 6. 2 – Membranes’ properties including, composition, thickness, H2 and He permeability at 464°C, and ideal selectivity factors. H2 and He permeability is given in mol·m-1·s-1·Pa-0.5. ... 160
Table 6. 3 – Pre-exponential factor and activation energy for the H2 permeation assuming that an Arrhenius-type relationship between the logarithm of the permeability and 1/T is valid. Both experimental results and literature values are shown. All values are calculated considering that the H2 permeability is a diffusion-limited process. ... 167
Table 6. 4 – Literature results for the effect of H2S in the H2 permeability of Pd and Pd alloys. ... 170
Table 6. 5 – Binding energy and composition of membrane E-2 after being in contact with H2S gas mixture. Analyses were made on the retentate and permeate sides of the membrane with and
XIX
without etching. The results are compared to the pristine sample. (1) refers to the bulk EDX composition of the pristine sample, and reference values are from [42]. ... 178
Table 6. 6 – Published results of the S 2p binding energy for common sulfur compounds with
1
1. Introduction
1.1. The role of hydrogen in the industrialized world
Hydrogen is the most abundant element in the universe. On Earth, at the surface of the globe, is the third most abundant element after oxygen and silicon [1]. Hydrogen is a colorless, tasteless and odorless gas with low solubility in liquid solvents, while being quite unreactive at room temperature. Hydrogen’s chemical and physical properties have shaped its use in the modern society where it is seen as commodity with innumerous applications [2]. The largest application of hydrogen is, by far, in the chemical industry where the Haber-Bosch process for the production of ammonia is the most important. In this process, ammonia is prepared from the reaction of N2 and H2 at high temperatures and pressures (typically 400C and 200 atm) in the presence of iron catalysts. Apart from ammonia, other bulk chemicals are also prepared directly from hydrogen gas. Such is the case of methanol, which is obtained from the reaction of carbon monoxide and hydrogen in the presence of a cobalt catalyst. Hydrogen chloride can also be directly produced by reacting hydrogen with chloride. Smaller scale applications of hydrogen in the chemical industry include the production of metal hydrides and complex metal hydrides. Hydrogen is also present in the food industry where it is used in the nickel-catalyzed hydrogenation of vegetable oils to produce solid fats sold as margarines. Other domains of human activity that use hydrogen include: metallurgy (reduction of oxides to metals such as Mo and W), steelmaking (direct reduction of iron ore), space program (liquid fuel), welding and cutting (oxyhydrogen and atomic hydrogen torches) [1].
The greatest challenge for hydrogen in the future is its use as an energy carrier especially as a fuel in transportation [3, 4]. In fact, cars powered by hydrogen are already available on the market, and more and more powering stations are being built in Japan, Europe and North America. Consuming H2 either in a fuel cell or in an internal combustion engine yields only water. It is the cleanliness of this fuel (zero production of CO2, if H2 production from fossil fuels is combined with CO2 sequestration technologies) that attracts attention of supporters of the called hydrogen economy, as a way to reduce anthropogenic-related CO2 levels in the atmosphere [5]. However,
2
the success of this new venue for hydrogen will be dictated by the cost of its implementation. Bearing this is mind, it is crucial to lower the cost of hydrogen production and the efficiency of the methods used. In fact, 50-80% of the capital investment for the large scale production of H2 is directed for separation/purification operations only [5]. This means that lowering the cost of the purification process will substantially decrease the final cost of the H2 produced. This issue will be further discussed in section 1.3, after presenting different hydrogen production methods.
1.2. Hydrogen production methods
Different feedstocks are available for the production of H2, namely, hydrocarbons (such as methane, the main constituent of natural gas), coal, water and biomass. The production method is chosen accordingly. For example, when producing hydrogen from hydrocarbons, steam reforming, partial oxidation and autothermal reforming methods can be used, while gasification processes are required for coal and biomass. Electrolysis is the method of choice when using water as the starting material. Nonetheless, this flexibility in terms of feedstock is not represented in the industry where the use of petrochemicals is still prevalent. In fact, 78% of the worldwide hydrogen production derives from petrochemicals, of which natural gas corresponds to 48% while petroleum corresponds to the remaining 30%. Coal gasification and water electrolysis account for 18 and 4% of the total hydrogen production, respectively. In the case of the US, 95% of hydrogen is produced from natural gas. Coal gasification is more important in areas where extensive coal deposits are accessible (for example, the US has 250 years reserves of coal [6, 7]), while water electrolysis is usually restricted to locations where electricity is abundant and inexpensive. Hydrogen is also the byproduct of some industrial processes, such as brine electrolysis [1, 8, 9]. The predominance of petrochemicals and coal in the production of hydrogen is justified by their lower prices, and the efficiency and the know-how of the technologies involved. However, when using carbon-based fuels, carbon dioxide, an important greenhouse gas, is concomitantly produced, which contributes to the global warming phenomenon. To mitigate the environmental drawbacks of the use of these fuels, carbon sequestration techniques are required, or other more sustainable hydrogen sources need to be pursued [10]. A brief description of the more relevant methods for hydrogen production follows.
3
1.2.1. Steam reforming of natural gas and related technologies
Steam reforming (SR) is one of the most efficient methods for the production of hydrogen from natural gas [11]. Natural gas is first desulfurized, in order to avoid deactivation of the catalyst. The feedstock gas is then mixed with process steam at 700-1000C and 3-25 bar. Under these conditions, and in the presence of a Ni catalyst, the hydrocarbon is converted to carbon monoxide, hydrogen and carbon dioxide, as shown by equations 1.1 and 1.2:
𝐶𝐻4+ 𝐻2𝑂 → 𝐶𝑂 + 3𝐻2 (∆𝐻0 = 206 𝑘𝐽 ∙ 𝑚𝑜𝑙−1)
𝐶𝐻4 + 2𝐻2𝑂 → 𝐶𝑂2+ 4𝐻2 (∆𝐻0 = 165 𝑘𝐽 ∙ 𝑚𝑜𝑙−1)
The reactions above are endothermic [12] and require an external heat source. This is achieved by burning off some of the methane. The resulting gas mixture (called synthesis gas or syngas) is composed of about 12% carbon monoxide that can react further with steam and produce more hydrogen gas (equation 1.3):
𝐶𝑂 + 𝐻2𝑂 ⇄ 𝐶𝑂2+ 𝐻2 (∆𝐻0 = −41.1 𝑘𝐽 ∙ 𝑚𝑜𝑙−1)
The previous reaction is commonly known as the water gas shift (WGS) reaction. As the reaction is exothermic, higher conversion efficiency to hydrogen is favored at lower temperatures. Commonly, there are two WGS reactors in series downstream of the SR reactor. The first WGS reactor operates at > 350°C with an iron catalyst, while the second one operates at 200°C and uses a copper catalyst (a third WGS reactor may be used that operates at intermediate temperatures, 220-270°C). CO levels go down from 12 (syngas) to 2.5 (first WGS, [13]) and finally 0.2 vol% in the second WGS reactor. Methanation reactions (equation 1.4) can also be used that will result in CO levels lower than 10 ppm, but at the expense of hydrogen gas [1, 12].
𝐶𝑂 + 3𝐻2 ⇄ 𝐶𝐻4+ 𝐻2𝑂 (∆𝐻0 = −206 𝑘𝐽 ∙ 𝑚𝑜𝑙−1)
At this point, hydrogen is mixed with CO, CO2, H2O, and unreacted methane, along with any impurities that were already present in the natural gas, such as H2S. This means that after steam reforming, the hydrogen gas needs to be purified. The different methods available are (Equation 1.3) (Equation 1.2)
(Equation 1.4) (Equation 1.1)
4
discussed in section 1.3. Other hydrocarbons can be used in steam reforming (for instance methanol) and there are also other reforming technologies available, such as partial oxidation and autothermal reforming. The first step of any of these methods is the production of syngas, which can then be treated in the same way as described for the steam reforming method.
1.2.2. Gasification technologies (coal and biomass)
Reforming is not the only process that allows the production of syngas. Gasification is one alternative where a carbon source – coal or biomass – reacts with steam and oxygen at high temperatures. The main difference between the two sources of carbon is that biomass has low thermal efficiency, as a result of the moisture content, which also needs to be vaporized [11]. The following general equation can be written (equation 1.5):
2𝐶 + 𝐻2𝑂 + 𝑂2 → 𝐶𝑂 + 𝐶𝑂2+ 𝐻2
Similarly with what happens with steam reforming, the syngas produced by gasification can be used in WGS reactions in order to maximize the conversion to hydrogen. Currently, all the hydrogen that is produced from coal uses gasification technologies. In fact, gasification of coal is considered a viable alternative to methane steam reforming in parts of the world where the reserves of coal are plentiful. Notwithstanding, biomass is a more versatile and sustainable source of carbon, being perhaps universally available. Common sources of biomass include agriculture crop residues, forest residues, special crops grown specifically for energy use, organic municipal solid waste, and animal wastes [14]. Interestingly, when using biomass, the gasification process may be considered neutral in terms of CO2 production, because the same amount of CO2 will be captured in the next cycle when biomass is grown. As equation 1.5 implies, the hydrogen produced through gasification is not pure and needs to be separated from the CO and CO2 gases. Other impurities may be present, especially when dealing with coal, which need to be removed from the gas stream, such as H2S, COS (carbonyl sulfides), and other trace elements, such as mercury or arsenic.
5
1.2.3. Water electrolysis and other water splitting-based methods
In water electrolysis, water is split into hydrogen and oxygen using electricity. An electrolytic cell is essentially composed by the electrolyte, two electrodes (commonly made of nickel) and a direct current power supply [15]. The reactions occurring in an alkaline system are the following [16]:
4𝐻2𝑂 + 4𝑒− ⟶ 2𝐻2+ 4𝑂𝐻− (𝑐𝑎𝑡ℎ𝑜𝑑𝑒)
4𝑂𝐻− ⟶ 𝑂
2+ 2𝐻2𝑂 + 4𝑒−(𝑎𝑛𝑜𝑑𝑒)
2𝐻2𝑂 ⟶ 𝑂2+ 2𝐻2 (𝑠𝑢𝑚)
The gases produced at the electrodes are primarily pure oxygen (at the anode) and hydrogen (at the cathode), requiring little or no purification, depending on their final application. Other electrolyzers, such as proton exchange membrane electrolyzers and solid oxide electrolysis cells, are being developed that consist essentially of fuel cells operating in reverse. Unfortunately, these are still lacking commercial implementation [11]. In water electrolysis there is no CO2 production, except if the electricity used in the process was generated from burning coal or natural gas. If that is the case, then gasification and steam reforming would be more direct ways to produce hydrogen gas.
The splitting of water for the production of hydrogen is also available by other routes that do not rely on electricity. Most notably, there are thermochemical and photoelectrochemical water splitting methods. In the former method, water decomposition is achieved through the combination of temperature and chemical reactions. There are many possible systems that are described in the literature. One example is given below that demonstrates the complexity of such systems [11, 17]: 2𝐻2𝑂 + 𝑆𝑂2 + 𝐼2+ 4𝑁𝐻3 ⟶ 2𝑁𝐻4𝐼 + (𝑁𝐻4)2𝑆𝑂4 (50°𝐶) 2𝑁𝐻4𝐼 → 2𝑁𝐻3+ 𝐻2+ 𝐼2 (630°𝐶) (𝑁𝐻4)2𝑆𝑂4+ 𝑁𝑎2𝑆𝑂4 → 𝑁𝑎2𝑆2𝑂7+ 𝐻2𝑂 + 2𝑁𝐻3 (400°𝐶) (Equation 1.6a) (Equation 1.6b) (Equation 1.7a) (Equation 1.7b) (Equation 1.7c) (Equation 1.6)
6 𝑁𝑎2𝑆2𝑂7 → 𝑆𝑂3+ 𝑁𝑎2𝑆𝑂4 (550°𝐶) 𝑆𝑂3 → 𝑆𝑂2+1 2𝑂2 (870°𝐶) 𝐻2𝑂 → 𝐻2 + 1 2𝑂2 (𝑂𝑣𝑒𝑟𝑎𝑙𝑙 𝑟𝑒𝑎𝑐𝑡𝑖𝑜𝑛)
Hydrogen is produced in reaction 1.7b and oxygen is produced in reaction 1.7e. Overall, only water is consumed (about 17% conversion) whereas all other chemicals are recovered in the process. The heat required can be supplied by concentrating sunlight onto a reactor or by recycling waste heat from nuclear reactors [18]. Without chemical reagents, the water splitting reaction would occur at temperatures as high as 2500-3000°C and only about 10% of water would be decomposed into oxygen and hydrogen. However, since it is based on a rather complex process, thermochemical water splitting is not a mature technology and can only be achieved at high pressures and in very corrosive conditions. In the end, hydrogen (and oxygen) still need to go through a purification step.
In photoelectrochemical water splitting, also called photoelectrolysis, sunlight is used to decompose water with the help of semiconductors, similar to those used in the generation of electricity by photovoltaics. Although promising, this technology is still far from being commercialized.
1.2.4. Biological hydrogen production
Numerous alternatives are currently being studied that use biological systems for the production of hydrogen. Two different feedstocks are available for biological hydrogen production, namely, water and biomass. In the first case, the processes being developed are based on water splitting by green algae or cyanobacteria, whereas the second process relies on the fermentation of biomass [11]. Most of the research work is focused on the identification and characterization of potential microorganism for the efficient conversion to H2. Genetic modifications of those microorganisms are also being considered to increase the conversion efficiency.
(Equation 1.7d)
(Equation 1.7) (Equation 1.7e)
7
1.3. Hydrogen purification processes
The two processes described below are mostly relevant for hydrogen that has been produced by steam reforming or gasification technologies, these being the two most common methods used in hydrogen production. All the other methods described in section 1.2 are either still in research stage or do not require extensive purification, such as is the case of the water electrolysis method.
1.3.1. Pressure swing adsorption and cryogenic distillation
In pressure swing adsorption (PSA), hydrogen is purified using molecular sieves, such as zeolites, which adsorb CO and CO2 and other impurities at high pressure. With PSA, the final purity of the hydrogen stream is higher than 99.9%. The sieves are regenerated by reducing the pressure and temperature. Part of the purified hydrogen is used in a purging step, which reduces total hydrogen recovery to 70-85% [19]. PSA is the most common used method in gas purification. Cryogenic separation is based on the different condensation points of the gases composing the starting mixture. It is a method mostly used for applications where low purity hydrogen (90-98%) is required. The hydrogen recovery rates are around 95% [19].
Both methods are highly energy demanding and none of the two is able to provide hydrogen pure enough to use, for example, with fuel cells, that require hydrogen 99.9995% pure to prevent poisoning the catalyst [20]. To address this demand of ultrapure hydrogen, membranes for hydrogen purification are being developed.
1.3.2. Membrane Technology
The use of membranes for hydrogen separation is a method that has been commercialized since the 1960s for small scale applications only. Many materials have been developed, such as polymeric, microporous ceramic, porous carbon, dense metallic and proton conducting dense ceramic materials. The mechanism of hydrogen transport through these membranes is dependent on the material and if the membrane is porous or dense. However, for all the membranes, the driving force for the separation is the difference in pressure (or chemical potential) of the hydrogen present upstream and downstream of the membrane [21].
8
Dense palladium-silver alloys are the benchmark material for hydrogen separation membranes. When using this type of material, 99% recovery of hydrogen with purity exceeding 99.9999% is possible [19]. However, these membranes are rapidly deactivated in the presence of hydrogen sulfide [22], a gas present at the exit of a natural gas steam reformer and coal gasification units. Moreover, palladium is also a costly metal. These two drawbacks justify the small scale application of this type of purification method.
One possible approach to increase the commercial competiveness of Pd-based membranes is cost reduction by decreasing the thickness of the membranes. This means that a porous substrate (stainless steel, alumina, or other) that provides mechanical support may be required. The US Department of Energy (DOE) has set a price target for the palladium membranes at less than 1080 USD/m2 by 2015 [23] that has not yet been achieved.
Another alternative to overcome the hurdles of palladium and palladium-silver membranes is to use other palladium alloys that offer the same performance as Pd-Ag but requiring less amount of palladium while providing higher H2S resistance. In this regard copper or palladium-gold alloys seem promising [24-34]. For example, the latter alloys are able to keep higher hydrogen flux when compared to both PdCu and PdAg alloys [22]. On the other hand, a Pd47Cu53 membrane is able to maintain 70% of the flux of a Pd73Ag27 membrane1 (0.208 vs. 0.298 scfh, respectively) of the same thickness and at the same conditions of pressure and temperature, while decreasing the amount of palladium required by 18% (mass based) [22]. The high hydrogen flux through a membrane made of PdCu alloys with low Pd content is attributed to the existence of a body-centered cubic structure, which is observed at Pd concentrations between 34 and 47 at %, for which the diffusion of hydrogen is facilitated [35-37]. Palladium-based membranes will be further discussed in chapter 2.
1 Throughout this thesis, the alloys composition, for example Pd
xCu1-x, is always given in atomic percent, except if clearly stated otherwise.
9
1.4. Objectives of the work
The current work aims to contribute to the development of palladium-based membranes that are both inexpensive and resistant to poisoning. In this regard, the work will focus on PdCuAu ternary alloys in an attempt to combine in one single alloy the high hydrogen flux at low Pd content of PdCu with the high H2S poisoning resistance of PdAu. The main goal is to study the ternary alloys in respect to their solubility and permeability to hydrogen.
The objectives of the present work may be divided in two distinct sections: section 1 which deals with PdCuAu thin films and the electrochemical measurement of hydrogen solubility, while
section 2 is dedicated to the fabrication and testing of unsupported PdCuAu alloy-membranes. A
description of the objectives follows.
Objectives section 1 – thin films and hydrogen solubility
1. Use thin film deposition technologies, namely electrodeposition and sputter deposition, to prepare PdCuAu alloys over a wide composition range.
a. Characterize as-deposited samples in regard of their crystal structure, composition and morphology, using X-ray diffraction (XRD), Energy Dispersive X-ray spectroscopy (EDX), X-ray Photoelectron Spectroscopy (XPS), and Scanning Electron Microscopy (SEM).
2. Identify the composition of the PdCuAu alloys where the body-centered cubic (bcc) phase is stable by subjecting the as-deposited samples to heat treatment, followed by characterization (XRD, SEM/EDX, XPS and cyclic voltammetry, CV).
3. Measure the hydrogen solubility of the as-deposited (face-centered cubic phase, fcc) and annealed samples (fcc and bcc phase) by an electrochemical method or by an electrochemical in situ XRD method.
Objectives section 2 – unsupported membranes and hydrogen permeability
1. Validate the experimental setup built for the gas phase measurement of hydrogen flux using a commercial palladium foil as a standard.
10
a. Choose appropriate composition according to the information gathered previously in the study of thin films;
b. Prepare the bulk PdCuAu alloys by mechanical alloying of the pure metal powders;
c. Develop a method to prepare functional dense metallic membranes from the mechanically alloyed powders.
3. Measure the hydrogen flux through the membranes in the presence of pure hydrogen and hydrogen mixtures with H2S.
1.5. Structure of the thesis
This thesis is organized in 7 different chapters. In chapter 1, an introduction is made to the hydrogen production and purification methods, providing the context of the present work. Chapter
2 provides a detailed analysis of the current developments and most promising perspectives for
Pd-based membranes. The experimental conditions and techniques are all thoroughly described in
chapter 3. The results are summarized in chapters 4, 5 and 6. Chapters 4 and 5 correspond to
section 1 and chapter 6 corresponds to section 2, as described in the objectives. Chapter 4 deals with the electrodeposition of thin films, their characterization and the measurements of their hydrogen solubility properties, especially alloys with fcc structure. Chapter 5 is analogous to chapter 4 but is focused on samples prepared by sputter deposition and more emphasis is given to samples with bcc structure. Chapter 6 presents the preparation of unsupported PdCuAu alloy-membranes and their performance in the gas phase measurements. Finally, chapter 7 presents the conclusion and a description of future work that will need to be performed. A summary in French is available in section A1.
11
1.6. References
[1] Greenwood NN, Earnshaw A. Chemistry of the Elements. Second ed: Butterworth-Heinemann; 1997.
[2] Ramachandran R, Menon RK. An overview of industrial uses of hydrogen. International Journal of Hydrogen Energy. 1998;23:593-8.
[3] Winter C-J. Hydrogen energy — Abundant, efficient, clean: A debate over the energy-system-of-change. International Journal of Hydrogen Energy. 2009;34:S1-S52.
[4] Singh S, Jain S, Ps V, Tiwari AK, Nouni MR, Pandey JK, et al. Hydrogen: A sustainable fuel for future of the transport sector. Renewable and Sustainable Energy Reviews. 2015;51:623-33. [5] Nenoff TM, Spontak RJ, Aberg CM. Membranes for hydrogen purification: An important step toward a hydrogen-based economy. Mater Res Soc Bull. 2006;31:735-41.
[6] http://www1.eere.energy.gov/hydrogenandfuelcells/production/coal_gasification.html.
[7] Gabitto J, Tsouris C. Sulfur poisoning of metal membranes for hydrogen separation. International Review of Chemical Engineering. 2009;1:394-411.
[8] http://www1.eere.energy.gov/hydrogenandfuelcells/production/natural_gas.html;. [9] http://en.wikipedia.org/wiki/Hydrogen_economy.
[10] Turner JA. Sustainable Hydrogen Production. Science. 2004;305:972-4.
[11] Holladay JD, Hu J, King DL, Wang Y. An overview of hydrogen production technologies. Catalysis Today. 2009;139:244-60.
12
[13]
http://www.linde-engineering.com/en/process_plants/hydrogen_and_synthesis_gas_plants/gas_generation/co_shift _conversion/index.html.
[14] http://energy.gov/eere/fuelcells/hydrogen-production-biomass-gasification.
[15] Zeng K, Zhang D. Recent progress in alkaline water electrolysis for hydrogen production and applications. Progress in Energy and Combustion Science. 2010;36:307-26.
[16] Esswein AJ, McMurdo MJ, Ross PN, Bell AT, Tilley TD. Size-Dependent Activity of Co3O4 Nanoparticle Anodes for Alkaline Water Electrolysis. The Journal of Physical Chemistry C. 2009;113:15068-72.
[17] Rosen MA. Exergy analysis of hydrogen production by thermochemical water decomposition using the Ispra Mark-10 Cycle. International Journal of Hydrogen Energy. 2008;33:6921-33. [18] http://energy.gov/eere/fuelcells/hydrogen-production-thermochemical-water-splitting. [19] Grashoff GJ, Pilkington CE, Corti CW. Purification of hydrogen. Platinum Metals Review. 1983;27:157-69.
[20] Ockwig NW, Nenoff TM. Membranes for Hydrogen Separation. Chemical reviews. 2007;107:4078-110.
[21] Hägg M-B. Membranes in gas separation. In: Pabby AK, Rizvi SSH, Satre AM, editors. Handbook of Membrane Separations - Chemical, Pharmaceutical, Food, and Biotechnological Applications: CRC Press; 2009.
[22] Mckinley DL. Metal alloy for hydrogen separation and purification. United States: US patent 3,350,845; 1967.
13
[23] Phair JW, Donelson R. Developments and Design of Novel (Non-Palladium-Based) Metal Membranes for Hydrogen Separation. Industrial & Engineering Chemistry Research. 2006;45:5657-74.
[24] Kamakoti P, Morreale BD, Ciocco MV, Howard BH, Killmeyer RP, Cugini AV, et al. Prediction of Hydrogen Flux Through Sulfur-Tolerant Binary Alloy Membranes. Science. 2005;307:569-73.
[25] Coulter KE, Way JD, Gade SK, Chaudhari S, Sholl DS, Semidey-Flecha L. Predicting, Fabricating, and Permeability Testing of Free-Standing Ternary Palladium-Copper-Gold Membranes for Hydrogen Separation. Journal of Physical Chemistry C. 2010;114:17173-80. [26] Coulter KE, Way JD, Gade SK, Chaudhari S, Alptekin GO, DeVoss SJ, et al. Sulfur tolerant PdAu and PdAuPt alloy hydrogen separation membranes. Journal of Membrane Science. 2012;405-406:11-9.
[27] Gade SK, Payzant EA, Park HJ, Thoen PM, Way JD. The effects of fabrication and annealing on the structure and hydrogen permeation of PdAu binary alloy membranes. Journal of Membrane Science. 2009;340:227-33.
[28] Flanagan TB, Wang D. Hydrogen Permeation through fcc Pd-Au Alloy Membranes. Journal of Physical Chemistry C. 2011;115:11618-23.
[29] Gallucci F, Fernandez E, Corengia P, van Sint Annaland M. Recent advances on membranes and membrane reactors for hydrogen production. Chemical Engineering Science. 2013;92:40-66. [30] Peters TA, Kaleta T, Stange M, Bredesen R. Hydrogen transport through a selection of thin Pd-alloy membranes: Membrane stability, H2S inhibition, and flux recovery in hydrogen and simulated WGS mixtures. Catalysis Today. 2012;193:8-19.
14
[31] Hatlevik Ø, Gade SK, Keeling MK, Thoen PM, Davidson AP, Way JD. Palladium and palladium alloy membranes for hydrogen separation and production: History, fabrication strategies, and current performance. Separation and Purification Technology. 2010;73:59-64. [32] Semidey-Flecha L, Ling C, Sholl DS. Detailed first-principles models of hydrogen permeation through PdCu-based ternary alloys. Journal of Membrane Science. 2010;362:384-92.
[33] Sonwane CG, Wilcox J, Ma YH. Solubility of Hydrogen in PdAg and PdAu Binary Alloys Using Density Functional Theory. The Journal of Physical Chemistry B. 2006;110:24549-58. [34] Gade SK, DeVoss SJ, Coulter KE, Paglieri SN, Alptekin GO, Way JD. Palladium–gold membranes in mixed gas streams with hydrogen sulfide: Effect of alloy content and fabrication technique. J Membr Sci. 2011;378:35-41.
[35] Subramanian PR, Laughlin DE. Cu-Pd (Copper-Palladium). Journal of Phase Equilibria. 1991;12:231-43.
[36] Howard BH, Killmeyer RP, Rothenberger KS, Cugini AV, Morreale BD, Enick RM, et al. Hydrogen permeance of palladium-copper alloy membranes over a wide range of temperatures and pressures. Journal of Membrane Science. 2004;241:207-18.
15
2. Dense palladium based metallic membranes for the separation of
hydrogen gas
2.1. Introduction
The discovery by T. Graham that palladium absorbs hydrogen dates back from 1866. T. Graham observed that Pd absorbs 935 times its own volume of H2 while cooling down from red hot, corresponding to a composition of PdH0.5. The gas is released again upon heating of the metal [1, 2]. The hydrogen absorption decreases the metallic conductivity of palladium, but the ductility of the metal is kept constant. T. Graham took his studies further by testing a palladium tube built by George Matthey (co-founder of Johnson Matthey company, along with Percival Norton Johnson) [3]. When subjecting the palladium tube to coal-gas (a mixture of hydrogen, carbon monoxide, methane, carbon dioxide and nitrogen) at 270°C, T. Graham noticed that “the penetrating gas had no odor of coal-gas, contained no trace of carbon, and appeared to be absolutely pure hydrogen” [3]. This may well be considered the first account of a dense palladium-based metallic membrane. Additional work of T. Graham involved the study of palladium-silver alloys, that later on, in the 1960s, started being commercialized by Johnson Matthey, for small scale production of ultrapure hydrogen [2, 4].
The pioneer work of D. L. McKinley in 1960s is considered a breakthrough in the development of Pd-based membranes. D.L. McKinley intensively studied Pd alloys of copper, silver and gold at different conditions of temperature, pressure and inlet gas composition [5, 6]. He was the first investigator to identify a palladium-copper alloy at 47 at% Pd that has the same performance of pure palladium [5], and also the first to report on the effect of gold in preventing the catalytic poisoning of the membrane by hydrogen sulfide gas [6].
This chapter will first introduce the concepts of hydrogen diffusion and permeability through a dense metallic membrane, along with the mechanisms of hydrogen transport. A description of the palladium-hydrogen interaction will follow. Finally, a literature review on palladium alloys (specifically: PdCu, PdAu and PdCuAu) will be presented.
16
2.2. Hydrogen diffusion and permeability in Pd-dense metallic membranes
In broad terms, a membrane is a barrier that allows the selective passage of a substance, while retaining others. In gas separation, dense metallic membranes are a particular type of membranes that operate through a mechanism of solution-diffusion, in contrast with porous membranes that are mostly based on size exclusion separation mechanisms. These mechanisms are illustrated in Fig. 2.1.
Figure 2. 1 – Schematic illustration of the mechanism of hydrogen permeation through a porous
membrane (denoted PM, on the left) and a dense metallic membrane (right). The latter is referred to as the solution-diffusion mechanism and is composed of 5 steps: I – H2 adsorption; II – H2 dissociation into atomic hydrogen; III – diffusion; IV – atomic H recombination; and V) H2 desorption.
17
Independent of the type of membrane, namely porous or dense metallic, the separation is always driven by a difference in the hydrogen partial pressure between the feed (high pressure, retentate or upstream) and the permeate (low pressure or downstream) sides of the membrane. In this sense, the hydrogen flux, defined as the amount of hydrogen transported through the membrane per unit time and unit area (mol·s-1·m-2), occurs from the feed to the permeate side. As shown in Fig. 2.1, the solution-diffusion mechanism is divided in 5 steps. First, on the feed side, H2 is adsorbed on the surface of the palladium. After, the H-H bond is cleaved by palladium (step II, Fig. 2.1) and the hydrogen atoms are consequently inserted in the octahedral interstices of the palladium fcc lattice. In fact, it is generally accepted that the combined s-d bands of palladium accept the electron of the hydrogen atom[7] and it is the proton that will be positioned in the octahedral interstices, even if palladium and hydrogen have comparable electronegativities. At the temperatures at which these membranes are usually operated (>300°C), the H atoms hop between neighboring sites through activated thermal jumps (step III, Fig. 2.1) [8]. Finally, when reaching the permeate side, the hydrogen atoms recombine to form molecular hydrogen and desorb from the surface of the membrane (steps IV and V of Fig 2.1, respectively). As hydrogen atoms are the only ones that are able to diffuse through the palladium lattice, the palladium membranes are highly selective and, at least theoretically, 100% pure H2 may be produced. In the case of porous membranes (designated by PM on the left side of Fig. 2.1), it is the relative size of the gas molecules versus the size of the pores that is ruling the separation. This type of membranes do not require any palladium in their composition and can be produced from much less expensive materials such as carbon. Porous membranes may be more cost effective but are not usually able to achieve the selectivity that can be reached by dense Pd-based membranes. In fact, the existence of pores in dense metallic membranes is highly undesirable as their presence will reduce the quality of the separation. Porous membranes are out of the scope of the present work.
The diffusion of hydrogen atoms through a palladium membrane can mathematically be represented by Fick’s law (equation 2.1) that relates the flux of hydrogen atoms (𝐽𝐻) with the diffusion coefficient (𝐷𝐻) and the concentration gradient across the membrane (𝑑𝐶𝐻⁄ , 𝐶𝑑𝑥 𝐻 being
18 𝐽𝐻 = −𝐷𝐻𝑑𝐶𝐻
𝑑𝑥
The conditions used for the integration of equation 2.1 are schematically illustrated in Fig. 2.2.
Figure 2. 2 – Boundary conditions used in the integration of Fick’s law of diffusion. The
concentration gradient within the membrane is considered linear.
Using the boundary conditions set in Fig 2.2, where the concentration gradient within the membrane is considered linear, and considering steady state conditions, the integrated version of equation 2.1 can be written as:
![Figure 2. 4 – Pressure-composition-temperature phase diagram of the palladium-hydrogen system (adapted from [13, 15, 16])](https://thumb-eu.123doks.com/thumbv2/123doknet/5391323.125386/45.918.252.709.102.511/figure-pressure-composition-temperature-diagram-palladium-hydrogen-adapted.webp)