AIR CO
2IN COMBLAIN-AU-PONT CAVE (BELGIUM)
RELATIONSHIPS WITH SOIL CO
2AND OPEN AIR METEOROLOGY
Jean Godissart1, Camille Ek2
1 Union belge de Spéléologie, jean.godissart@skynet.be 2 Université de Liège, Géologie, camille.ek@ulg.ac.be
Abstract. The Comblain-au-Pont Cave is located in Belgium, 25 km south of Liège, at 180 m altitude, in a temperate oceanic climate. Our measurements of CO2 in the cave and different surrounding soils show the relationships between
cave climate, outer atmosphere meteorology and CO2 production in the soils.
Carbon dioxide (thought to come in the main from plant root and biomass respiration) displays seasonal variations related to outside temperature, but some oscillations of the CO2 content of cave air are related to surface barometric
variations (i.e., when the barometric pressure falls, a certain amount of air trapped in the remote parts of the system leaks outside and vice versa).
A sudden drop of temperature, inducing a chimney effect may cause a drop of the air-CO2 content of a deep pit from
4000 to 1300 ppm.
Most of our recent findings are due to the use of continuous loggers, whereas our old methods were based on sporadic measurements, only made at the time of our visits to the cave.
1. Introduction
Caves usually display a very stable, uniform, climate. Temperature and humidity are generally very constant. However, closer investigation shows important variations in some climatic parameters. We have studied some of them over many years, and particularly the CO2 content of
the air (Ek C, 1960a, 1979, 1990; Ek C et al., 1968; Ek C, Gewelt M, 1985; Ek C, Godissart J, 2009; Ek C et al., 1969; Ek C, Godissart J, 2007; Delecour F et al., 1968, Godissart J, 1994; Godissart J, Ek C, 2009; Godissart J, Ek C, 2011; Godissart J, Delvenne P, 1975).
We are presently improving our knowledge of the climate of the Comblain-au-Pont Cave, a little touristic cave located 25 km south of Liège (Belgium).
The Comblain-au-Pont Cave lies in a syncline of
Carboniferous Limestone, specifically Visean Limestone, in a brecciated formation, folded by variscian orogenesis. The entrance lies at an altitude of 180 m. The region has an oceanic temperate climate. Land use over the cave includes forest, meadows and cultivation. Tourist frequentation is weak, about 6 000 persons a year. The cave morphology is simple (fig. 1). The only natural entrance is a 22 m shaft. A tunnel was drilled to allow entry. The cave consists of a string of chambers connected by narrow passages; most of these lie at a low level, at the bottom of the chambers.
We were able to deepen our knowledge of the cave thanks to monitoring devices provided by the Service public de Wallonie (S.P.W., Walloon Region Administration).
2. Technical procedures
We measure CO2 content of the air with two hand-held
devices.
The Gastec pump uses a hydrazine cell. Hydrazine reacts with CO2 and a scale on the cell indicates the amount of
reagent used, hence the quantity of CO2.
The Draeger X-am 7000 is a practical and fast infrared CO2-meter. It provides an instantaneous reading on a LCD
screen.
Both devices have been described in previous papers, and particularly in Ek C, Godissart J, 2009. We still use them. A new device at our disposal is the Vaisala Carbocap carbon dioxide meter GM70, which includes a data logger. Its CO2 sensor works by IR absorption. The
reading accuracy is 10 ppm, and the measurement repeatability around 20 ppm. We got three of them.
3. Results and discussion
We will deal here with the Comblain-au-Pont Cave only, and we will give a few examples of the relationships between cave atmosphere and meteorological events outside.
3.1. Seasonal variations (fig. 1 and 2)
Temperature and humidity are quite constant in the cave throughout the year, at least in the most remote half of the cave. Humidity is about 100 % and temperature 10,4°C. But it is very different with CO2, as is already well known
in other caves (Ek C, 1990; Ek C, Gewelt M, 1985; Baldini J et al., 2006; Mitchell JN, Mitchell EJ, 2009; Mattey et al., 2010; etc.).
In the Comblain-au-Pont Cave, there is much more CO2 in
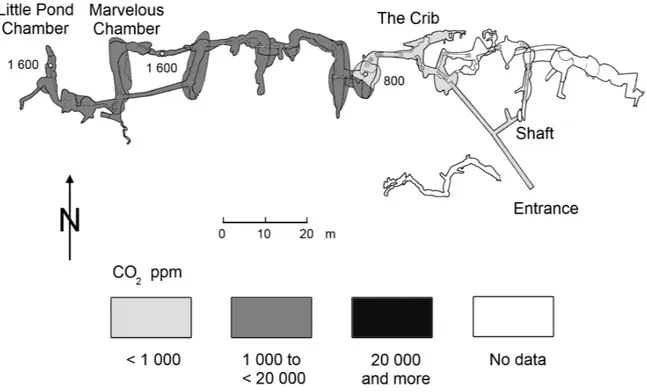
the air at the end of summer than at the end of winter. At the end of winter, the maximum content of cave air is about 1600 ppm at the far end (fig. 1). This is
approximately four times the CO2 concentration in open
Figure 1. CO2 content of the air in the Comblain-au-Pont Cave in winter (February 8, 2012).
Figure 3. CO2 seasonal variation in the cave, at the Little Pond Chamber (far end of the cave) and at the lower part of the Marvellous Chamber (a low-level site), from July 2011 to November 2012.
Figure 4. Barometric pressure at Soumagne “Phitofa” meteo station, January 2 to 8, 2012. A noticeable low occurs on January 5.
At the end of summer, in August, the amount of CO2, rises
to 21 000 ppm, i.e. 2,1 % (fig. 2), more than fifty times the figure in outer atmosphere.
This maximum is highly variable. In this cave, we have registered summer maximums between 17 600 ppm (September, 2011) and 26 500 ppm (September, 2009). The minimum always occurs just after the coldest period of the year, and the maximum at the end of the summer. We think that this is related to temperature, but also to vegetation, which also depends on temperature. We had noticed in another cave (Ek C, Gewelt M, 1985) that the maximum CO2 content in cave air was sometimes earlier
in the upper levels of a cave than in the lower chambers. In Comblain-au-Pont, we also measure the CO2 content of
soil air. And we have sometimes noted that the soil maximum occurs in May or June, much earlier than in the cave; air descends slowly from the soil to the caves. But this year, we observed a maximum CO2 content in the soil
in August. It is thus important not to infer too fast a conclusion from a correlation observed once.
However, it is clear that the CO2 levels observed in the
caves are more similar to soil CO2 levels than to open air
CO2 amounts (Latte N, 2010). And the rhythm is
somewhat parallel to the one of the soils.
3.2. A barometric low can influence the cave atmosphere (fig. 3 to 5)
Cave air contains high levels of CO2 in August and
September and much less in winter, from December to March : this is confirmed by figure 3, which shows the annual cycle of 2012 in two different places : the Little Pond Chamber, at the very end of the cave, and the lower passage near the Marvellous Chamber. However, there are two moments where the “Marvellous” curve shows a sharp and temporary peak : about January 5 and June 7, 2012. Looking at a meteo station nearby (at Soumagne, 20 km NE of Comblain-au-Pont), we observe a strong barometric low on January 5, and another on June 7 (fig. 4 and 5). We think that the explanation lies in the cave morphology and hydrology.
The low-level gallery below the Marvellous Chamber is more than 10 meters lower than Pond Lake. It is thus closer to the underground drainage below the accessible passages of the cave. When atmospheric pressure drops outside, cave air leaks out, sucking air from the remote parts of the system. This air, confined for a long time, is richer in CO2, hence the peaks observed on figure 3.
On January 5 and June 7, we observed a slight flood in the low level gallery beneath the Marvellous Chamber : water was invading the deepest cave passages because of the rains accompanying the barometric lows. Similar relation-ships between barometric changes and CO2 level
vari-ations have also been observed by Baldini J et al. and by Mitchell JN, Mitchell EJ, 2009.
It is thus clear that changes in outside air pressure induce changes in the cave.
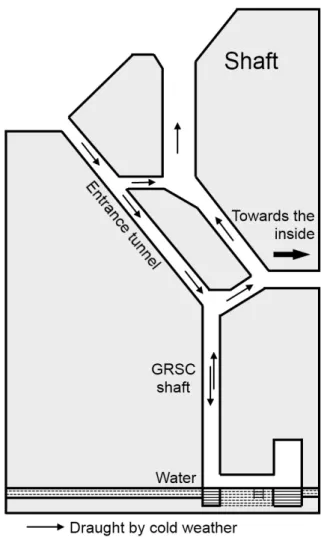
Figure 6. Draught occurring in cold weather in the entrance tunnel and in the GRSC shaft. A chimney effect is due to the difference of level of the two entrances.
3.3. Influence of some changes in outside temperature 3.3.1. Circadian CO2 oscillations (fig. 6 and 7)
We placed a data logger in the Crib, a small chamber, not far from the entrance tunnel, and about 50 m away from the entrance.
As previously noted, the cave has two entrances at different levels : the shaft mouth is about 10 m higher than the tunnel entrance. A draught sometimes blows in the galleries connecting these two entrances (fig. 6). Although not in this circuit, the Crib lies nearby (about 15 m). A data logger set in the Crib from April 12 to April 26, 2012, registered the air CO2 concentration every three
hours for 15 days. We computed the average CO2
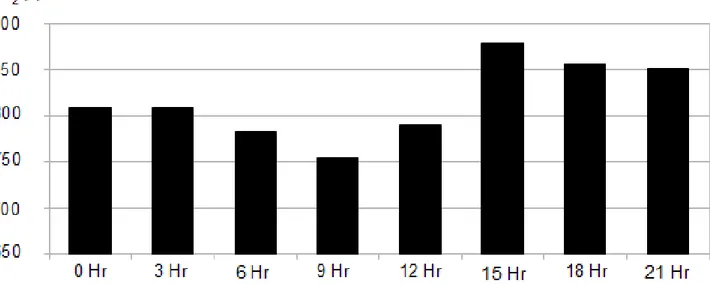
concentrations and the graph clearly shows a statistical trend to a morning minimum, between 6 and 9 a.m., and an afternoon maximum, between 3 and 6 p.m.
Early in the morning, CO2-poor cold air from outside
flows into the cave, whereas in the afternoon, when the outside atmosphere is warmer, air does not flow into the cave.
This data logging shows that daily oscillations of temperature induce a circadian rhythm in the CO2
Figure 7. Mean CO2 content of the air in the Crib from April 12 to April 26, 2012. CO2 was measured every three hours during these two weeks. Mean values only are presented here.
Figure 8. CO2 in the GRSC shaft from May 25 to June 6, 2012, and surface temperature during the same period. Air temperature falls below +5°C on June 5 (at dawn).
3.3.2. A sharp fall of CO2 concentration in a pit (fig. 8)
Because of the existence of two entrances at different levels, the cave is sometimes subjected to a chimney effect : when the outer temperature drops below +5 °C, cold air enters in the tunnel entrance – the lower one – and cave air (at +10,4 °C) gets out through the shaft (fig. 5). We have observed that there is no draught when the temperature at the surface is +5 °C or more. Near the entrances, in a low-level zone, there is a deep pit in the cave floor. The water filling the bottom of this 35 m-deep shaft is the only indication of the underground drainage of the cave (fig. 6).
We logged the CO2 content of the pit air about 5 m below
its top from May 21 to June 7, 2012. In the spring, the CO2 concentration in the cave increased the log displaying
a serrated rise. But on June 5, early in the morning, the
CO2 curve rose abruptly and, immediately after, collapsed
to less than one half of its previous value : from 4000 to 1300 ppm ! (fig. 8).
The cause of this sharp drop in CO2 concentration is the
fall in outside temperature to below 5 °C (fig. 8) – allowing cold and dense air to rush down into the pit and replace the stale air at the bottom.
4. Conclusions
With the previous methods we could only perform sporadic measurements, at the time of our visits to the caves. Data logging allows continuous tracking of several physical parameters. Simultaneous logging of several parameters leads to correlations between various phenom-ena.
Surface barometric variations induce noticeable move-ments underground. When pressure is low, air trapped in the interconnected parts of the limestone is carried from the most remote voids to the cave by advection and con-versely by highs.
A deep pit, the GRSC shaft, going down to the watertable, is filled with CO2 rich air. In winter, when the temperature
is below 5°C and the chimney effect is working, cold air flows into the cave and invades the pit, driving out the CO2 rich air from the shaft and replacing it with fresh air.
Monthly surveys of the cave show the close relationship of its CO2 content with outside climate, and particularly
pedoclimate.
Acknowledgments
This work has been supported by the Service public de Wallonie, who provided us with data loggers and other analytic devices. We are grateful to the S.P.W. for this backing. We thank the “Découvertes de Comblain”, the Association that manages the studied cave, and its Director Julien Goijen, for effective technical support. We are grateful to Dr.Vincent Brahy, Dr. Patrick Engels, Dr. Jacques Hébert and Dr. Philippe Meus, for their useful scientific advice and presence on the field.
Peter Blackie corrected our English. The remaining mistakes are ours. Nicolas Klingler and Barnabé Ek provided helpful technical collaboration.
Our best thanks to Philippe Labarbe who drew all our figures. Last but not least, we are grateful to Marie-Claire Cellier for the layout of this paper.
References
Atkinson TC, 1977. Carbon dioxide in the atmosphere of the unsaturated zone : An important control of groundwater hardness in limestones. Journal of Hydrology, 35 (1-2), pp. 111-123.
Baldini J, Baldini L, McDermott F, Clipson N, 2006. Carbon dioxide sources, sinks, and spatial variability in shallow temperate zone caves : Evidence from Ballynamintra Cave, Ireland. Journal of Cave and Karst Studies, v. 68(1), pp. 4-11. Delecour F, Ek C, Weissen F, 1968. An electrolytic field device for the titration of CO2 in air. National Speleological Society
Bulletin, 30, pp. 131-136.
Ek C, 1969a. Abondance du gaz carbonique dans des fissures de grottes. V. Internationaler Kongress für Speläologie, Stuttgart, 2 (14) , pp. 1-3.
Ek C, 1969b. Facteurs, processus et morphologie karstiques dans les calcaires paléozoïques de la Belgique, thèse de doctorat, Faculté des Sciences, Université de Liège, 3 volumes. Ek C, 1979. Variations saisonnières des teneurs en CO2 du trou
Jonay, Annales de la Société géologique de Belgique, 102, pp. 71-75.
Ek C, 1990. La Merveilleuse, nouvelle grotte de Dinant. Liège, Imprimerie Lesire, 64p.
Ek C, Delecour, F, Weissen, F, 1968. Teneur en CO2, de l'air de
quelques grottes belges, Technique employée et premiers résultats. Annales de Spéléologie, 23, pp. 243-257.
Ek C, Gewelt, M, 1985. Carbon dioxide in cave atmospheres. New results in Belgium and comparison with some other countries. Earth Surface Processes and Landforms, 10, pp. 173-187.
Ek C., Gilewska S, Kaszowski L, Kobylecki A, Oleksynowa K., Oleksynowna B, 1969. Some analyses of the CO2 content of
the air in five Polish caves. Zeitschrift für Geomorphologie, Neue Folge, 13 : 267-286.
Ek, C., Godissart J, 2007. La grotte et l’abîme de Comblain-au-Pont. Découverte géologique de Comblain-au-Pont et environs, 88 p.
Ek C, Godissart J, 2009. Extreme increase of CO2 in Belgian
caves. Proceedings of the 15th International Congress of Speleology, Kerrville, Texas, pp. 1467-1473.
Godissart J, 1994. Le cycle annuel des températures et du CO2
dans la grotte de Fontaine de Rivîre à Hamoir (Belgique). Comptes rendus du Colloque international de Karstologie de 1992 à Luxembourg. Service géologique du Luxembourg, pp. 181-185.
Godissart J, Delvenne P, 1975. Observation sur les fluctuations du CO2 de l’air émis par une caverne dans différentes
conditions d’écoulement. Annales de Spéléologie, 30 (3), pp. 401-402.
Godissart J, Ek C, 2009. Crue du gaz carbonique dans l’air des grottes. Ecokarst, bulletin de la Commission wallone d’Etude et de Protection des Sites souterrains, 76, pp. 1-4.
Godissart J, Ek C, 2011. L'atmosphère de la grotte de Ramioul, Bulletin des Chercheurs de la Wallonie, hors-série n° 3, pp. 45-66.
Latte N, 2010. Vers un bilan "carbone" de la forêt wallonne. Les inventaires forestiers nationaux. Journée d'études du 12 mai 2010. Gembloux, Agro-Bio Tech, pp. 13-14.
Mattey D, Fairchild I, Atkinson T, Latin J-P, Ainsworth M., Durell R, 2010. Seasonal microclimate control of calcite fabrics, stable Isotopes and trace elements in modern speleothems from St Michaels Cave, Gibraltar. Geological Society, London, Special Publications 2010; 336, pp. 323-344. Mitchell JN, Mitchell EJ, 2009. Airflow and CO2 in Robber
Baron Cave. Proceedings of the 15th International Congress of Speleology, Kerrville, Texas, pp. 1613-1619.


