*Corresponding author: Nicolas Sauvageot, Centre de Recherche Public de
la Santé, Centre d’Etudes en Santé, 1A rue Thomas Edison, Strassen, L-1445, Grand-Duchy of Luxembourg, E-mail: [email protected] Received February 25, 2013; Accepted April 25, 2013; Published April 30, 2013 Citation: Sauvageot N, Alkerwi A, Adelin A, Guillaume M (2013) Validation of the Food Frequency Questionnaire Used to Assess the Association between Dietary Habits and Cardiovascular Risk Factors in the NESCAV Study. J Nutr Food Sci 3: 208. doi:10.4172/2155-9600.1000208
Copyright: © 2013 Sauvageot N, et al. This is an open-access article distributed
under the terms of the Creative Commons Attribution License, which permits unrestricted use, distribution, and reproduction in any medium, provided the original author and source are credited.
Validation of the Food Frequency Questionnaire Used to Assess the
Association between Dietary Habits and Cardiovascular Risk Factors in
the NESCAV Study
Nicolas Sauvageot*, Ala’a Alkerwi, Albert Adelin and Michèle Guillaume
Centre de Recherche Public de la Santé, Centre d’Etudes en Santé, 1A rue Thomas Edison, Strassen, L-1445, Grand-Duchy of Luxembourg
Abstract
Background: In epidemiological studies, the validation of dietary assessment instruments is important to avoid
biased associations with outcome measures.
Objective: Our objective was to assess the validity of the 134-item food frequency questionnaire (FFQ) used in
the Nutrition Environment and Cardiovascular Health (NESCAV) study.
Methods: The FFQ was validated against a 3-day dietary record (DR) on a sample of 29 women. The
intra-class correlation coefficient (ICC) and Bland and Altman plots were used to assess absolute agreement, whereas relative agreement was appraised by Spearman’s correlation coefficient and Cohen kappa coefficient based on cross classification of 3-category nutrient intake.
Results: The two methods differed significantly for the majority of micronutrients with FFQ yielding higher intakes
than the DR. The bias between the two methods was nonetheless acceptable with an average overestimation by the FFQ of 11% for macronutrients and 29% for micronutrients. Regarding precision, results differed by 48% for micronutrients and 50% for macronutrients. Correlations on energy-adjusted data by the two methods were satisfactory with an average correlation of 0.47 and 16/25 coefficients above 0.40. Only vitamin A and cholesterol showed poor correlations of 0.02 and 0.05, respectively. On average, the correct classification rate in 3 categories was 50.3% and 19/25 kappa coefficients were above 0.20. Poor agreement was found for protein, cholesterol, starch, vitamins A, B12 and E with weighted kappa coefficient less than 0.20.
Conclusion: Although absolute values of dietary intakes were not always accurate, the relationship and
agreement between FFQ and DR may be considered as satisfactory. In particular, the FFQ was able to categorize subjects into 3 broad categories of intakes for most nutrients. Results for proteins, cholesterol, starch, vitamins A, E and B12 however ought to be interpreted with caution.
Introduction
Unhealthy dietary habits are associated with chronic diseases such as cardiovascular disease and cancer [1,2]. A diet rich in energy, total fat, saturated fat and cholesterol but relatively low in unsaturated fats, fruits and vegetables has been linked to the development of cardiovascular risk factors [3]. However, further research is needed to better understand the effect that nutrition may have on cardio metabolic risk factors (such as hypertension, hypercholesterolemia, diabetes and obesity) [4]. In this context, the interregional NESCAV (Nutrition, Environment and Cardiovascular Health) study aimed to assess dietary habits of the Greater region’s population (Luxembourg, Wallonia in Belgium and Lorraine in France) and to explore the relationship between diet and cardiovascular risk factors (CVRF) [5].
In nutritional epidemiological studies, the measurement of diet constitutes a difficult challenge because of the complex nature of the diet itself [6]. Several dietary assessment methods are available, e.g. the dietary record (DR), 24-hour dietary recall, food frequency questionnaire (FFQ) and diet history. However none of these methods can measure dietary intake without errors [7]. One of the most common tools used to study the relation between diet and disease is the food frequency questionnaire, because of its easy administration and its low cost in studies with large sample size [8]. Therefore, for the NESCAV study, we used a modified FFQ previously designed to assess dietary habits in Quebec [9].
Research on diet-disease relationships requires accurate data collection of dietary intake and estimation of nutritional intake. The
accuracy of data is dependent on the precision and completeness of data collection, use of a representative and comprehensive food composition database, and consistency and precision during data entry. As such errors cause bias in relative risk estimates, it is paramount to estimate the validity of the instrument used to assess dietary intake.
Basically, validity studies are used to determine the degree of measurement errors and yield information about how well the instrument is measuring what it is intended to measure [10]. To assess the true validity of an FFQ would require measuring with high accuracy the usual self-selected diet of free living individuals over several months, which is not feasible. Therefore, researchers assess relative validity by comparing the FFQ with alternative dietary assessment methods considered to be more valid. Since multiple weekly dietary records are judged to be superior to FFQ, we choose it as reference method [11-13].
The effect of diet on a health outcome is most frequently quantified as odds ratio or relative risk in epidemiological studies. Therefore, FFQs must be able to rank individuals along the distribution of intake so that individuals with low intakes can be separated from those with high intakes and thus provide accurate risk estimates [10]. The capacity of ranking is assessed via the relative agreement. Additionally, as the NESCAV study also aims to assess the compliance of the population with dietary guidelines, it is therefore important that our modified FFQ measures accurately the dietary intakes. The objective of the present research work was to validate the FFQ used in NESCAV study by assessing both the relative and absolute agreement of the FFQ with a 3-day diet records (DR).
Materials and Methods
Description of the NESCAV study
NESCAV study is a cross-sectional study aiming to assess the prevalence of cardiovascular risk factors in the population of the Greater Region (Grand-Duchy of Luxembourg, Wallonia in Belgium, and Lorraine in France). The objectives are to assess, in a representative sample of 3000 randomly selected individuals living in the Greater Region, 1) the cardiovascular health and risk profile, 2) the association between the dietary habits and the cardiovascular risk, 3) the association of occupational and environmental pollution markers with the cardiovascular risk, 4) the knowledge, awareness and level of control of cardiovascular risk factors.
Validation study population
29 female workers were recruited from the University of Liege (Wallonia) to take part in the validation study.
FFQ (Tested method)
In NESCAV study, the dietary habits were assessed by using a semi-quantitative FFQ. The concept and rationale for major food groups has been developed, basing on the validated Canadian FFQ, which was composed of 73-food items to capture food consumption among adults living in Quebec [9]. Reliability and accuracy against four food records were examined in a validation study, which suggested that the original FFQ was a relatively valid instrument for determining usual diet in Quebec adults [9]. Our FFQ was adapted to the studied population’s cultural and linguistic particularities, to assess the subjects’ intake of energy and nutrients coming from different cultural backgrounds. For this purpose, intensive efforts were done to extend the items and integrate new foods to cover the diversity of dietary habits of the Greater Region’s population.
The last version of the FFQ aims to assess the dietary intake, by asking the participants to report the frequency of consumption and portion size of approximately 134 item lines over the last three months. Items are defined by a series of foods or beverages which are categorized into 9 major food groups: starchy food, fruits, cooked and raw vegetables, meat-poultry-fish-eggs, prepared dishes, dairy products, fats, drinks (alcoholic and non-alcoholic), and miscellaneous. The participants reported the frequency of consumption of each food group on the basis of 6 levels of frequencies: rarely or never; one to three times a month; one to two times a week; three to five times a week; one time a day; 2 times or more a day. Standard serving sizes and food models based on a photographic manual, validated by the French ‘SUpplementation en VItamines et Mineraux AntioXydants’ (SU. VI.MAX) study [14], are provided as a reference to aid the participants to estimate the portion size. Estimates of grams of food consumed
per day were calculated by multiplying the frequency of consumption of food items by the portion size chosen. The food items (g/d) were subsequently converted into daily nutrients intake by using the SU.VI. MAX Food Composition Database [15]. For a given nutrient, intakes from specific food items were then summed to obtain the total nutrient intake for each individual. Computed nutrient intakes of vitamins reflect only food sources.
The accessibility and readability of our FFQ were assessed in a pre-test phase on a multicultural group of subjects. Given the multi-linguistic nature of the population residing in Luxembourg, the FFQ was translated from French into the three most used languages, namely German, English and Portuguese, and then backward translated into French to ensure the linguistic validity [16].
The FFQ was self-administered with the help of trained research nurses. At the interview, the staff provided detailed instructions about how to fill in the FFQ, helped the participants individually to complete dietary information and then checked the correctness and completeness of the questionnaire.
3-day diet records (DR) (Reference method)
Participants were asked to take home and complete an open-ended 3DR. The diary booklet contained instructions and pages to record foods eaten during seven time periods (before breakfast, breakfast, mid-morning, lunch, tea, evening meal, later evening) for each of 3 days. For each participant, two days of the week and one day of the week-end were chosen at random. The mean daily intake of 3 dietary records was used as representative of DR.
Statistical analysis
Absolute agreement: Summary statistics were calculated and
presented for unadjusted data. Results were expressed as median and interquartile range (IQR). Nutrient intakes estimated from the FFQ were compared to those derived from the DR by the Wilcoxon signed-rank test. Bland-Altman graphs [17] which plot the difference between the results of two methods against their mean were used to assess the agreement between FFQ and DR over the entire range of intake levels. Spearman’s correlation coefficient was calculated to test for a potential relationship between methods difference and intake level (heteroscedasticity). In absence of significant correlation, the mean bias (mean difference) and 95% limits of agreement (LOA) were calculated as mean ± 2 standard deviation (SD) of the between-methods differences. Moreover, computations were also performed on log-transformed data and antilogs were then taken, providing limits for the FFQ/DR ratio. These ratios were expressed in percents with 100% representing perfect agreement. As bias could be compensated by positive and negative values, the precision (difference in absolute values) was also presented.
Relative agreement: Since one of the major goals of the NESCAV
study was to use the FFQ to assess the association between nutrient composition of the diet (rather than the absolute individual nutrient intakes) and cardiovascular risk factors, all nutrients were energy-adjusted according to the regression residual method of Willett and Stampfer [18]. Energy-adjusted nutrients are the residuals from regression analyses with energy intake as the independent variable and the nutrient intake as the dependent variable. Residuals are finally added to the expected nutrient value for the mean energy intake of the sample to obtain a score adjusted to the average energy intake. The agreement between energy-adjusted daily intakes from DR and FFQ were first measured by Spearman’s correlation coefficient for all nutrients; values > 0.40 being regarded as acceptable [19]. For values lower than 0.40, the
attenuation will be so severe that it will be difficult to detect associations between diet and disease [7]. For each nutrient, the distributions of FFQ and DR results were divided into 3 categories of equal frequency by means of terciles (low, medium and high intake). Individual results were then cross-classified in the FFQ and DR categories, and the FFQ correct classification rate obtained was considered as measure of its capacity of ranking. The proportion of FFQ subjects falling in opposite categories was also computed yielding an estimation of grossly misclassification errors. The agreement between the 3 categorical scales was also measured by the weighted Cohen kappa coefficient (ĸ); the weighting factors being 1 for complete agreement (same category), 0.5 for disagreement one category apart (adjacent categories) and 0 for complete disagreement (opposite categories). Kappa values were interpreted as follows: >0.80 indicates very good agreement, 0.61-0.80 good agreement, 0.41-0.60 moderate agreement, 0.21-0.40 fair agreement, and <0.20 poor agreements [20]. 95% confidence intervals (95% CI) of correlation and kappa coefficients were also computed.
Results were considered significant at the 5% critical level (P<0.05). All analyses were performed using SAS statistical software (version 9.2, SAS Institute Inc).
Results
Subjects’ characteristics
The 29 female participants ranged from 25 to 45 years old. All
were non-smokers and had a degree’s level less or equal than high school.
Absolute agreement between FFQ and DR
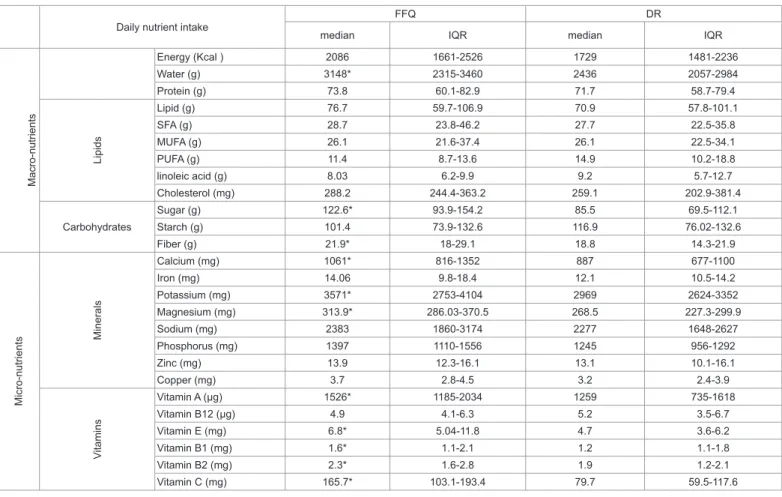
Table 1 displays summary statistics (median, IQR) for daily intakes of energy and 25 nutrients obtained from the FFQ and from the DR. The two methods differed significantly for the majority of micronutrients with the FFQ tending to report higher intakes than the DR. No differences were found for energy intake and for macronutrients except sugar and water. In general, the distributions of energy intake and of nutrient intakes for the FFQ were more dispersed than those for the DR.
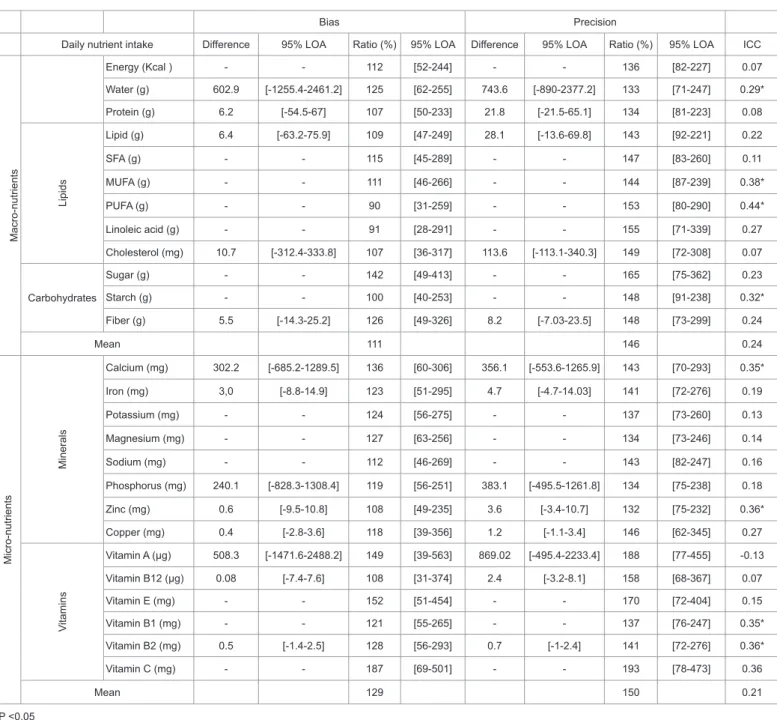
The results of the Bland and Altman analyses are shown in table 2. Mean differences were not computed in case of heteroscedasticity. The overestimation by the FFQ is clearly demonstrated by the mean ratios almost all above 100% (excepted for PUFA and linoleic acid). Overall, FFQ overestimated intake of DR by 21%. This overestimation was lower for macronutrients (11%) than for micronutrients (29%). FFQ-derived estimates for sugar, vitamins C, E and A were particularly overestimated with percentages of 42%, 87%, 52% and 49%, respectively. Although the bias is computed from positive and negative differences between FFQ and DR results, the mean of absolute differences gives an idea of the precision of the FFQ method. For PUFA, linoleic acid, cholesterol, starch and vitamin B12, the bias was relatively close to 100% (90%, 91%, 107%, 100% and 108%, respectively) whereas the precision was
Daily nutrient intake FFQ DR
median IQR median IQR
Macro-nutrients Energy (Kcal ) 2086 1661-2526 1729 1481-2236 Water (g) 3148* 2315-3460 2436 2057-2984 Protein (g) 73.8 60.1-82.9 71.7 58.7-79.4 Lipids Lipid (g) 76.7 59.7-106.9 70.9 57.8-101.1 SFA (g) 28.7 23.8-46.2 27.7 22.5-35.8 MUFA (g) 26.1 21.6-37.4 26.1 22.5-34.1 PUFA (g) 11.4 8.7-13.6 14.9 10.2-18.8 linoleic acid (g) 8.03 6.2-9.9 9.2 5.7-12.7 Cholesterol (mg) 288.2 244.4-363.2 259.1 202.9-381.4 Carbohydrates Sugar (g) 122.6* 93.9-154.2 85.5 69.5-112.1 Starch (g) 101.4 73.9-132.6 116.9 76.02-132.6 Fiber (g) 21.9* 18-29.1 18.8 14.3-21.9 Micro-nutrients Minerals Calcium (mg) 1061* 816-1352 887 677-1100 Iron (mg) 14.06 9.8-18.4 12.1 10.5-14.2 Potassium (mg) 3571* 2753-4104 2969 2624-3352 Magnesium (mg) 313.9* 286.03-370.5 268.5 227.3-299.9 Sodium (mg) 2383 1860-3174 2277 1648-2627 Phosphorus (mg) 1397 1110-1556 1245 956-1292 Zinc (mg) 13.9 12.3-16.1 13.1 10.1-16.1 Copper (mg) 3.7 2.8-4.5 3.2 2.4-3.9 Vitamins Vitamin A (µg) 1526* 1185-2034 1259 735-1618 Vitamin B12 (µg) 4.9 4.1-6.3 5.2 3.5-6.7 Vitamin E (mg) 6.8* 5.04-11.8 4.7 3.6-6.2 Vitamin B1 (mg) 1.6* 1.1-2.1 1.2 1.1-1.8 Vitamin B2 (mg) 2.3* 1.6-2.8 1.9 1.2-2.1 Vitamin C (mg) 165.7* 103.1-193.4 79.7 59.5-117.6
*P <0.05 measured by Wilcoxon signed-rank test. IQR : Interquartile range.
SFA : saturated fatty acids; MUFA : mono-unsaturated fatty acids; PUFA : poly-unsaturated fatty acids.
much worse (153%, 155%, 149%, 148% and 158%, respectively). For these nutrients, no evidence of bias was highlighted but the estimations differed by 50% or more. Overall, FFQ and DR differed by 46% for micronutrients and by 50% for macronutrients. This was confirmed by the ICC values which were quite low (0.07 for energy intake and a mean of 0.24 for macronutrients and 0.21 for micronutrients, respectively).
Relative agreement between FFQ and DR
Spearman’s correlations for unadjusted and energy-adjusted nutrient intakes obtained from the FFQ and the DR are presented in table 3. Correlations for unadjusted data ranged from -0.10 (vitamin A) to +0.65 (vitamin C). We noted that 7/26 correlation coefficients (water, PUFA, linoleic acid, calcium, vitamins B1, B2 and C) were
above 0.40. On average, correlations amounted 0.30. For almost every nutrient, energy adjustment led to higher correlation coefficients with an average correlation of 0.47 and 16/25 coefficients above 0.40. For macronutrients such as fibers, sugar, starch, MUFA, PUFA, SFA, and lipids, correlations were good. Correlations of common micronutrients such as iron, phosphorus, potassium, sodium, zinc, calcium, vitamins B1, B2 and C, ranged from 0.51 to 0.69 and were better than those of other micronutrients. Only vitamin A and cholesterol showed a poor correlation of 0.02 and 0.05, respectively. Interestingly, despite its poor absolute agreement (bias of 187% and precision of 193%), vitamin C demonstrated the best ranking capacity (correlation equal to 0.5 for unadjusted data and 0.69 for energy-adjusted data). Although 95% CI were quite large, most of them were statistically significant with
Bias Precision
Daily nutrient intake Difference 95% LOA Ratio (%) 95% LOA Difference 95% LOA Ratio (%) 95% LOA ICC
Macro-nutrients Energy (Kcal ) - - 112 [52-244] - - 136 [82-227] 0.07 Water (g) 602.9 [-1255.4-2461.2] 125 [62-255] 743.6 [-890-2377.2] 133 [71-247] 0.29* Protein (g) 6.2 [-54.5-67] 107 [50-233] 21.8 [-21.5-65.1] 134 [81-223] 0.08 Lipids Lipid (g) 6.4 [-63.2-75.9] 109 [47-249] 28.1 [-13.6-69.8] 143 [92-221] 0.22 SFA (g) - - 115 [45-289] - - 147 [83-260] 0.11 MUFA (g) - - 111 [46-266] - - 144 [87-239] 0.38* PUFA (g) - - 90 [31-259] - - 153 [80-290] 0.44* Linoleic acid (g) - - 91 [28-291] - - 155 [71-339] 0.27 Cholesterol (mg) 10.7 [-312.4-333.8] 107 [36-317] 113.6 [-113.1-340.3] 149 [72-308] 0.07 Carbohydrates Sugar (g) - - 142 [49-413] - - 165 [75-362] 0.23 Starch (g) - - 100 [40-253] - - 148 [91-238] 0.32* Fiber (g) 5.5 [-14.3-25.2] 126 [49-326] 8.2 [-7.03-23.5] 148 [73-299] 0.24 Mean 111 146 0.24 Micro-nutrients Minerals Calcium (mg) 302.2 [-685.2-1289.5] 136 [60-306] 356.1 [-553.6-1265.9] 143 [70-293] 0.35* Iron (mg) 3,0 [-8.8-14.9] 123 [51-295] 4.7 [-4.7-14.03] 141 [72-276] 0.19 Potassium (mg) - - 124 [56-275] - - 137 [73-260] 0.13 Magnesium (mg) - - 127 [63-256] - - 134 [73-246] 0.14 Sodium (mg) - - 112 [46-269] - - 143 [82-247] 0.16 Phosphorus (mg) 240.1 [-828.3-1308.4] 119 [56-251] 383.1 [-495.5-1261.8] 134 [75-238] 0.18 Zinc (mg) 0.6 [-9.5-10.8] 108 [49-235] 3.6 [-3.4-10.7] 132 [75-232] 0.36* Copper (mg) 0.4 [-2.8-3.6] 118 [39-356] 1.2 [-1.1-3.4] 146 [62-345] 0.27 Vitamins Vitamin A (µg) 508.3 [-1471.6-2488.2] 149 [39-563] 869.02 [-495.4-2233.4] 188 [77-455] -0.13 Vitamin B12 (µg) 0.08 [-7.4-7.6] 108 [31-374] 2.4 [-3.2-8.1] 158 [68-367] 0.07 Vitamin E (mg) - - 152 [51-454] - - 170 [72-404] 0.15 Vitamin B1 (mg) - - 121 [55-265] - - 137 [76-247] 0.35* Vitamin B2 (mg) 0.5 [-1.4-2.5] 128 [56-293] 0.7 [-1-2.4] 141 [72-276] 0.36* Vitamin C (mg) - - 187 [69-501] - - 193 [78-473] 0.36 Mean 129 150 0.21 *P <0.05
- indicates that data were not computed because of heteroscedasticity of the difference.
Results obtained from 29 female subjects based on bias and precision (Bland – Altman plots) and intra-class correlation coefficient (ICC).
Correlation [95% CI] Ranking
Daily nutrient intake Unadjusted Energy-adjusted Same tertile (%) Extreme tertile (%) ĸ [95% CI]Unadjusted Same tertile (%) Energy-adjustedExtreme tertile (%) ĸ [95% CI]
Energy (Kcal ) 0.14 34.5 17.2 0.02 M ac ro -n ut rie nt s [-0.24;0.48] [-0.25;0.28] Water (g) 0.47* 0.71* 41.4 3.4 0.12 65.5 0 0.48 [0.11;0.71] [0.45;0.85] [-0.16;0.39] [0.22;0.74] Protein (g) 0.18 0.29 48.3 17.2 0.22 41.4 17.2 0.12 [-0.20;0.51] [-0.09;0.59] [-0.05;0.50] [-0.15;0.39] Li pi ds Lipid (g) 0.29 0.47* 41.4 10.3 0.12 55.2 10.3 0.33 [-0.09;0.59] [0.11;0.71] [-0.15;0.39] [0.05;0.60] SFA (g) 0.25 0.34 31.03 13.8 -0.04 48.3 10.3 0.22 [-0.13;0.56] [-0.03-0.63] [-0.29;0.22] [-0.05;0.50] MUFA (g) 0.22 0.48* 37.9 13.8 0.07 51.7 13.8 0.28 [-0.16;0.54] [0.13;0.72] [-0.20;0.33] [0;0.55] PUFA (g) 0.4* 0.38* 44.8 13.8 0.17 48.3 10.3 0.22 [0.04;0.67] [0;0.65] [-0.10;0.45] [-0.05;0.50] Linoleic acid (g) 0.39* 0.33 51.7 6.9 0.28 48.3 10.3 0.22 [0.02;0.66] [-0.05;0.62] [0;0.55] [-0.05;0.50] Cholesterol (mg) 0.17 0.05 37.9 13.8 0.07 41.4 17.2 0.12 [-0.21;0.51] [-0.32;0.41] [-0.20;0.33] [-0.15;0.39] Carbohydrates Sugar (g) 0.16 0.67* 48.3 17.2 0.22 48.3 3.4 0.22 [-0.22;0.50] [0.40;0.83] [-0.05;0.50] [-0.05;0.50] Starch (g) 0.25 0.36 27.6 17.2 -0.09 34.5 10.3 0.02 [-0.14;0.56] [-0.02;0.64] [-0.34;0.16] [-0.25;0.28] Fiber (g) 0.11 0.45* 37.9 27.6 0.07 48.3 10.3 0.22 [-0.27;0.46] [0.09;0.69] [-0.20;0.33] [-0.05;0.50] M ic ro -n ut rie nt s M in er al s Calcium (mg) [0.26;0.78]0.58* [0.22;0.76]0.55* 55.2 10.3 [0.05;0.60]0.33 48.3 10.3 [-0.05;0.50]0.22 Iron (mg) 0.31 0.65* 34.5 10.3 0.02 69 3.4 0.53 [-0.07;0.60] [0.36;0.82] [-0.24;0.28] [0.28;0.79] Potassium (mg) [-0.08;0.60]0.3 [0.39;0.83]0.67* 44.8 13.8 [-0.10;0.44]0.17 48.3 3.4 [-0.05;0.50]0.22 Magnesium (mg) 0.33 0.42* 41.4 10.3 0.12 51.7 6.9 0.28 [-0.05;0.62] [0.05;0.68] [-0.15;0.39] [0;0.55] Sodium (mg) 0.18 0.64* 44.8 13.8 0.17 65.5 0 0.48 [-0.21;0.51] [0.35;0.81] [-0.10;0.44] [0.22;0.75] Phosphorus (mg) 0.31 0.51* 44.8 13.8 0.17 48.3 10.3 0.22 [-0.07;0.60] [0.17;0.74] [-0.10;0.45] [-0.05;0.50] Zinc (mg) 0.35 0.65* 41.4 10.3 0.12 62.1 3.4 0.43 [-0.02;0.63] [0.36;0.82] [-0.15;0.39] [0.16;0.70] Copper (mg) 0.34 0.49* 44.8 13.8 0.17 55.2 3.4 0.33 [-0.04;0.62] [0.14;0.72] [-0.10;0.44] [0.05;0.60] Vi ta m in s Vitamin A (µg) -0.1 0.02 31.03 27.6 -0.04 41.4 24.1 0.12 [-0.45;0.27] [-0.35;0.39] [-0.29;0.22] [-0.15;0.39] Vitamin B12 (µg) 0.33 0.24 51.8 13.8 0.28 41.4 17.2 0.12 [-0.05;0.61] [-0.14;0.56] [0;0.55] [-0.15;0.39] Vitamin E (mg) 0.25 0.28 44.8 13.8 0.17 31 13.8 -0.04 [-0.14;0.56] [-0.10;0.58] [-0.10;0.45] [-0.29;0.22] Vitamin B1 (mg) 0.46* 0.65* 58.6 6.9 0.38 48.3 3.4 0.22 [0.11;0.70] [0.36;0.82] [0.11;0.65] [-0.05;0.50] Vitamin B2 (mg) 0.54* 0.67* 62.07 10.3 0.43 55.2 3.4 0.33 [0.21;0.76] [0.39;0.83] [0.17;0.69] [0.05;0.60] Vitamin C (mg) [0.36;0.82]0.65* [0.42;0.84]0.69* 48.3 10.3 [-0.05;0.5]0.22 62.1 10.3 [0.17;0.69]0.43 Mean 0.3 0.47 43.5 13.5 0.15 50.4 9.1 0.25
SFA: saturated fatty acids; MUFA: mono-unsaturated fatty acids; PUFA: poly-unsaturated fatty acids; LOA: Limits of Agreement. *P <0.05, ĸ: Weighted Kappa coefficient
Unadjusted and energy-adjusted intakes obtained from 29 female subjects based on Spearman’s correlation coefficients and the cross-classification of data into 3-category food intake (low, medium and high). Percent of subjects with FFQ correct classifications and percent of subject with FFQ grossly misclassified (extreme category).
SFA: Saturated fatty acids; MUFA : Mono-unsaturated fatty acids; PUFA : Poly-unsaturated fatty acids.
the value 0 outside of the intervals. Most of the others non-significant correlations were also high but not significant because of the small sample size.
Table 3 also displays the results of the cross-classification of the nutrients into the 3-tertile categories and the corresponding weighted kappa coefficients; all measuring the discriminant ability of the FFQ to categorize individuals into broad nutrient intake categories. For unadjusted data, the correct classification rate ranged 28-62% (mean 43.5%) while on average 13.5% of the values were grossly misclassified (extreme categories); only 8/25 kappa coefficients were >0.20, corresponding to a fair agreement. For almost every nutrient, energy adjustment led to an increase of the capacity to categorizing individuals. For energy-adjusted data, 31-69% (mean 50.4%) of the values was correctly classified and the mean percentage of gross misclassifications decreased to 9.10%, while 19/25 kappa coefficients were above 0.20. Poor agreement was found for protein, cholesterol, starch, vitamins A, B12 and E with weighted kappa coefficients of less than 0.20. As with correlations, 95% CI of Kappa coefficients were quite large.
Discussion
For most nutrients, observed FFQ-derived nutrients were higher compared to those of the DR. This finding was already demonstrated in previous studies [13,21], particularly for FFQs exceeding 100 items [22], as was the case here. The bias between the two methods was acceptable with an average of overestimation by the FFQ of 11% for macronutrients and of 29% for micronutrients. However, the precision was much worse with discrepancies between the two methods of 46% for macronutrients and 50% for micronutrients. Globally, according to the intra-class correlation coefficients and the Bland-Altman plots, there was a “fair agreement” between the two methods.
The overestimation by the FFQ may reflect the fact that the DR underestimates many food groups [23]. It is likely that some food items on the FFQ may not have been consumed during the 3 days and this may contribute to the observed difference. The variations between the two instruments in terms of the method of data collection and the manner to transform the self-reported food items into nutrients may explain these dissimilarities in estimates. The higher consumption of fiber and vitamins estimated by the FFQ could be related to the suggested number of fruits and vegetables in the FFQ, providing thus more selection possibilities, compared to the DR. In fact, in the FFQ, 26 food items were used to describe the food groups, fruits and legumes, which could explain the relatively large difference in means (despite an acceptable agreement for ranking) for vitamin C intake. Another possible explanation for the large differences in average nutrients intakes between the compared methods is the estimation of portion sizes [24]. The FFQ with the help of a manual photos suggested predefined portion sizes, while in the DR the consumed amounts were quantified in an open-ended manner. The dispersion of recorded values for the FFQ is therefore rather low. Additionally, participants could meet difficulties in estimating portion sizes for some food groups. For instance, although plum, grape, cherry, nectarine, peach and apricot are all belong to the same food group; one portion of each may have quite different weight. Besides, the FFQ request the frequency and amount consumed of single food items. Therefore, it relies on the participant’s ability to quantify the consumption of a given item from single foods as well as from mixed dishes. In contrast, foods consumed as part of mixed dished were quantified separately in the DR method [24].
As already stated in similar studies by other researchers [25-27] we may consider the FFQ data as inappropriate to estimate absolute
levels of food intake, when considering the bias and low precision observed in this study. However, in the NESCAV study, our main concern was to classify individuals into different groups according to exposure levels rather than to assess their absolute nutrients intake. Indeed, for estimating relative risks between nutritional exposure and cardiovascular risk factor, the degree of misclassification of subjects is more important than the quantitative scale on which the ranking is made [28]. Therefore, correlations and weighted kappa were also computed. We found a mean correlation coefficient of 0.30 for unadjusted data and 0.47 for energy-adjusted data. The better correlation coefficients after adjustment for total energy clearly indicate that the variability of the nutrient intakes is related to energy intake. Except for protein and cholesterol, results were similar or better than the correlations found in comparable studies [13,21,29]. Some studies which used 7-day dietary records obtained better or similar correlation coefficients [13,30] and those which used 3-day dietary records obtained lower or similar results [31]. Although, the validation of the original Canadian version of the FFQ [9] showed good correlation coefficients for protein (r=0.75) and cholesterol (r=0.74), correlations obtained from the modified FFQ were not significant.
Concerning results on cross-classification into tertiles, we observed that FFQ performed well. After energy adjustment, 19/25 nutrients obtained a weighted kappa coefficient above 0.20 and the average correct classification rate was about 50%. These percentages of agreement were comparable to those of previous studies which compared their FFQ with four 3-day dietary records [29] confirming that the FFQ we used may be useful in ranking.
Although observed correlations and kappa between FFQ-derived intakes and the DR were good, they are likely to be underestimates of the correlations between the FFQ and real intake. It is probable that the DR for 3 days was not as representative of long-term dietary habits as we expected; the inclusion of more days of records would have possibly improved these results. According to the literature [32], 3 days of recordings were reasonable because declining accuracy of recording with increasing fatigue and boredom have been noticed with longer records. However, a higher number of record days, spread over the whole year would have been more optimal as reference method, since this could take into account seasonal variation as well [31].
The main strength of this validation study was the selection of the most used DR as a reference method which is considered as ‘gold standard’ among dietary assessment methods [33], because it has fewer correlation errors compared with other reference methods [6]. This has been attributed to the fact that both methods employ different approaches to evaluate dietary intakes. The DR does not rely on memory, is constituted of open-ended questions and involves direct estimation of portion size [34]. Therefore, by validating our FFQ against DR, the possibility of an improved correlation due to similar source of error is reduced.
However, the study has several drawbacks. Firstly, we did not address specifically the issue of repeatability. In general, the reproducibility of FFQs is assessed by self-administration at two points in time to the same group of people. Since all studies assessing FFQ’s reproducibility showed very good results, we think that this feature of FFQ is already well-known. Moreover, it was already examined for the Quebec’s version which concluded its reliability [9]. Additionally, according to Altman [20], a method with poor repeatability will never agree well with another method. Therefore, in view of the good results obtained concerning the agreement between FFQ and DR, it would be very unlikely to have a FFQ with poor repeatability and such a good agreement with DR.
Secondly, our study is constituted only of 29 female participants, which may limit the final conclusion. Generally, the suggested sample size for an FFQ validation study is varied between 50 to 100 individuals [19], although other researchers have used similar number of participants to the present study, and produced promising results. Moreover, power calculation showed that a minimum of 29 subjects would be needed to give 80% power to detect correlation between FFQ and DR of 0.45 as significant at the 5% level. Additionally, in order to take into account the small sample size, non-parametric methods (Spearman’s rank correlation, Wilcoxon signed-rank test) were used. In summary, despite of the small sample size, most of the observed associations were high and statistically significant. We have, however, calculated 95% confidence intervals for all computed statistics. Another drawback of the validation sample is that the characteristics of participants in the validation study (only females of moderate education level) were not perfectly comparable to those of the population.
Finally, like any dietary assessment methodology, DR is also prone to a degree of misreporting, in particular to item-specific underreporting or over reporting. This could lead to artificially high correlation coefficients between the DR and the FFQ. Nutritional biomarkers have been recently used for validation purposes, as an alternative to self-reported methods of dietary intake, having the advantages of being objective, unbiased and theirs errors are uncorrelated to the errors of FFQ. As blood and urine samples were collected for most of the subjects in the NESCAV study, correlations of nutrient intakes from the FFQ and their biochemical measures are tested and the results will be published in a forthcoming report, to support the present findings.
Then, we will assess associations between dietary habits and cardiovascular risk factors. Since the traditional single-nutrient approach is not really appropriate to describe the complexity of the human diet and the high level of intercorrelation among various food and nutrients, overall dietary patterns will be studied [35]. Dietary patterns consider how foods and nutrients are consumed in combinations and therefore represent more closely the real world. We will use both ‘a priori‘methods which are based on the use of dietary score that assess compliance with prevailing dietary guidelines and ‘a posteriori’ method which are dimension-reduction technique applied to the data.
Conclusion
The aim of this study was to evaluate the performance of a 134-item FFQ to be used in the NESCAV study. Validity was assessed by comparing estimates from FFQ with those derived from the mean of 3-day DR. Globally, considering the results presented in this study, estimates of absolute values of dietary intakes may not be accurate. However, regarding several favorable elements, such as good correlations and ranking, along with the previous validation of the original Canadian version and the similarities with others validation studies, we can conclude that our questionnaire is a reasonable tool to categorize subjects into broad ranges of dietary intakes. Nevertheless, the results on protein, cholesterol, starch, vitamin A, E and B12 should be interpreted with caution. In the light of these results and the advantage of being cost effective and quickly administered, we believe that the FFQ is a good tool to evaluate dietary patterns in people living in the Greater region. The future validation study against nutritional biomarkers should reinforce the validity of this modified FFQ. Acknowledgements
The present study was supported by a research grant from the National Fund of Research (Fond National de Recherche; project MSF, 784844, BM).
Author’s Contribution
MG, A Albert were involved in the conception and design of the validation study; NS performed the statistical data analyses, NS and AA drafted the manuscript. MG coordinated the field data collection, A Albert contributed to the drafting and critical revision of the manuscript. All of the authors reviewed drafts and approved the final version of the manuscript.
References
1. Parkin DM (2011) 1. The fraction of cancer attributable to lifestyle and environmental factors in the UK in 2010. Br J Cancer 105: S2-S5.
2. Srinath Reddy K, Katan MB (2004) Diet, nutrition and the prevention of hypertension and cardiovascular diseases. Public Health Nutr 7: 167-186. 3. (1990) Diet, nutrition, and the prevention of chronic diseases. Report of a WHO
Study Group. World Health Organ Tech Rep Ser 797: 1-204.
4. Hu FB (2002) Dietary pattern analysis: a new direction in nutritional epidemiology. Curr Opin Lipidol 13: 3-9.
5. Alkerwi A, Guillaume M, Zannad F, Laufs U, Lair ML, et al. (2010) Nutrition, environment and cardiovascular health (NESCAV): protocol of an inter-regional cross-sectional study. BMC Public Health 10: 698.
6. Byers T, Lyle B (1999) The role of epidemiology in determining when evidence is sufficient to support nutrition recommendations. Summary statement. Am J Clin Nutr 69: 1365S-1367S.
7. Cade J, Thompson R, Burley V, Warm D (2002) Development, validation and utilisation of food-frequency questionnaires - a review. Public health nutrition 5: 567-587.
8. Paul DR, Rhodes DG, Kramer M, Baer DJ, Rumpler WV (2005) Validation of a food frequency questionnaire by direct measurement of habitual ad libitum food intake. Am J Epidemiol 162: 806-814.
9. Shatenstein B, Nadon S, Godin C, Ferland G (2005) Development and validation of a food frequency questionnaire. Canadian journal of dietetic practice and research.
10. Masson LF, McNeill G, Tomany JO, Simpson JA, Peace HS, et al. (2003) Statistical approaches for assessing the relative validity of a food-frequency questionnaire: use of correlation coefficients and the kappa statistic. Public Health Nutr 6: 313-321.
11. Feskanich D, Rimm EB, Giovannucci EL, Colditz GA, Stampfer MJ, et al. (1993) Reproducibility and validity of food intake measurements from a semiquantitative food frequency questionnaire. J Am Diet Assoc 93: 790-796. 12. Erkkola M, Karppinen M, Javanainen J, Räsänen L, Knip M, et al. (2001)
Validity and reproducibility of a food frequency questionnaire for pregnant Finnish women. Am J Epidemiol 154: 466-476.
13. Brunner E, Stallone D, Juneja M, Bingham S, Marmot M (2001) Dietary assessment in Whitehall II: comparison of 7 d diet diary and food-frequency questionnaire and validity against biomarkers. Br J Nutr 86: 405-414. 14. Hercberg S, Galan P, Preziosi P, Roussel AM, Arnaud J, et al. (1998)
Background and rationale behind the SU.VI.MAX Study, a prevention trial using nutritional doses of a combination of antioxidant vitamins and minerals to reduce cardiovascular diseases and cancers. SUpplementation en VItamines et Minéraux AntioXydants Study. Int J Vitam Nutr Res 68: 3-20.
15. Hercberg S (2006) [The SU.VI.MAX study, a randomized, placebo-controlled trial on the effects of antioxidant vitamins and minerals on health]. Ann Pharm Fr 64: 397-401.
16. Anand SS, Yusuf S, Vuksan V, Devanesen S, Montague P, et al. (1998) The Study of Health Assessment and Risk in Ethnic groups (SHARE): rationale and design. The SHARE Investigators. Can J Cardiol 14: 1349-1357.
17. Bland JM, Altman DG (1999) Measuring agreement in method comparison studies. Stat Methods Med Res 8: 135-160.
18. Willett W, Stampfer MJ (1986) Total energy intake: implications for epidemiologic analyses. Am J Epidemiol 124: 17-27.
19. Cade JE, Burley VJ, Warm DL, Thompson RL, Margetts BM (2004) Food-frequency questionnaires: a review of their design, validation and utilisation. Nutr Res Rev 17: 5-22.
20. Altman DG (1991) Practical Statistics For Medical Research. Chapman and Hall.
21. Eng JY, Moy FM (2011) Validation of a food frequency questionnaire to assess dietary cholesterol, total fat and different types of fat intakes among Malay adults. Asia Pac J Clin Nutr 20: 639-645.
22. Klipstein-Grobusch K, den Breeijen JH, Goldbohm RA, Geleijnse JM, Hofman A, et al. (1998) Dietary assessment in the elderly: validation of a semiquantitative food frequency questionnaire. Eur J Clin Nutr 52: 588-596.
23. Kaczkowski CH, Jones PJ, Feng J, Bayley HS (2000) Four-day multimedia diet records underestimate energy needs in middle-aged and elderly women as determined by doubly-labeled water. J Nutr 130: 802-805.
24. Haftenberger M, Heuer T, Heidemann C, Kube F, Krems C, et al. (2010) Relative validation of a food frequency questionnaire for national health and nutrition monitoring. Nutr J 9: 36.
25. Briefel RR, Flegal KM, Winn DM, Loria CM, Johnson CL, et al. (1992) Assessing the nation’s diet: limitations of the food frequency questionnaire. J Am Diet Assoc 92: 959-962.
26. Rimm EB, Giovannucci EL, Stampfer MJ, Colditz GA, Litin LB, et al. (1992) Reproducibility and validity of an expanded self-administered semiquantitative food frequency questionnaire among male health professionals. Am J Epidemiol 135: 1114-1126.
27. Block G, Subar AF (1992) Estimates of nutrient intake from a food frequency questionnaire: the 1987 National Health Interview Survey. J Am Diet Assoc 92: 969-977.
28. Freedman LS, Schatzkin A, Wax Y (1990) The impact of dietary measurement error on planning sample size required in a cohort study. Am J Epidemiol 132: 1185-1195.
29. Fernández-Ballart JD, Piñol JL, Zazpe I, Corella D, Carrasco P, et al. (2010) Relative validity of a semi-quantitative food-frequency questionnaire in an elderly Mediterranean population of Spain. Br J Nutr 103: 1808-1816. 30. Chen Y, Ahsan H, Parvez F, Howe GR (2004) Validity of a food-frequency
questionnaire for a large prospective cohort study in Bangladesh. Br J Nutr 92: 851-859.
31. Ahn Y, Kwon E, Shim JE, Park MK, Joo Y, et al. (2007) Validation and reproducibility of food frequency questionnaire for Korean genome epidemiologic study. Eur J Clin Nutr 61: 1435-1441.
32. Huybrechts I, De Backer G, De Bacquer D, Maes L, De Henauw S (2009) Relative validity and reproducibility of a food-frequency questionnaire for estimating food intakes among Flemish preschoolers. Int J Environ Res Public Health 6: 382-399.
33. Livingstone MB, Prentice AM, Strain JJ, Coward WA, Black AE, et al. (1990) Accuracy of weighed dietary records in studies of diet and health. BMJ 300: 708-712.
34. Bolca S, Huybrechts I, Verschraegen M, De Henauw S, Van de Wiele T (2009) Validity and reproducibility of a self-administered semi-quantitative food-frequency questionnaire for estimating usual daily fat, fibre, alcohol, caffeine and theobromine intakes among Belgian post-menopausal women. Int J Environ Res Public Health 6: 121-150.
35. Newby PK, Muller D, Hallfrisch J, Qiao N, Andres R, et al. (2003) Dietary patterns and changes in body mass index and waist circumference in adults. Am J Clin Nutr 77: 1417-1425.
Citation: Sauvageot N, Alkerwi A, Adelin A, Guillaume M (2013) Validation of the Food Frequency Questionnaire Used to Assess the Association between Dietary Habits and Cardiovascular Risk Factors in the NESCAV Study. J Nutr Food Sci 3: 208. doi:10.4172/2155-9600.1000208
Submit your next manuscript and get advantages of OMICS Group submissions Unique features: • User friendly/feasible website-translation of your paper to 50 world’s leading languages • Audio Version of published paper • Digital articles to share and explore Special features: • 250 Open Access Journals • 20,000 editorial team • 21 days rapid review process • Quality and quick editorial, review and publication processing • Indexing at PubMed (partial), Scopus, EBSCO, Index Copernicus and Google Scholar etc • Sharing Option: Social Networking Enabled • Authors, Reviewers and Editors rewarded with online Scientific Credits • Better discount for your subsequent articles Submit your manuscript at: http://www.editorialmanager.com/lifesciences