Felicity Thomas,* Christopher G. Pretty,* Matthew Signal,* J. Geoffrey Chase*
* Department of Mechanical Engineering, University of Canterbury, Christchurch, New Zealand (e-mail: [email protected])
Abstract:Continuous glucose monitoring (CGM) devices, with their 1-5 minute measurement interval, allow blood glucose dynamics to be captured more frequently and less invasively than traditional measures of blood glucose concentration (BG). These devices are primarily designed for the use in type 1 and type 2 diabetic patients to aid BG regulation. However, because of their increased measurement frequency and reduced invasiveness CGM devices have been recently applied to other subject cohorts, such as intensive care patients and neonates. One unexamined cohort is athletes. Continuous monitoring of an athlete’s BG has the potential to increase race performance, speed recovery, and aid training, as BG can reflect metabolic and inflammatory conditions. However, before these benefits can be realized the accuracy and performance of CGM devices in active athletes must be evaluated.
Two Ipro2 CGM devices (Medtronic Minimed, Northridge, CA, USA) were inserted into an athlete (resting HR 50 beats per minute (bpm), training 10-17hrs per week). Two fasting exercise tests were carried out 3 days apart, involving 2 hours of continuous exercise and a glucose bolus at the end of the 2 hours. Reference BG measurements were taken regularly. These tests were then repeated while the athlete was sedentary, HR < 80bmp. CGM devices agree well with each other and reference measurements during rigorous exercise with a median [IQR] MARD of 7.3 [5.4 – 10.9] %. During sedentary periods the accuracy of the CGM trace compared to reference measurements was reduced, 25.1 [16.9 35.4] %. However the good agreement between the sensors is maintained. This decrease in accuracy is likely related to the fact interstitial fluid is not actively pumped like blood. It relies on muscle movement to circulate and mix. Thus, it can be expected that during exercise more accurate results are seen as the rigorous movement allows rapid mixing and equilibrium between the blood and interstitial fluid.
1. INTRODUCTION
Continuous glucose monitoring (CGM) devices, with their 1-5 minute measurement interval, allow blood glucose concentration (BG) dynamics to be captured more frequently and less invasively than traditional measures of BG. CGM devices typically consist of a small pager-like monitoring device that receives a signal from a sensor inserted into the subcutaneous layer. The sensor creates a signal using the glucose oxidase reaction and produces a current which is proportional to the glucose concentration in the interstitial fluid. Calibration algorithms convert the signal into a BG by comparing it to known calibration BG measurements, which are entered into the monitor by the user every ~6-8hrs. These devices are primarily designed for the use in type 1 and type 2 diabetic patients to aid BG regulation and are well studied in this cohort (Gandhi et al., 2011, Hoeks et al., 2011). However, because of the increased measurement frequency and reduced invasiveness they have recently been applied to other cohorts, such as intensive care patients and neonates with varying success (Chee et al., 2003, Holzinger et al., 2010, Brunner et al., 2011, Rabiee et al., 2009, Signal, 2013, Signal et al., 2010, Beardsall et al., 2005, Harris et al., 2010). One unexamined cohort is athletes. Optimisation of an athlete’s BG has the potential to increase race performance,
speed recovery, and aid training (Jeukendrup, 2004, Achten et al., 2004, Koopman et al., 2004, Halson et al., 2004, Brown, 2002). However, before these benefits can be realised, the accuracy and performance of CGM devices in active athletes must be evaluated. Hence, this paper compares the accuracy and performance of CGM in an athlete while exercising and sedentary.
2. SUBJECTS & METHODS
2.1 Subjects and Experiments
Two Ipro2 CGM devices (Medtronic Minimed, Northridge, CA, USA) were inserted into the abdomen of an athlete (Female, 23yrs, BMI 21kg/m2, resting HR 50 beats per minute
(bpm), training 10-17hr per week) at least a day prior to the first ‘fasting exercise test’.
During the 5 days of CGM:
• Blood glucose was measured 4 times a day prior to meals and sleeping. These measurements were used to calibrate the device (calibration BGs)
• All meals were recorded and carbohydrate intake monitored.
• Any additional exercise was also recorded and energy expended estimated
Two fasting exercise tests were carried out 3 days apart: • 0-60min: Cycling on a stationary trainer after
overnight fasting in the submaximal endurance HR zone (130-140bpm)
• 60-120min: Steadily increase HR until exhaustion (190bpm)
• 120min: Consume a 1g/kg of body weight(60g) glucose drink
• The athlete was required to take a rest day prior to the first fasting test.
Reference BG measurements were taken:
• Every 10min during the 2hrs of exercising,
• every 5min for 30 minutes after the glucose solution was ingested
• One final measurement was taken 40min after the glucose solution was ingested
Reference measurements were not used for calibration. At a later date, two Ipro2 CGM devices were inserted into the same athlete the day prior to the first ‘fasting sedentary test’. The same procedure was followed during the 6 days of CGM and during the tests except the athlete remained sedentary for the same 120min period of regular reference blood glucose measurements. A glucose solution of 60g was consumed at 120min, and further BG measures made as per the exercise tests. The athletes HR during this time was >80bpm.
Reference and calibration BG measurements were taken using capillary finger stick measurements and the Abbott Optimum Xceed (Abbott Diabetes Care, Alameda, CA) glucometer. The Abbott device has reported error of 5-10% (Abbott, 2010, Thomas et al., 2014b, Thomas et al., 2014a, Signal, 2013). For both tests the same CGM devices were used and inserted in to the left side of the abdomen. These devices are referred to as sensor 1, the lower left abdomen sensor, and sensor 2, the upper left abdomen sensor.
2.2 Analysis
To assess the accuracy of the CGM during exercise the mean absolute relative difference (MARD) was calculated between reference BG measurements collected during the fasting tests and the CGM trace:
𝑀𝐴𝑅𝐷 = 𝑚𝑒𝑎𝑛(𝑎𝑏𝑠 (𝐶𝐺𝑀−𝐵𝐺
𝐵𝐺 )) ∗ 100 Eq 1.
MARDs were assessed during the exercise or sedentary phase only, and including the glucose bolus subsequent to these phases. This consideration of different phases allowed an assessment of accuracy when glucose levels were rapidly changing, after the glucose bolus, and when they are relatively stable, during exercise or while sedentary. The sedentary and exercise test thus provide equivalent samples in two distinct states.
The offset of the CGM trace compared to the reference BG measurements was also analysed for these different phases. This offset was calculated:
𝑂𝑓𝑓𝑠𝑒𝑡 = 𝐶𝐺𝑀 − 𝐵𝐺 Eq 2.
Where, a positive offset means the CGM reading was higher than the reference BG.
It was also noted that while the sensor current (ISIG) captured by the two different CGM devices were very similar (panel A of Figure 1) there was some discrepancy between the BG traces produced by the factory calibration algorithm (panel B of Figure 1). Therefore, an alternative recalibration method was employed (panel C of Figure 1) (Signal et al., 2012). The recalibration algorithm forces the output CGM trace to pass through the calibration BG measurements, while preserving the raw sensor current. At each calibration measurement a value of slope is calculated. Linear interpolation of the required slope gives the new, continuous slope function. This slope is used with the unmodified ISIG to generate the recalibrated BG trace. The recalibration provides a comparator to assess the impact of the factory calibration, which is not specifically designed for athletes, on outcome CGM traces.
3. RESULTS & DISCUSSION
The results in Figure 1, Figure 3 and Table 1 clearly show CGM devices are accurate during intense exercise. The MARD values in Table 1 are equivalent if not better than the performance reported for CGM in diabetic subjects (Keenan et al., 2012, Kovatchev et al., 2008, Bailey et al., 2014, Matuleviciene et al., 2014, Calhoun et al., 2013). Bailey et al. reported an overall MARD of 13.6% from a study using the same sensors in 90 type 1 diabetic subjects. All of the recalibrated MARD values are below this value with a range of 6.6-12.9%, and only two of the factory calibrated MARD values are above with a range of 8.6-17.9%.
The recalibration algorithm improves performance with the median MARD of the recalibrated trace being 8.7% during exercise and the following glucose bolus compared to 11.4% for the factory calibrated CGM trace. The recalibration allows the CGM signal to better capture the fast changing glucose dynamics induced with the glucose bolus consumed at 120min, as seen in Figure 3.
Most athletes are highly motivated individuals with a high attention to detail and procedure. However, a number of the diabetic individuals this CGM device is designed for may not have the same motivation for monitoring BG and will be relying on infrequent and poorer quality BG measurements. Hence, the factory calibration algorithm weights each BG value differently based on how accurate it assesses the BG measurement to be. This weighting leads to the discrepancies between the two signals seen in Figure 1 at 1000, 5000 and 6000 minutes, where the algorithm has treated the calibration BGs differently for each sensor.
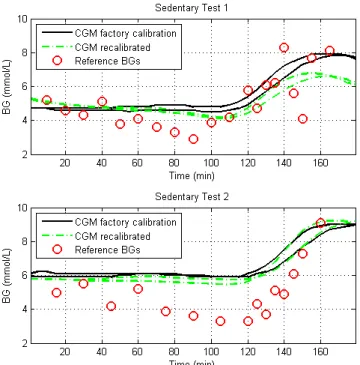
The overall performance of the CGM devices during the sedentary test in Figure 2 is also very good. Both sensor current and output CGM trace from the two sensors agree well. However, the performance during the sedentary tests alone
was not as accurate as during the exercise tests. In Figure 4, there is a noticeable offset between the reference measurements and the sensor output. This difference is also highlighted in Table 2 where the median offset is up to 1.9mmol/L during the second test.
Comparing the recalibrated results, as they provided the most accurate results, the Median [IQR] MARD during exercise test and glucose was 8.7 [7.2 – 12.2] % compared to 26.4 [17.6 35.2] % during the sedentary test. These results only improve by ~1% when the glucose bolus period was removed from the analysis to 7.3 [5.4 – 10.9] % and 25.1 [16.9 35.4] % respectively. Thus, the CGM signals were both able to track the fast changing glucose dynamics nearly accurately as they were the relatively constant BG during the exercise or sedentary phase. Hence, the difference between the two tests is due to other factors.
The large discrepancy seen between the accuracy of the devices while exercising compared to being sedentary is attributed to two main factors. First, the reference measurements may have been biased during the sedentary test. During this test the apparent skin temperature was noticeably lower than in the exercise tests and it was more difficult to extract blood from the finger tips indicating reduced circulation(Thorsson et al., 1985, Gregson et al., 2011). There is evidence to suggest lower skin temperatures lead to BG meters reading lower than expected values (Haupt et al., 2005, King et al., 1995). Second, interstitial fluid is not actively pumped like blood. It relies on muscle movement to circulate and mix. Thus, it can be expected that during exercise more accurate results are seen as the rigorous movement allows rapid mixing and equilibrium between the blood and interstitial fluid as well as more accurate reference BG measurements due to high skin temperatures and increased circulation.
There is a consistent positive bias evident in Table 2, whether it be exercising or sedentary, or when applying the recalibration algorithm or the factory algorithm. While it changes in size depending on the accuracy of the signal, the consistently positive offset would suggest that the CGM is likely to be reading higher that the BG actual is. This could have important implications for athletes using these devices as if they were using the CGM device and the factory algorithm to guide nutrition during exercise. The CGM value could be between 0.4 – 0.8mmol/L higher than their measured BG. Finger stick measurements may also contribute to this bias if they are in accurate. Future studies with larger cohorts will help better quantify this bias and the causes of it. Then, if necessary, a factor could be applied in calibration to remove its influence.
Figure 1: Exercise Test: Sensor current generated by each sensor during the 5 days of CGM that the fasting exercise tests were conducted during, (A), the CGM signal produced by using the factory calibration, (B), the CGM signal produced when the recalibration algorithm was applied (C).
0 1000 2000 3000 4000 5000 6000 7000 2 4 6 8 10 12 Factory Algorithm B G ( m m o l/ L ) Time (min) 0 1000 2000 3000 4000 5000 6000 7000 0 10 20 30 40 ISIG Data Time (min) C u rr e n t (n A ) 0 1000 2000 3000 4000 5000 6000 7000 2 4 6 8 10 12 Recalibrated B G ( m m o l/ L ) Time (min) CGM data Sensor 1 CGM data Sensor 2 Calibration BG ISIG Sensor 1 ISIG Sensor 2 CGM data Sensor 1 CGM data Sensor 2 Calibration BG
A
B
C
Exercise tests
Exercise tests
Figure 2: Sedentary Test: Sensor current generated by each sensor during the 6 days of CGM that the sedentary tests were conducted during, (A), the CGM signal produced by using the factory calibration, (B),the CGM signal produced when the recalibration algorithm was applied (C).
Figure 3: CGM data and the recalibrated trace for each exercise test and the reference BG measurements taken.
Table 1: MARDs from tests, including and excluding the glucose bolus and comparing the recalibration data and the original CGM algorithm. The recalibration algorithm has lower MARDs for both during exercise and when glucose levels a rapidly changing post exercise.
0 2000 4000 6000 8000 2 4 6 8 10 12 Factory Algorithm B G ( m m o l/ L ) Time (min) 0 2000 4000 6000 8000 0 10 20 30 40 ISIG Data C u rr e n t (n A ) Time (min) 0 2000 4000 6000 8000 2 4 6 8 10 12 Recalibrated B G ( m m o l/ L ) Time (min) CGM data Sensor 1 CGM data Sensor 2 Calibration BG ISIG Sensor 1 ISIG Sensor 2 CGM data Sensor 1 CGM data Sensor 2 Calibration BG
Sensor 1 Sensor 2 Sensor 1 Sensor 2
MARD (%) exercise + glucose bolus 7.07 10.1 7.37 12.9 8.74 [7.15 12.2] MARD (%) exercise Only 6.64 8 5.01 11.8 7.32 [5.42 10.9] MARD (%) exercise + glucose bolus 8.55 12.6 10.1 16.9 11.4 [8.9 15.8] MARD (%) exercise Only 8.73 12.9 8.67 17.9 10.8 [8.69 16.7]
Sensor 1 Sensor 2 Sensor 1 Sensor 2
MARD (%) exercise + glucose bolus 18.6 17.8 35.9 34.9 26.4 [17.6 35.2] MARD (%) exercise Only 18.1 16.9 37.3 41.5 25.1 [16.9 35.4] MARD (%) exercise + glucose bolus 22.4 18.8 40.8 37.6 30 [21.5 38.4] MARD (%) exercise Only 21.6 18.8 43 44.8 32.3 [20.9 43.5] R e ca li b ra te d A lg o ri th m
Sedentary Fasting Test 1 Sedentary Fasting Test 2
MEDIAN [IQR] R e ca li b ra te d A lg o ri th m
Exercise Fasting Test 1 Exercise Fasting Test 2
A
B
C
Sedentary tests
Figure 4: CGM data and the recalibrated trace for each sedentary test and the reference BG measurements taken.
Table 2: Offsets from tests, including and excluding the glucose bolus calculated as per Eq 2. CGM trace is consistently higher than the reference blood glucose measurements especially while sedentary.
3.1 Limitations
The recalibration method used was designed for use with blood gas analyser (BGA) measurements. BGA’s are accurate to within 2% are considered the ‘gold standard’ for hospital BG measurements. The reference and calibration measurement for this study were recorded on an Abbott Optimum Xcceed with reported a reported error range of 5-10% (Abbott, 2010, Signal, 2013, Thomas et al., 2014a, Thomas et al., 2014b), as mentioned earlier. Hence, forcing the CGM trace through these less precise measurements may induce additional error in to the recalibrated trace. However, the improvement seen from recalibration with the better agreement of the two signals and improved MARD justifies this additional error. The details of the manufacture algorithms are not fully disclosed. Therefore it was not possible to use one directly in this study and optimise it for athletes.
This study is a proof of concept demonstration. The small data set is a limitation of this study. These tests were only trialled in one athlete and results are likely to vary between individuals. However, there is a clear difference in signal quality between exercising and sedentary cases. These differences also provide insight into how these devices might be more optimally used in the target, more sedentary cohort. Finally, the results justify investment in further, ongoing tests in athletic subjects.
4. CONCLUSION
Optimisation of an athlete’s BG has the potential to increase race performance, speed recovery and aid training. CGM devices agree well with each other and reference measurements during rigorous exercise with a MARD of 10.8 [8.7 – 16.7] % median [IQR]. However, a different calibration algorithm to that provided by the manufacture maybe more suited to this cohort, 7.3 [5.4 – 10.9] %. During sedentary periods the accuracy of the monitors was reduced, 25.1 [16.9 35.4] %, however the good agreement between the sensors is maintained. This decrease in accuracy is likely related to the fact interstitial fluid is not actively pumped like blood. It relies on muscle movement to circulate and mix. Thus, it can be expected that during exercise more accurate results are seen as the rigorous movement allows rapid mixing and equilibrium between the blood and interstitial fluid.
REFERENCES
Abbott 2010. Abbott Optium Test-Strip Packet Insert. UK Abbott Diabetes Care Ltd
Achten, J., Halson, S. L., Moseley, L., Rayson, M. P., Casey, A., et al. (2004). Higher dietary carbohydrate content during intensified running training results in better maintenance of performance and mood state. J Appl
Physiol (1985), 96, 4, 1331-40.
Bailey, T. S., Ahmann, A., Brazg, R., Christiansen, M., Garg, S., et al. (2014). Accuracy and acceptability of the 6-day
Sensor 1 Sensor 2 Sensor 1 Sensor 2
Offset exercise + glucose bolus 0.3 [0.1 0.4] -0.1 [-0.7 0.4] 0.03 [-0.1 0.3] 0.2 [-0.6 0.5] Offset exercise Only 0.3 [-0.002 0.3] 0.3 [-0.1 0.4] 0.2 [-0.05 0.3] 0.5 [0.2 0.7] Offset exercise + glucose bolus 0.4 [0.2 0.5] 0.7 [0.5 0.8] 0.4 [0.1 0.5] 0.7 [-0.3 1.0] Offset exercise Only 0.4 [0.2 0.5] 0.6 [0.5 0.7] 0.4 [0.2 0.5] 0.8 [0.7 1.0]
Sensor 1 Sensor 2 Sensor 1 Sensor 2
Offset exercise + glucose bolus 0.3 [-0.4 1.0] 0.3 [-0.8 0.8] 1.7 [0.9 2.1] 1.6 [0.7 2.1] Offset exercise Only 0.4 [-0.05 1.0] 0.4 [-0.1 0.9] 1.6 [0.6 2.1] 1.8 [0.7 2.3] Offset exercise + glucose bolus 0.7 [-0.03 1.2] 0.4 [-0.3 0.9] 1.9 [1.0 2.5] 1.7 [0.9 2.3] Offset exercise Only 0.7 [-0.4 1.1] 0.5 [-0.3 0.9] 1.9 [0.8 2.5] 1.9 [0.9 2.5]
Exercise Fasting Test 2 Exercise Fasting Test 1
R e ca li br at e d A lg o ri thm
Sedentary Fasting Test 1 Sedentary Fasting Test 2
R e ca li br at e d A lg o ri thm
Enlite continuous subcutaneous glucose sensor. Diabetes
Technol Ther, 16, 5, 277-83.
Beardsall, K., Ogilvy-Stuart, A. L., Ahluwalia, J., Thompson, M. & Dunger, D. B. (2005). The continuous glucose monitoring sensor in neonatal intensive care. Archives of
Disease in Childhood-Fetal and Neonatal Edition, 90, 4,
F307-F310.
Brown, R. C. (2002). Nutrition for optimal performance during exercise: carbohydrate and fat. Curr Sports Med Rep, 1, 4, 222-9.
Brunner, R., Kitzberger, R., Miehsler, W., Herkner, H., Madl, C., et al. (2011). Accuracy and reliability of a subcutaneous continuous glucose-monitoring system in critically ill patients. Critical Care Medicine, 39, 4, 659-664.
Calhoun, P., Lum, J., Beck, R. W. & Kollman, C. (2013). Performance comparison of the medtronic sof-sensor and enlite glucose sensors in inpatient studies of individuals with type 1 diabetes. Diabetes Technol Ther, 15, 9, 758-61.
Chee, F., Fernando, T. & Van Heerden, P. V. (2003). Closed-loop glucose control in critically ill patients using continuous glucose monitoring system (CGMS) in real time. IEEE Trans Inf Technol Biomed, 7, 1, 43-53. Gandhi, G. Y., Kovalaske, M., Kudva, Y., Walsh, K., Elamin,
M. B., et al. (2011). Efficacy of continuous glucose monitoring in improving glycemic control and reducing hypoglycemia: a systematic review and meta-analysis of randomized trials. J Diabetes Sci Technol, 5, 4, 952-65. Gregson, W., Black, M. A., Jones, H., Milson, J., Morton, J.,
et al. (2011). Influence of cold water immersion on limb and cutaneous blood flow at rest. Am J Sports Med, 39, 6, 1316-23.
Halson, S. L., Lancaster, G. I., Achten, J., Gleeson, M. & Jeukendrup, A. E. (2004). Effects of carbohydrate supplementation on performance and carbohydrate oxidation after intensified cycling training. J Appl Physiol
(1985), 97, 4, 1245-53.
Harris, D. L., Battin, M. R., Weston, P. J. & Harding, J. E. (2010). Continuous Glucose Monitoring in Newborn Babies at Risk of Hypoglycemia. Journal of Pediatrics, 157, 2, 198-202.
Haupt, A., Berg, B., Paschen, P., Dreyer, M., Haring, H. U., et al. (2005). The effects of skin temperature and testing site on blood glucose measurements taken by a modern blood glucose monitoring device. Diabetes Technol Ther, 7, 4, 597-601.
Hoeks, L. B., Greven, W. L. & De Valk, H. W. (2011). Real-time continuous glucose monitoring system for treatment of diabetes: a systematic review. Diabet Med, 28, 4, 386-94.
Holzinger, U., Warszawska, J., Kitzberger, R., Wewalka, M., Miehsler, W., et al. (2010). Real-time continuous glucose monitoring in critically ill patients: a prospective randomized trial. Diabetes Care, 33, 3, 467-72.
Jeukendrup, A. E. (2004). Carbohydrate intake during exercise and performance. Nutrition, 20, 7-8, 669-77.
Keenan, D. B., Mastrototaro, J. J., Zisser, H., Cooper, K. A., Raghavendhar, G., et al. (2012). Accuracy of the Enlite
6-day glucose sensor with guardian and Veo calibration algorithms. Diabetes Technol Ther, 14, 3, 225-31. King, J. M., Eigenmann, C. A. & Colagiuri, S. (1995). Effect
of ambient temperature and humidity on performance of blood glucose meters. Diabet Med, 12, 4, 337-40. Koopman, R., Pannemans, D. L., Jeukendrup, A. E., Gijsen,
A. P., Senden, J. M., et al. (2004). Combined ingestion of protein and carbohydrate improves protein balance during ultra-endurance exercise. Am J Physiol Endocrinol Metab, 287, 4, E712-20.
Kovatchev, B., Anderson, S., Heinemann, L. & Clarke, W. (2008). Comparison of the numerical and clinical accuracy of four continuous glucose monitors. Diabetes
Care, 31, 6, 1160-4.
Matuleviciene, V., Joseph, J. I., Andelin, M., Hirsch, I. B., Attvall, S., et al. (2014). A clinical trial of the accuracy and treatment experience of the Dexcom G4 sensor (Dexcom G4 system) and Enlite sensor (guardian REAL-time system) tested simultaneously in ambulatory patients with type 1 diabetes. Diabetes Technol Ther, 16, 11, 759-67.
Rabiee, A., Andreasik, V., Abu-Hamdah, R., Galiatsatos, P., Khouri, Z., et al. (2009). Numerical and clinical accuracy of a continuous glucose monitoring system during intravenous insulin therapy in the surgical and burn intensive care units. J Diabetes Sci Technol, 3, 4, 951-9. Signal, M. 2013. Continuous Glucose Monitoring and Tight
Glycaemic Control in Critically Ill Patients Doctor of
Philosophy, University of Canterbury
Signal, M., Le Compte, A., Harris, D. L., Weston, P. J., Harding, J. E., et al. (2012). Impact of retrospective calibration algorithms on hypoglycemia detection in newborn infants using continuous glucose monitoring.
Diabetes Technol Ther, 14, 10, 883-90.
Signal, M., Pretty, C. G., Chase, J. G., Le Compte, A. & Shaw, G. M. (2010). Continuous glucose monitors and the burden of tight glycemic control in critical care: can they cure the time cost? J Diabetes Sci Technol, 4, 3, 625-35. Thomas, F., Pretty, C. G., Shaw, G. M. & Chase, J. G. 2014a.
Glucometer Performance in the Intensive Care Unit. 14th
Annual Diabetes Technology Meeting (DTM). Bethesda,
MD.
Thomas, F., Signal, M., Harris, D. L., Weston, P. J., Harding, J. E., et al. (2014b). Continuous Glucose Monitoring in Newborn Infants: How Do Errors in Calibration Measurements Affect Detected Hypoglycemia? J
Diabetes Sci Technol, 8, 3, 543-550.
Thorsson, O., Lilja, B., Ahlgren, L., Hemdal, B. & Westlin, N. (1985). The effect of local cold application on intramuscular blood flow at rest and after running. Med