Université de Montréal
Studies of MHC class I antigen presentation &
the origins of the immunopeptidome
par Hillary Pearson
Programme de Biologie Moléculaire Faculté de Médecine
Mémoire présenté
en vue de l’obtention du grade de Maître ès Sciences en Biologie Moléculaire
option Générale
Avril 2016
Résumé
La présentation d'antigène par les molécules d'histocompatibilité majeure de classe I (CMHI) permet au système immunitaire adaptatif de détecter et éliminer les agents pathogènes intracellulaires et des cellules anormales. La surveillance immunitaire est effectuée par les lymphocytes T CD8 qui interagissent avec le répertoire de peptides associés au CMHI présentés à la surface de toutes cellules nucléées.
Les principaux gènes humains de CMHI, HLA-A et HLA-B, sont très polymorphes et par conséquent montrent des différences dans la présentation des antigènes. Nous avons étudié les différences qualitatives et quantitatives dans l'expression et la liaison peptidique de plusieurs allotypes HLA. Utilisant la technique de cytométrie de flux quantitative nous avons établi une hiérarchie d'expression pour les quatre HLA-A, B allotypes enquête. Nos résultats sont compatibles avec une corrélation inverse entre l'expression allotypique et la diversité des peptides bien que d'autres études soient nécessaires pour consolider cette hypothèse.
Les origines mondiales du répertoire de peptides associés au CMHI restent une question centrale à la fois fondamentalement et dans la recherche de cibles immunothérapeutiques. Utilisant des techniques protéogénomiques, nous avons identifié et analysé 25,172 peptides CMHI isolées à partir des lymphocytes B de 18 personnes qui exprime collectivement 27 allotypes HLA-A,B. Alors que 58% des gènes ont été la source de 1-64 peptides CMHI par gène, 42% des gènes ne sont pas représentés dans l'immunopeptidome. Dans l'ensemble, l’immunopeptidome présenté par 27 allotypes HLA-A,B ne couvrent que 17% des séquences exomiques exprimées dans les cellules des sujets. Nous avons identifié plusieurs caractéristiques des transcrits et des protéines qui améliorent la production des peptides CMHI. Avec ces données, nous avons construit un modèle de régression logistique qui prédit avec une grande précision si un gène de notre ensemble de données ou à partir d'ensembles de données indépendants génèrerait des peptides CMHI. Nos résultats montrent la sélection préférentielle des peptides CMHI à partir d'un répertoire limité de produits de gènes avec des caractéristiques distinctes. L'idée que le système immunitaire
peut surveiller des peptides CMHI couvrant seulement une fraction du génome codant des protéines a des implications profondes dans l'auto-immunité et l'immunologie du cancer. Mots-clés: complexe majeur d'histocompatibilité (CMH) de classe I, antigènes d'histocompatibilité humains (HLA), immunopeptidome, expression quantitative, spectrométrie de masse, régression logistique, modélisation
Abstract
Antigen presentation by major histocompatibility complex class I (MHCI) molecules allows the adaptive immune system to detect and eliminate intracellular pathogens or abnormal cells. Immune surveillance is executed by CD8+ T cells that monitor the repertoire of MHCI-associated peptides (MAPs) presented at the surface of all nucleated cells.
The primary human MHCI genes, HLA-A and HLA-B, are highly polymorphic and consequentially demonstrate differences in antigen presentation. We investigated qualitative and quantitative differences in expression and peptide binding. Using quantitative flow cytometry we establish a clear hierarchy of expression for the four HLA-A,B allotypes investigated. Our results are consistent with an inverse correlation between expression and peptide diversity although further work is necessary to solidify this hypothesis.
The global origins of the MAP repertoire remains a central question both fundamentally and in the search for immunotherapeutic targets. Using proteogenomics, we identified and analyzed 25,172 MAPs isolated from B lymphocytes of 18 individuals who collectively expressed 27 HLA-A,B allotypes. While 58% of genes were the source of 1-64 MAPs per gene, 42% of genes were not represented in the immunopeptidome. Overall, we estimate the immunopeptidome presented by 27 HLA-A,B allotypes covered only 17% of exomic sequences expressed in subjects’ cells. We identified several features of transcripts and proteins that enhance MAP production. From these data we built a logistic regression model that predicts with high accuracy whether a gene from our dataset or from independent datasets would generate MAPs. Our results show preferential selection of MAPs from a limited repertoire of gene products with distinct features. The notion that the immune system can monitor MAPs covering only a fraction of the protein coding genome has profound implications in autoimmunity and cancer immunology.
Keywords: major histocompatibility complex (MHC) class I , human leukocyte antigen (HLA), immunopeptidome, quantitative expression, mass spectrometry, logistic regression, modeling
Table of Contents
Résumé ... i
Abstract ... iii
Table of Contents ... iv
List of Tables ... vii
List of Figures ... viii
List of Acronyms ... x
Acknowledgements ... xiii
Overview ... 1
Chapter 1 - Introduction ... 3
1.1 The adaptive immune system ... 3
1.1.1 Key components of adaptive immunity ... 3
1.1.2 Tolerance & discrimination by T cells ... 4
1.1.3 MHC I genomics & evolution ... 5
1.2 MHC I antigen processing & presentation ... 6
1.2.1 Classical antigen processing of endogenous peptides ... 7
1.2.2 Cross-presentation of exogenous peptides ... 9
1.2.3 Noncanonical pathways of antigen generation ... 9
1.2.4 The role of MHCI in activation of the CD8+ T cell response ... 10
1.3 Studying the immunopeptidome ... 11
1.3.1 Diverse methods identify MAPs ... 11
1.3.2 Structural features of MAPs ... 13
1.3.3 Genomic origins of MAPs ... 16
1.4 The immunopeptidome in disease ... 18
1.4.1 MHCI in the pathogenicity of infection & autoimmunity ... 18
1.4.2 Cancer immunotherapy ... 19
1.5.1 Research objectives ... 21
1.5.2 Model cell lines ... 22
Chapter 2 - Studies of MHCI expression & peptide presentation ... 23
2.1 Methods ... 23
2.2 Quantitative analysis of MHCI expression ... 24
2.3 The efficiency of mild acid elution is HLA allotype dependent ... 27
2.4 Recovery of HLA expression ... 28
2.5 Estimating the diversity and binding affinity of HLA allotype peptide repertoires ... 31
2.6 Features of minor histocompatibility antigens ... 33
Chapter 3 - The immunopeptidome presents selected portions of the human genome with distinct features to CD8+ T cells ... 35
3.1 Abstract ... 36
3.2 Introduction ... 36
3.3 Results ... 38
3.3.1 Proteogenomic-based definition of the MAP repertoire presented by 27 HLA allotypes .. 38
3.3.2 Discrete protein regions are preferential sources of MAPs ... 40
3.3.3 Gene expression cannot solely account for differential ability of genes to generate MAPs . 43 3.3.4 MAP source transcripts are enriched in features conferring greater translation efficiency .. 45
3.3.5 The primary and secondary structure of proteins regulates MAP generation ... 46
3.3.6 GO Terms analysis ... 49
3.3.7 Modeling MAP generation ... 50
3.3.8 Model validation with independent datasets ... 52
3.4 Discussion ... 53
3.5 Materials and Methods ... 56
3.5.1 Proteogenomic identification of MAPs derived from B-LCLs ... 56
3.5.2 Simulations of the redundancy in MAP and MAP source gene repertoires ... 56
3.5.3 Spatial localization of MAPs along source proteins ... 56
3.5.4 Evaluating features of transcripts and proteins ... 57
3.5.5 Protein degradation prediction softwares ... 58
3.5.6 Data visualization ... 58
3.5.8 Statistical analysis ... 59
3.5.9 Logistic regression modeling ... 59
3.6 Supplementary figures & tables ... 60
3.7 Acknowledgements ... 69
3.8 Additional Information ... 69
3.9 Author contributions ... 69
3.10 References ... 70
Chapter 4 - Discussion & perspectives ... 79
4.1 Elucidating the dynamics of MHCI expression ... 79
4.2 Developing immunopeptidome predictions ... 80
4.3 Applications of immunopeptidome predictions ... 82
4.4 How diverse is the MAP repertoire ? ... 84
Conclusion ... 86
Bibliography ... i
Appendix 1 - Protocol for QIFIKIT quantitation of MHCI expression on B-LCLs ... i
Appendix 2 - Protocol for mild acid elution of surface MHCI peptides on B-LCLs ... vi
Appendix 3 - Protocol for papain digestion of surface MHCI on B-LCLs ... ix
List of Tables
Table I. MAP identifications by subject and allele ... 61 Table II. Features used for predictive modeling of MAP source vs. non-source genes ... 65 Table III. Primary antibody dilutions and product information for indirect
immunofluorescence and quantitation of various HLA-A,B allotypes ... i Table IV. Reference values for consistent quantitation using the QIFIKIT on a BD
FACSCANTO II ... iv Table V. Recipe for preparation of citrate phosphate buffer for mild acid elution ... vi Table VI. Recipe for preparation of papain buffer ... ix
List of Figures
Chapter 1
Figure 1. The structure and polymorphism of MHC class I molecules ... 6
Figure 2. Pathways of MHCI processing and presentation ... 8
Figure 3. Binding motifs of nonamer peptides for 27 HLA-A & HLA-B alleles studied in Chapter 3 ... 14
Figure 4. The length distribution of MAPs presented by 27 HLA-A & HLA-B allotypes studied in Chapter 3 ... 15
Figure 5. MAPs derive from diverse genomic origins ... 16
Chapter 2 Figure 6. Absolute global and allotype specific HLA expression on B-LCLs ... 26
Figure 7. Relative MHCI expression of 4 HLA allotypes and global HLA expression at during mild acid elution lasting 15, 30 or 60 seconds ... 28
Figure 8. Recovery of MHCI expression over 9 hours following MAE or papain digestion .. 30
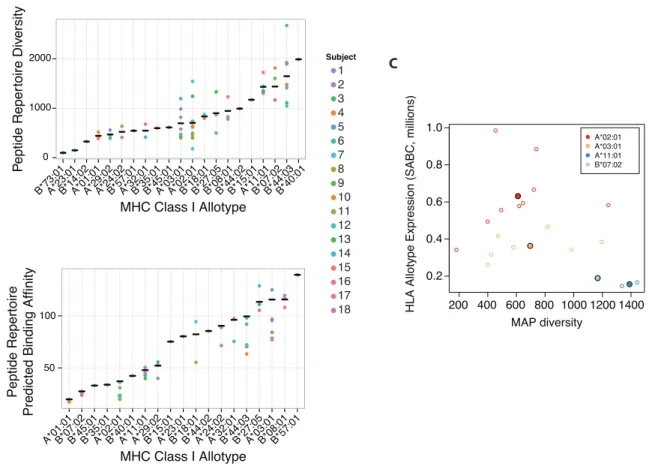
Figure 9. Binding affinity, diversity, and expression of MHCI allotypes ... 32
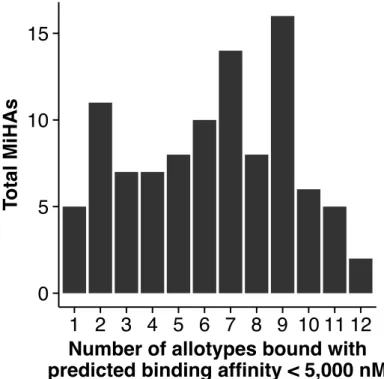
Figure 10. MiHA promiscuity ... 34
Chapter 3 Figure 11. The depth and breadth of the multi-allelic immunopeptidome presented by 27 HLA allotypes ... 39
Figure 12. MAP distribution along source proteins ... 42
Figure 13. Features of MAP source genes and transcripts ... 44
Figure 14. Features of MAP source proteins ... 48
Figure 15. Gene ontology analysis of source and non-source genes ... 49
Figure 16. A logistic regression model to predict whether a gene will generate MAPs ... 50
Figure 17. Evaluation of gene prediction scores with two independent datasets ... 53
Figure 19. Supplementary features of MAP source transcripts ... 62 Figure 20. Supplementary features of MAP source proteins ... 63 Figure 21. Protein disorder predicted by three complementary methods: PONDR VL-XT, DISOPRED and IUPRED ... 64 Figure 22. An ordered logistic regression model predicts whether MAP output for a gene will be high, low or nonexistent ... 67 Figure 23. Correlation matrix of all model input variables using Spearman's ρ ... 68
List of Acronyms
3'UTR 3' untranslated region 5'UTR 5' untranslated region 7-AAD 7-aminoactinomycin D aa Amino acid residue
ABC Antibody binding capacity ACT Adoptive cell therapy
AHCT Allogeneic hematopoietic cell transplantation AIRE Autoimmune regulator
ANOVA Analysis of variance APC Antigen presenting cell
AU Adenosine & uridine ribonucleic acids AUC Area under the curve
β2m β2-micoglobulin BCR B cell receptor
B-LCL B lymphoblastoid cell line
bp Base pairs
CMH Complexe majeur d'histocompatibilité
CMHI Complexe majeur d'histocompatibilité de classe I CRT Calreticulin
DDA Data-dependent acquisition DIA Data-independent acquisition DNA Deoxyribonucleic acid
DRiP Defective ribosomal products EBV Epstein-Barr virus
EDTA Ethyenediamineteraacetic acid ER Endoplasmic reticulum
ERAP 1/2 Endoplasmic reticulum aminopeptidase associated with antigen
processing
ERp57 Endoplasmic reticulum resident protein 57 FACS Fluorescence-activated cell sorting
FBS Fetal bovine serum
FC Flow cytometry
FDR False discovery rate
FSC Forward scatter
GC Guanosine & cytidine ribonucleic acids
GO Gene ontology
GPCR G-protein coupled receptor GSEA Gene set enrichment analysis
GWAS Genome wide association studies
HEPES 4-(2-hydroxyethyl)-1-piperazineethanesulfonic acid HIV Human immunodeficiency virus
HLA Human leukocyte antigen
HPLC High performance liquid chromatography IQR Interquartile range
MAE Mild acid elution
MAP MHC class I associated peptide MFI Mean fluorescence intensity MHC Major histocompatibility complex MHCI Major histocompatibility complex class I MHCII Major histocompatibility complex class II MiHA Minor histocompatibility antigen
mRNA Messenger RNA MS Mass spectrometry neo-MAP neoantigen MAPs
NMD Nonsense mediated decay
nsSNP Non-synonymous single nucleotide polymorphism uORF Upstream open reading frame
PBMC Peripheral blood mononuclear cell
PBS/BSA Phosphate buffered saline, 1% bovine serum albumin PLC Peptide loading complex
pMHCI peptide-MHCI complex
QIKIFIT Quantitative indirect immunofluorescence kit, © Dako RDP Rapidly degraded protein
RNA Ribonucleic acid RNP Ribonucleoprotein
ROC Receiver operating characteristic SABC Specific antibody binding capacity
SNP Single nucleotide polymorphism SNV Single nucleotide variant
SSC Side scatter
TAP Transporter associated with antigen processing TCGA The Cancer Genome Atlas
TCR T cell receptor
TIL Tumour infiltrating lymphocyte
Acknowledgements
This work was made possible by many talented and generous people. The progression of my studies was shaped by discussions over coffee, in lab meetings, and in the sofas overlooking the Saint-Joseph Oratory. If I have discovered one thing in my journey from learning how to use a pipette to coding genome wide data analyses, it is that research is truly a collaborative effort.
First and foremost, I would like to thank my research director Dr. Claude Perreault for the opportunity to join team immunopeptidome. I feel fortunate to have found a mentor who encouraged me to take on new challenges while reminding me to focus judiciously and whose passion and wisdom in unparalleled.
Thank you to Jean-Baptiste for joining me in this adventure, to my parents for their unwavering support, and to my family for inspiring me every step of the way. Thank you to everyone in the Perreault lab for their enthusiasm and helpfulness regarding my research. Our lunchtimes, chocolate breaks and shared love of coffee were indispensible research fuel. I am very lucky to have worked with such a brilliant and welcoming group of people. A special thank you to Diana Granados for being a patient and thoughtful supervisor. Thank you to Tariq Daouda and Sébastien Lemieux for their guidance in the realm of statistics and bioinformatics. Thank you to the coauthors of the article presented in chapter 3 for their tremendous efforts assembling the immunopeptidome. Thank you to Dr. Brian Wilhelm and Dr. Luis Barreiro for their time and effort in revising my master's thesis.
I would also like to acknowledge the efforts of everyone at the IRIC to provide opportunities for budding scientists and build a fruitful research environment. Finally, this work would not have been possible without a community that values science and the generous support of the Quebec Breast Cancer Foundation.
Overview
The adaptive immune system is charged with surveillance and elimination of threats to host survival. This is achieved through two pillars of adaptive immunity: self / non-self discrimination and diversity. Self versus non-self discrimination describes the ability of effector cells to recognize foreign bodies by becoming tolerant of the self. Diversity within the tools of the adaptive immune repertoire is essential for detection and recognition of diverse threats to survival.
Allelic polymorphism of the major histocompatibility complex class I (MHCI) genes is one mechanism of diversity. In antigen presentation, MHCI bind intracellular protein fragments produced by cytosolic degradation and present these peptides at the cell surface. Each MHCI allele produces an allotype, a polymorphic protein, capable of presenting different repertoires of MHCI associated peptides (MAPs) defined by the variable shape of the peptide binding groove. Collectively, the repertoire of MAPs, the immunopeptidome, represents a vision of the self from the perspective of the adaptive immune system. The antigen presentation pathway also captures peptides derived from pathogens or abnormal proteins that will be recognized as non-self and may initiate an immune response.
In humans, the MHCI locus is polygenic as well as polymorphic and contains the major genes: HLA-A, HLA-B and HLA-C. At the population level, HLA polymorphism confers different fitness for diseases ranging from infection to autoimmunity to cancer; the presence of some HLA allotypes may be protective while others increase susceptibility. The mechanism of disease association for different HLA allotypes has yet to be described convincingly. Hypotheses include that certain allotypes present specific immunodominant peptides which mediate responses in infection or autoimmunity. Another possibility is the inherent differences in global peptide repertoire and antigen presentation by different HLA allotypes alter the T cell repertoire and subsequent immune responses.
The global dynamics of antigen production, presentation and recognition are central to effective immunosurveillance. Therefore, we studied how allelic diversity impacts expression
and antigen binding properties of different HLA allotypes. We also characterized the immunopeptidomes of 18 individuals presenting 27 HLA-A,B allotypes to elucidate the genetic origins of MAPs.
This master's thesis is presented in 4 chapters and 4 appendices. Chapter 1 introduces the role of antigen presentation in the adaptive immune system and outlines the research questions. Chapter 2 presents the central results from studies of differences in HLA allotype expression and peptide binding. Chapter 3 presents an article in preparation entitled 'the immunopeptidome presents selected portions of human genome with distinct features to CD8+ T cells'. Chapter 4 discusses and offers perspectives on results presented in this work. Appendix 1 through 3 include optimized protocols corresponding to results presented in chapter 2; appendix 4 contains contributions to separate article.1
Our findings highlight fundamental differences in absolute HLA expression and invite complete elucidation of the HLA allotype specific expression cycle to reveal different functional properties. We explore in detail the genetic origins of MAPs across 27 allotypes. Our results show that MAPs derive from a select portion of the transcribed exome (< 17%) since only 58% of genes generate MAPs and MAPs derive preferentially from adjacent regions. We annotate MAP source and non-source genes and used features to predict with good accuracy whether a given gene will generate MAPs. The notion that the immune system can monitor MAPs covering only a fraction of the protein coding genome has profound implications in autoimmunity and cancer immunology.
Chapter 1 - Introduction
1.1 The adaptive immune system
The adaptive immune system of jawed vertebrates has evolved with the central purpose of eliminating threats to the host at a cellular level. Two challenges are inherent to this goal: how to identify diverse threats at a molecular level and how to monitor a complex system with many hiding places. To address the first, genetic recombination and somatic hypermutation alter the DNA sequence of linear loci to generate receptors that recognize diverse targets. Diversity is also inherent in the allelic polymorphism of molecules that bind antigens (protein fragments) to present to these receptors. Host-wide surveillance is achieved through continuous presentation of antigens derived from intracellular and extracellular compartments to diversified receptors. Antigens derived from foreign proteins, for example in infection, pregnancy or transplantation, or aberrant proteins, in neoplastic or stressed cells, can initiate immune responses. When foreign antigens are detected by receptors, a process of clonal selection - proliferation of the cell expressing the recognisant antigen binding receptor - engages a host-wide response to identify and eliminate the specific threat.2–4
1.1.1 Key components of adaptive immunity
The precision of the adaptive immune system depends on complex interactions between many subtypes of haematological cells which may be classified in two major branches: B cells and T cells. Each of these make use of clonally distributed antigen binding receptors, the B cell receptor (BCR) and T cell receptor (TCR), and rely on crosstalk for activation and survival. B cells are responsible for antibody mediated immune responses that identify structurally diverse targets in the extracellular environment. TCRs are restricted to recognizing protein fragments presented at the surface of antigen presenting cells (APCs). Professional APCs initiate an immune response by presenting peptides derived from foreign or aberrant proteins to T cells and by providing essential costimulatory signals to guide the expansion of appropriate subpopulations. A final cornerstone of adaptive immunity is immunological
memory. Once an immune response has been mounted, a subset of antigen detecting cells will differentiate into memory cells. Upon re-challenge by the same antigen, a swift protective immune response driven by memory cells will eliminate the threat - such is the principle of vaccination to stave off infection. The mechanisms of activation, cross-talk and memory in each arm of adaptive immunity have been reviewed extensively.5–11
T cell recognition is contingent of the participation of normal cells, APCs, in immune surveillance. Genes within the major histocompatibility complex (MHC) region of the genome bind and present peptide antigens derived from the extracellular and intracellular environments for MHC class II (MHCII) and MHC class I (MHCI) molecules respectively. MHCII molecules interact with T cells bearing the CD4 costimulatory receptor whereas MHCI are recognized by CD8+ T cells. MHCII expression is restricted to professional antigen presenting cells whereas MHCI is expressed on all nucleated cells. Functionally, MHCII antigen presentation stimulates 'helper' T cells to coordinate the immune response since MHCII antigens reflect the extracellular environment. Conversely, MHCI antigen presentation initiates a cytotoxic response from CD8+ T cells to eliminate cells harbouring pathogen derived or abnormal proteins. Over the course of an immune response, the activation of CD8 and CD4 T cells is coordinated by professional APCs while effector functions operate interdependently.3,12–14
1.1.2 Tolerance & discrimination by T cells
The T cell branch of the adaptive immune system uses somatic recombination to generate an incredibly diverse repertoire of T cells capable of recognizing unseen targets. T cells must discriminate between peptide antigens derived from host proteins and peptides that reflect a threat to the host. Self / non-self discrimination is achieved by T cell education in the thymus. Among developing T cells, only a minority survive the process of thymic selection which ensures an immunocompetent and self-tolerant T cell repertoire. Positive selection provides survival signals in the thymic cortex to T cells bearing receptors that recognize MHCI and MHCII molecules. Without these signals, T cells that do not interact with MHCI or MHCII on cortical cells will perish. In the thymic medulla, negative selection
eliminates autoreactive T cells with high affinity for self antigens bound to MHCI or MHCII. Medullary thymic epithelial cells display promiscuous expression of tissue specific genes to ensure T cells are tolerized to a comprehensive repertoire of self peptides. Thymic education therefore produces a repertoire of MHC-restricted T cells capable of discriminating between the self and the non-self. 15–17
1.1.3 MHC I genomics & evolution
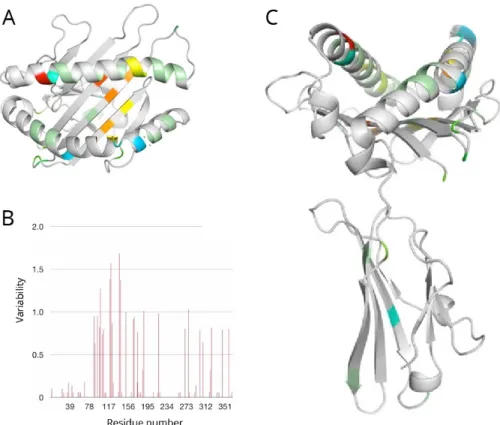
Finally, we arrive at the focal point of this work and a keystone of adaptive immunity: antigen presentation by MHC class I molecules. The MHCI α-chain is a transmembrane protein with a luminal peptide binding groove consisting of a basal beta sheet and lined on each side by α-helices (Figure 1). The binding groove can accommodate a variety of peptides derived from products of intracellular degradation. The MHCI gene is both polygenic and polymorphic. In humans, the three main gene loci are called HLA-A, HLA-B, and HLA-C. All exhibit exceptional levels of polymorphism, currently there are 3,356 HLA-A, 4,179 HLA-B and 2,902 HLA-C alleles documented.18 Polymorphisms are essentially localized to the peptide binding grove.19 The allele-specific structure of the groove translates to presentation of peptides with different binding motif generally defined by the electrochemical properties of anchor residues the P2 and PΩ (terminal) sites. HLA alleles can be organized into superfamilies that present peptides with similar binding properties based on the evolution of polymorphic loci.20,21
From an evolutionary point of view, MHCI and the surrounding regions are unique. The evolution MHC I is one of few examples of diversifying selection. In all likelihood, selection was driven by herd immunity and differential fitness in the face of a plethora infectious agents over time. By virtue of the fact that it contains many polymorphisms exhibiting linkage disequilibrium, the MHC locus has revealed much about ancestry, migration and selection in population genetics.23–25
Figure 1. The structure and polymorphism of MHC class I molecules. (A) Top view of an HLA-A α-chain binding pocket, highly variable residues are coloured. (B) Variability of HLA-A residues within the binding pocket. (C) Side view of the HLA-A α-chain. Adapted from Gherardi.22
MHCI molecules are expressed on nucleated cells in normal tissues in a constitutive fashion with ~105 peptide-MHCI complexes at the surface of each cell although this varies based on cell type. HLA-C tend to be expressed at ~10% of HLA-A and HLA-B.26–29 Secondary functions of MHCI include promoting neuronal plasticity, maternal-fetal interaction and olfaction.23
1.2 MHC I antigen processing & presentation
The pathways of MHCI antigen processing and presentation have been a major focus of research in immunology for the past three decades.12,13,30 The pathway of class I processing
and presentation is well established.13 However, the specific origins of MAPs and the relative contribution of different sources remains contentious.30 The global dynamics of antigen production, presentation and recognition are central to effective immunosurveillance.
1.2.1 Classical antigen processing of endogenous peptides
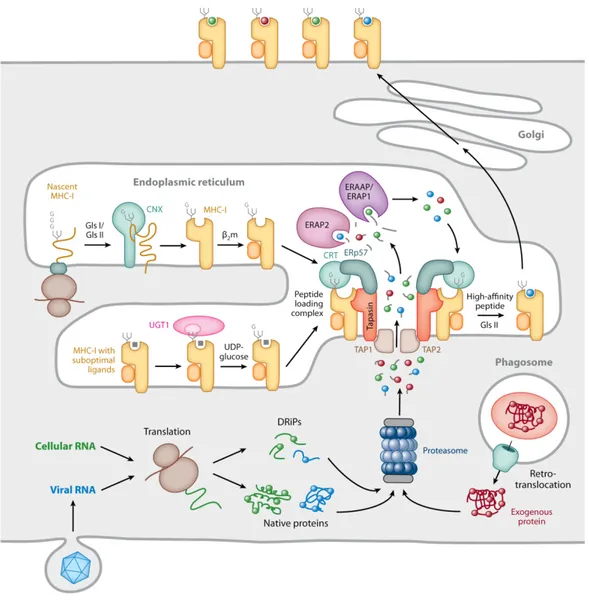
The classical pathway of antigen processing (visualized in Figure 2) begins with the 20S proteasome, an enzyme structurally and functionally homologous to a food disposal unit one might attach to their kitchen sink. The barrel-shaped set of stacked multi-subunit rings is responsible for the degradation of a significant portion of cytosolic proteins. Proteins targeted for degradation by ubiquitination are first recognized by the proteasome cap.13 Proteins are deubiquitinated, unfolded and fed into the barrel where proteolytic reactions produces fragments of roughly 3 to 20 amino acids.31 Interestingly, the incorporation of alternate subunits in the caps and barrel of the proteasome dramatically alters the repertoire of MHCI presented peptide antigens.32 Degradation products may be further trimmed by cytosolic peptidases before translocation into the endoplasmic reticulum (ER) by the transporter associated with antigen processing (TAP).
Meanwhile, the polymorphic MHCI α-chain is translated into the ER and undergoes multi-step glycosylation, resulting primarily in complex N-glycans. Beta 2 microglobulin (β2m) associates with the α-chain and confers stability to the nascent MHCI. TAP imports peptides into the immediate vicinity of the peptide loading complex (PLC) machinery. ER localized aminopeptidases (ERAP1/2) conduct further trimming of potential MHCI peptides. Peptide-MHCI binding is facilitated by components of the PLC: the chaperone calreticulin (CRT), the disulphide bond isomerase ERp57, and the bridging protein tapasin (Figure 2). The PLC helps stabilize and induce conformational changes that facilitate peptide binding in the MHCI groove. In addition to acting as a scaffold for PLC components, tapasin is also essential in the process of peptide editing, the exchange of peptides in favour of those with higher affinity. High affinity peptide-MHCI-β2m complexes (pMHCI) are released from the PLC and exported via the Golgi secretory pathway to the cell surface.13,33
Figure 2. Pathways of MHCI processing and presentation. Adapted from Blum et al.13
Peptide-MHCI expression is dependent on the binding affinity of the particular peptide for the MHCI binding pocket; when the peptide dissociates, the MHCI-β2m complex becomes less stable and is internalized for recycling or degradation.12,34–36 The past 15 years have seen elucidation of the mechanisms and roles of PLC components. The salient finding is that the PLC is essential in shaping immune responses through the process of peptide selection.33
1.2.2 Cross-presentation of exogenous peptides
An alternate pathway for MHCI presentation of exogenous peptides, cross-presentation, resembles the MHCII pathway and makes use of MHCII machinery.23 Cross-presentation may occur via the cytosolic or vacuolar pathways. The cytosolic pathway by definition is the presentation of exogenous peptides that is sensitive to proteasome inhibition. Processing occurs within the cytosol while peptide loading may occur via the classical ER pathway or within the phagosome (Figure 2). The vacuolar pathway permits exogenous antigen presentation via phagocytosis of extracellular proteins and phagosomal degradation. MHCI molecules may arrive in the phagosome through recycling or trafficking of newly synthesized complexes. The contribution of cross-presentation to the MHCI peptide repertoire is minimal in normal tissues. Cross-presentation is particularly effective in some professional APCs such as dendritic cells and plays an important role in the early stages of immune activation by priming naive CD8+ T cells.13,37,38
1.2.3 Noncanonical pathways of antigen generation
The major source of MAPs is generally though to be rapidly degraded proteins (RDPs) from many contexts. RDPs may include excess subunits form multiprotein complexes, pioneer translation products and defective ribosomal products (DRiPs).15 One study showed mRNAs carrying premature stop codons will undergo nonsense-mediated decay yet effectively produce MAPs, presumably during the pioneer round of translation.39 Recently, MAPs deriving from introns, out-of-frame translation and antisense transcripts further implicated immature mRNAs in antigen generation.40 The discovery of MAPs derived from traditionally non-coding regions is one example of how immunology intersects and informs our understanding of fundamental biological processes.13
Another pathway first proposed by Yewdell, the DRiP hypothesis, postulates that nascent prematurely terminated and misfolded proteins as well as defective mRNA are the major source of MAPs.41 Evidence supporting DRiPs focus on the kinetics of antigen presentation: MAP are efficiently generation from stable viral proteins and MHCI presentation is swiftly abrogated upon translation inhibition. Selectively presenting newly
synthesized peptides may allow a cell to preferentially include non-self antigens in the MAP repertoire prior to viral interference with the canonical antigen presentation pathway.39,40,42–44 While the DRiP hypothesis remains controversial,45,46 it is becoming increasingly clear the immunopeptidome not merely a reflection of the proteome.15
1.2.4 The role of MHCI in activation of the CD8+ T cell response
All these roads lead to antigen presentation and potential for T cell recognition. The dynamics of recognition remain puzzling: T cells can recognize single agonists presented in a sea of self peptides.47 The number of copies of each unique peptide-MHCI complex is estimated between 1 to 104 per cell and is MHCI allotype dependent.15 Furthermore, each TCR can recognize upwards of a million different peptides bound to MHCI.48 How specific recognition is achieved in these conditions remains difficult to explain. Once an immune response has been initiated, cytokines including interferons can upregulate HLA gene expression to facilitate recognition.49 The liaison of TCR to peptide to MHCI describes the immunological synapse between CD8+ T cells and APCs. Signalling and activation following recognition at the synapse is defined by CD8 costimulation and the local immune environment.47
While many potential non-self peptides may be presented upon intracellular infection, the T cell response tends to be focused on a few immunodominant peptides. Immunodominance is shaped by antigen processing, MHCI loading, T cell specificity and pMHCI surface expression time. Expression time is intrinsically related to the stability of the complex and binding affinity to the MAP; higher affinity interactions promote stability and may induce more effective T cell responses.33,50 Once an immune response is mounted, T cells demonstrate sticking sensitivity and can recognize even a single pMHCI target.13 High affinity recognition by the TCR of a CD8+ T cell initiates a signalling cascade that induces cytotoxic killing of the target cell.5
1.3 Studying the immunopeptidome
Immunologists have long hunted MHC class I associated peptides (MAPs) to understand how the self is defined for T cells and explore potential therapeutic applications. Despite extensive knowledge of antigen processing, it is impossible to predict the composition of the MHCI peptide repertoire.12 Early studies identified single peptides; as tens and hundreds of peptides were discovered so were alleles specific binding motifs.27 The study presented in Chapter 3 identified 25,172 unique HLA-A,B bound peptides; the immune epitope database, a repository for discovered MAPs, describes 219,463 peptide epitopes identified to date.51 This progression reflects an improvement in techniques employed to identify MAPs. Since the advent of high throughput genomics and proteomics, many groups have studied immunopeptidomes of various MHCI allotypes in various hosts.14,40,52–56 Their contribution to our knowledge of the cellular origins of MHCI presented peptides is outlined in the introduction of Chapter 3. Methods to identify MAPs and other focal points of these studies including characteristics of MAP sequences and genetic origins are summarized in this section.
1.3.1 Diverse methods identify MAPs
Current methods to identify MAPs can be broadly classed into two categories: high throughput proteomics and in silico screening. The first relies on experimental evidence of MAPs via isolating and sequencing peptides using mass spectrometry (MS) while the latter predicts and subsequently validates potential MAPs.
The techniques and challenges involved in experimental characterization of the immunopeptidome are expertly reviewed by Caron et al.57 Isolation of MAPs from APCs may be achieved through mild acid elution to release peptides from MHCI on the surface of live cells or through immunoprecipitation of pMHCI complexes from cell lysate. While the first method offers higher sample throughput and yield, the latter has greater specificity and sample flexibility. To sequence isolated MAPs, classical data-dependent MS uses known protein coding regions matched to MS spectra for large scale identification. Alternatively, targeted
data acquisition allows specific identification and quantification of predefined sets of MAPs. An emerging technique deemed data-independent acquisition (DIA) combines these two strategies but requires detailed libraries of peptide retention time and fragmentation patterns. MAPs present a unique challenge to MS because of variable sequences (compared to samples treated with proteases with specific cleavage sites) and intra-laboratory differences in acquisition that result in limited reproducibility. Only ~10% of spectra in a given experiment are confidently assigned to a MAP sequence; these assignments offer a certain if incomplete picture of the immunopeptidome. With each new generation of mass spectrometry instruments and techniques, the limits of detection are pushed to identify lowly expressed peptides and move towards a complete picture of the immunopeptidome.56,57
Alternatively, in silico MAP identification uses binding affinity predictions along protein coding sequences of a particular organism to predict a high affinity immunopeptidome. Binding affinity predictions are complex as they must be allele and peptide specific. Fundamentally, binding motifs are governed by electrochemical and structural rules which have made this problem quite manageable for artificial neural networks such as NetMHC.58,59 One study using this approach estimated interallelic differences in binding affinity and diversity for several HLA-A and HLA-B allotypes.50 Several studies have identified MAPs spanning de novo mutations in tumour cells using this method.60 Certainly, the major limitation of in silico approaches is lack of information about antigen processing. As a result, the rate of false positives is estimated at ~90%.54 The central question remains: will peptides predicted to bind MHCI actually undergo appropriate processing and be presented at the cell surface? To address this, such studies must move to relatively low throughput experimental validation such as T cell reactivity assays,60,61 or pMHCI multimer staining of T cells with flow cytometry.62
The selection of methods is largely shaped by the goals and setting of each study. Those seeking to identify few targets can afford to whittle down many potential targets post-identification while those seeking a comprehensive picture of the immunopeptidome are limited to confident identifications. Each method demands different resources, requires specific samples and has limited detection thresholds. To achieve an ultimate goal, the large
scale identification of MAPs in clinical tissue samples, will perhaps require convergence of these methods. One could imaging a pipeline that marries genomic and bioinformatic profiling of a sample with a comprehensive database of experimentally defined MAPs followed by high throughput validation via flow cytometry or mass spectrometry. Such an approach will require a collaborative effort but has realistic potential to shape personalized therapies in a clinical setting (see section 1.4.2 for further details).
1.3.2 Structural features of MAPs
Studies of the sequences of MHCI presented peptides have produced two salient findings: MAPs are constrained in terms of binding motif and length. As described previously, the extensive polymorphism of MHCI HLA-A and HLA-B alleles is localized to the peptide binding groove which functionally translates to alleles-specific binding motifs (Figure 3). Motifs are generally defined at the second residue, P2, and the C terminal residue, PΩ, although exceptions exist such as HLA-B*08:01 which has a P5 anchor. Typically the P2 anchor relies on charged interactions,25 while the PΩ anchor tends to be more hydrophobic including small aliphatic residues or aromatic residues.
In our study we identified peptides corresponding to conventional motifs for each of the 27 alleles studied; motifs of each set of nonamer are shown in Figure 3. Since we predicted binding affinities with NetMHC to assign peptides among potential HLA alleles and applied a strict predicted affinity threshold of <1250nM, our results can only reinforce known motifs.58 Evidently, it is difficult to estimate the potential contribution of non-canonical binding motifs in multiallelic systems. MAPs that do not conform to the rules of prediction algorithms are likely underrepresented in the current literature.
Figure 3. Binding motifs of nonamer peptides for 27 HLA-A & HLA-B alleles studied in Chapter 3. The number of peptides used to determine the motif
1 2 3 4 5 6 7 8 9 0 1 2 3 4 HLA*A−01:01 n =785 1 2 3 4 5 6 7 8 9 0 1 2 3 4 HLA*A−02:01 n =2257 1 2 3 4 5 6 7 8 9 0 1 2 3 4 HLA*A−03:01 n =1275 1 2 3 4 5 6 7 8 9 0 1 2 3 4 HLA*A−11:01 n =2348 1 2 3 4 5 6 7 8 9 0 1 2 3 4 HLA*A−23:01 n =111 1 2 3 4 5 6 7 8 9 0 1 2 3 4 HLA*A−24:02 n =779 1 2 3 4 5 6 7 8 9 0 1 2 3 4 HLA*A−29:02 n =605 1 2 3 4 5 6 7 8 9 0 1 2 3 4 HLA*A−32:01 n =584 1 2 3 4 5 6 7 8 9 0 1 2 3 4 HLA*B−07:02 n =4018 1 2 3 4 5 6 7 8 9 0 1 2 3 4 HLA*B−08:01 n =1195 1 2 3 4 5 6 7 8 9 0 1 2 3 4 HLA*B−13:02 n =39 1 2 3 4 5 6 7 8 9 0 1 2 3 4 HLA*B−14:02 n =260 1 2 3 4 5 6 7 8 9 0 1 2 3 4 HLA*B−15:01 n =1916 1 2 3 4 5 6 7 8 9 0 1 2 3 4 HLA*B−18:01 n =1122 1 2 3 4 5 6 7 8 9 0 1 2 3 4 HLA*B−18:03 n =215 1 2 3 4 5 6 7 8 9 0 1 2 3 4 HLA*B−27:05 n =1264 1 2 3 4 5 6 7 8 9 0 1 2 3 4 HLA*B−35:01 n =450 1 2 3 4 5 6 7 8 9 0 1 2 3 4 HLA*B−39:24 n =260 1 2 3 4 5 6 7 8 9 0 1 2 3 4 HLA*B−40:01 n =1380 1 2 3 4 5 6 7 8 9 0 1 2 3 4 HLA*B−41:01 n =434 1 2 3 4 5 6 7 8 9 0 1 2 3 4 HLA*B−44:02 n =859 1 2 3 4 5 6 7 8 9 0 1 2 3 4 HLA*B−44:03 n =3569 1 2 3 4 5 6 7 8 9 0 1 2 3 4 HLA*B−45:01 n =500 1 2 3 4 5 6 7 8 9 0 1 2 3 4 HLA*B−50:01 n =331 1 2 3 4 5 6 7 8 9 0 1 2 3 4 HLA*B−56:01 n =712 1 2 3 4 5 6 7 8 9 0 1 2 3 4 HLA*B−57:01 n =783 1 2 3 4 5 6 7 8 9 0 1 2 3 4 HLA*B−73:01 n =179 Residue Position Bits
is indicated. Binding affinities predicted with NetMHC 3.0 and NetMHCcons 1.1.63,64 Plotted with motifStack in R.65,66
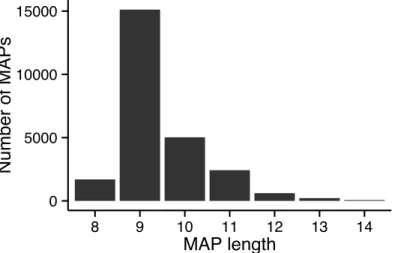
The second constraint introduced by antigen processing machinery and HLA binding is on the length of MAPs. The canonical length of MHCI peptides is 8-11 amino acids although peptides up to 15 amino acids have been identified.67 Ours and previous work reflect the dominance of nonamer peptides independent of the allele under consideration (Figure 4), although preference for other lengths appears to be allele dependent.53,67 Structural studies of pMHCI have identified two modes of binding that allow the MHCI binding groove to accommodate longer peptides. Central bulging of the peptide allows the P2 and PΩ residues to fit in the same binding pockets as shorter peptides.68,69 Alternatively, N or C terminal extensions of the peptide beyond the binding pocket are also possible.70
Figure 4. The length distribution of MAPs presented by 27 A & HLA-B allotypes studied in Chapter 3.
For all of these constraints, an incredible diversity of MAP sequences persists. Of course, this allows individuals expressing different allotypes to capture a representative array of peptides from self and non-self sources.
0 5000 10000 15000 8 9 10 11 12 13 14 MAP length Number of MAPs
1.3.3 Genomic origins of MAPs
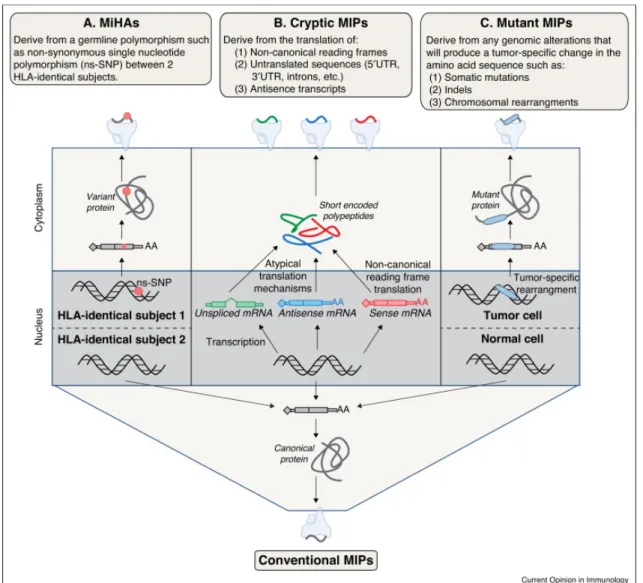
MAPs can be segregated in terms of their genomic origins: conventional antigens, cryptic antigens, minor histocompatibility antigens (MiHAs), and mutation-derived antigens (neo-MAPs). While the majority of studies, including the one presented in Chapter 3, focus on identification of conventional peptides, it is becoming increasingly clear that the immunopeptidome captures diverse genomic events (Figure 5).
Figure 5. MAPs derive from diverse genomic origins. Origins include (A) MiHAs, (B) cryptic MAPs, (C) mutant neo-MAPs and conventional MAPs. Adapted from Granados et al.15
Conventional MAPs derive from consensus protein coding sequences, that is translation products of known protein coding genes that are shuttled into the antigen processing pathway. In contrast, cryptic antigens derive from non-canonical protein coding regions such as antisense transcripts, introns, UTRs, long non-coding RNA, and alternative reading frames. One study estimates the proportion of cryptic MAPs around 10%.40 Potential sources of these antigens include i) pioneer translation products in the nucleus, ii) short open reading frames, iii) out-of-frame translation of mature transcripts, iv) translation of traditionally non-coding RNA and v) unstable transcripts undergoing nonsense mediated decay.13,39,40,43
The immunopeptidome also captures genomic alterations such as non-synonymous variants, mutations, and rearrangements with peptides spanning these transformations. MiHAs are peptides with non-synonymous genetic polymorphisms (nsSNPs) contained in their sequence.1 CD8+ T cells from individuals with different alleles at a MiHA loci recognize the MiHA generated from the alternate allele as non-self. MiHA recognition contributes to graft versus host disease in bone marrow transplants between HLA matched donor-recipient pairs.72 A final class of peptides, neo-MAPs, are derived from mutations or genomic rearrangements. From a clinical point of view, these antigens are of particular interest as they may be uniquely expressed on a particular subpopulation, such as neoplastic cells, and could be used to identify and target harmful cells for destruction (see Section 1.4.2).15
Some MAPs lack precise genomic origins or are incompletely described by nucleotide sequences. Studies of the proteasome have revealed a capacity to splice together peptide fragments and highlight the inclusion of splicing products in the immunopeptidome.73 Peptide antigens may also contain diverse post-translational modifications.25 Therefore, from a T cell perspective, a given MAP encoding sequence may generate structurally distinct epitopes.
The discovery of various classes of MAPs demonstrates that the antigen presentation pathway captures the genomic and translational complexity of each cell. For immunologists concerned with identifying MAPs this has important implications. Techniques that rely on a reference genome will exclude the discovery of cryptic, polymorphic and mutant MAPs.
Presently, techniques relying on six frame translation of personalized RNA sequencing data alone may discover such antigens.40 It is essential to be aware of these gaps in our knowledge and, with advances in proteogenomics, aim to develop techniques that produce an increasingly complete picture of the immunopeptidome.
1.4 The immunopeptidome in disease
Of any region in the genome, the MHC locus is associated with the most diseases.23 Within the locus, MHC class I and II are responsible for the majority of associations due to their diversity and central role in modulating immune responses. The MHCI immunopeptidome projects fragments from the intracellular environment that reflect the metabolic events within the cell. From the perspective of a T cell or a biologist trying to identify subpopulations of cells, MAPs offer a wealth of targets that that are accessible at the cell surface and specific to the intracellular events of each cell. Recognition of non-self MAPs by T cells first and foremost allows the elimination of intracellular infection. However, when the distinction between self and non-self is confused, autoimmune disease results. CD8+ T cells naturally recognize mutated targets on neoplastic cells and may effectively stave off cancer for years;74 cancer immunotherapy aims to adapt this highly effective target elimination system to enhance anti-tumoral responses.
1.4.1 MHCI in the pathogenicity of infection & autoimmunity
The advent of genome wide association studies (GWAS) has validated associations between the MHC region and disease phenotypes. However, the MHC locus on chromosome 6 contains such an exceptional density of polymorphism, epistasis, and functionally related genes that it has been difficult to tease out exact mechanisms. CD8+ T cell activation mediates both infection and autoimmune disease, potentially through recognition of non-self and self peptides respectively.23
The importance of MHCI presentation in combating infection can be illustrated by viral genomes, which face strong selection and must be highly economical yet have developed a
plethora of mechanisms to impede antigen presentation.75 Conversely, infection is considered a major selective pressure driving polymorphism in MHCI. As viruses mutate and evolve, different alleles may be selected for their ability to present immunogenic viral epitopes and mediate elimination of infections.23 Alternatively, inherent differences in antigen presentation by different HLA allotypes will shape the T cell repertoire and subsequent immune responses. One well studied example is the differential ability of MHCI allotypes to control HIV progression conferring protection or susceptibility. For example, HLA-B*57 is associated with lower viral load and slower decline in the number of CD4+ T cells. A SNP linked to HLA-C expression levels has also independently been tied to HIV control.76
The strongest genetic risk factors for autoimmune diseases are consistently ns-SNP loci within the class I and class II genes. The subset of diseases characterized by autoantibodies are strongly linked with MHCII while other diseases tend to be linked with MHCI.77 One of the most potent associations ties susceptibility to ankylosing spondylitis to residues within the binding grooves of HLA-B*27 and polymorphism of the PLC aminopeptidase, ERAP1.78 A mechanistic hypothesis to explain these associations is that a peptide uniquely processed by ERAP1, in complex with HLA-B*27 is structurally homologous to a non-self antigen. This 'arthritogenic peptide' becomes a target for cross-reactive T cells and autoimmune attack ensues. Studies of the immunopeptidomes of linked and unlinked HLA-B*27 allotypes have had modest success identifying the elusive arthritogenic peptide.79,80
Elucidating the role of MHCI in infection and autoimmunity has followed a similar progression. GWAS have been indispensible in implicating different MHCI alleles in disease although the precise mechanisms remain elusive due in part to the aforementioned challenges of studying the immunopeptidome.
1.4.2 Cancer immunotherapy
The potential for antigens within the immunopeptidome to specifically identify and mediate targeted destruction of tumour cells is of significant interest for our work. Several lines of evidence support immune recognition of neoplastic cells through neo-MAPs. First, meta analyses have shown a correlation between the mutational load and immune infiltration
of a tumour. Second, checkpoint blockade antibodies such as anti-PD1 and anti-CTLA4 - which essentially release the breaks on T cell activation - have effectively cured some metastatic cancers.74,81,82
Targeted methods in immunotherapy aim to enhance the precise interaction mediating tumour elimination and reduce off-target side effects. For example in adoptive cell therapy (ACT), autologous tumour infiltrating lymphocytes or genetically engineered T cells that recognize neo-MAPs are cultured and selected for tumour recognition ex vivo. Reactive T cells are administered to the patient following lymphodepletion to favour a focused anti-tumoral response. Evidently, the complex protocol of ACT has required challenging optimization every step of the way but recent successes, particularly in cases of metastatic melanoma, are promising.83 A similar approach harnesses native anti-tumour response by administering a peptide vaccine with suitable adjuvants to prime and activate T cells recognizing neo-MAPs.81,84
A major limiting step for large scale clinical implementation of both methods is the identification of suitable targets. The search for targets has revealed one major finding: effective neo-MAPs must be considered non-self from the host T cell perspective. The mechanism of negative selection (elimination of autoreactive T cells) limits the immunogenicity of self peptides. Furthermore, if self peptides are immunogenic, they can induce autoimmune-like toxicity towards other tissues.83 Ideal neo-MAP targets therefore derive from alterations specific to neoplastic cells such as nonsynonymous mutations, frameshift mutations or rearrangements. If neo-MAPs deriving from common driver mutations in cancer exist and could be identified, a regularized therapy could be implemented for cohorts of patient. Alternatively, novel methods that efficiently predict or experimentally identify neo-MAPs derived from unique mutations offer a solution with broader applications.85 Unfortunately, such MAPs are difficult to identify using current DDA MS techniques which rely on reference databases of non mutated proteins.57 An ideal therapy might employ a multi-target approach to match intra-tumoral heterogeneity and thwart immune escape. A better understanding of origins of the immunopeptidome and continual
improvements in proteogenomics should facilitate neo-MAPs identification through predictive or experimental means.
1.5 Research context
1.5.1 Research objectives
MHCI is the centerpiece of adaptive immune surveillance and shapes the progression of numerous diseases. Questions revolving around MHCI antigen presentation are therefore of both fundamental and clinical importance. A fundamental question facing immunologists is the extent of differences in expression and peptide presentation brought about by HLA polymorphism: what is the impact of HLA allelic diversity on expression and binding of peptide repertoires? We were also driven by the question of the genetic origins of the self peptide repertoire presented by MHCI: from a T cell perspective, what is the self? To answer these questions, we make use of cutting-edge proteomics, genomics, and informatics to discover and analyse the immunopeptidome.
We hypothesized that variation in MHCI expression would be both allotype and subject dependent. We also explored linear relationships between MHCI expression and other variables including peptide diversity or binding affinity. Regarding the genetic origins of the immunopeptidome, we hypothesized that MAPs would derive from a distinct subset of genes and gene products with common features that may be related to antigen processing.
This work has 6 primary experimental objectives addressed in chapter 2 (objectives 1-3), and chapter 3 (objectives 4-6).
1. To determine absolute abundance of MHCI expression on B-LCLs.
2. To compare inter-individual and inter-allotype differences in MHCI expression and peptide presentation.
3. To devise and overall estimate of binding affinity and diversity for MHCI peptides. 4. To identify MAPs from a broad population of HLA allotypes and different subjects.
5. To asses the extent of MAP generation from the entire set of protein coding genes. 6. To determine whether specific features influence the ability of discrete genes to
generate MAPs.
1.5.2 Model cell lines
We chose to study MHCI expression and antigen presentation on human B cells transformed by Epstein-Barr virus (EBV) infection. The resulting immortalized B lymphoblastoid cell lines (B-LCLs) are quite amenable to in vitro culture and offer the following advantages:
i. B-LCLs closely resemble primary B cells;86
ii. B cells in PBMCs from most individuals are easily EBV transformed, therefore we were able to study multiple individuals bearing many HLA allotypes;
iii. B-LCLs grow in suspension and therefore do not require protease mediated digestion for analysis, which would otherwise cleave surface MHCI;
iv. B-LCLs express relatively high levels of MHCI, therefore fewer cells are required for the high-throughput proteogenomic pipeline.
Chapter 2 - Studies of MHCI expression & peptide
presentation
HLA polymorphism shapes the selection and development of CD8+ T cells by presenting immunopeptidomes with different structures and diversity. The impact of HLA polymorphism on peptide binding is well described: each allotype bind peptides with particular residues in the appropriate anchor positions and demonstrates a predictable binding motif. However, the impact of HLA polymorphism on surface expression has yet to be comprehensively described. MHCI antigen presentation shapes each step in the development and responses of CD8+ T cells; recent work has highlighted the potential influence of HLA expression in thymic selection and disease phenotypes.29,87,88
With newly available quantitative flow cytometry techniques, we set out to determine the absolute abundance of HLA molecules and compare inter-allotype differences in MHCI expression. We hypothesized differences in the overall binding affinity and diversity of the peptide repertoire would be related to differences in HLA expression. In the context of large scale elutions studies, we studied mild acid elution (MAE) efficacy for different HLA allotypes. Additionally, we present preliminary results of allotype specific expression recovery following MAE or proteolytic cleavage. Finally, we investigated an important subset of MAPs, minor histocompatibility antigens, as part of a larger study.1
2.1 Methods
The study protocol was approved by the Comité d'Éthique de la Recherche de l'Hôpital Maisonneuve-Rosemont. Written informed consent was obtained from donors. B cells from 18 donors PBMCs were transformed with Epstein-Barr virus to generate immortalized B lymphoblastoid cell lines (B-LCLs) as previously described.56 B-LCLs were maintained in RPMI 1640 supplemented with 10% FBS, 1% penicillin/streptomycin and 1%
L-glutamine at 37°C. Flow cytometry analysis was conducted on a BD FACSCANTO II. Statistical analyses were carried out in R version 3.1.3, data visualization was achieved with the
ggplot2 package.65,71 Detailed protocols for each analysis are included in the appendices for reference:
Annexe 1. Protocol for QIFIKIT quantitation of MHCI expression on B-LCLs. Annexe 2. Protocol for mild acid elution of surface MHCI peptides on B-LCLs. Annexe 3. Protocol for papain digestion of surface MHCI on B-LCLs.
2.2 Quantitative analysis of MHCI expression
Routine flow cytometry (FC) is an immensely powerful technique to comparatively assess expression of molecular markers on 104-107 cells in a single experiment. It employs fluorescently labeled antibodies with strong affinity and high specificity for their targets to measure protein expression. Due to sensitivity to changes in instrument parameters and experimental conditions, traditional FC results are limited to relative comparisons. To quantify FC fluorescence in absolute terms, the QIFIKIT relies on the fundamentally linear relationship between fluorescence and number of antibody-bound fluorescent molecules. Control populations of beads with a known number of receptors are used to generate a calibration curve that translates MFI of a secondary antibody into specific antibody binding capacity (SABC) or the approximate number of molecules per cell. The challenges of exact quantitation via FC include i) untangling the contributions of non-specific staining, ii) mitigating limiting factors such as antibody concentration, and iii) limiting inter-experiment variation. To maximize the precision of our analyses, we examined the influence of total cells, antibody concentration, blocking Fc receptors, washing protocol and instrument parameters. The optimized parameters are noted in the protocol in appendix 1. Results show the average of 3 independent experiments.
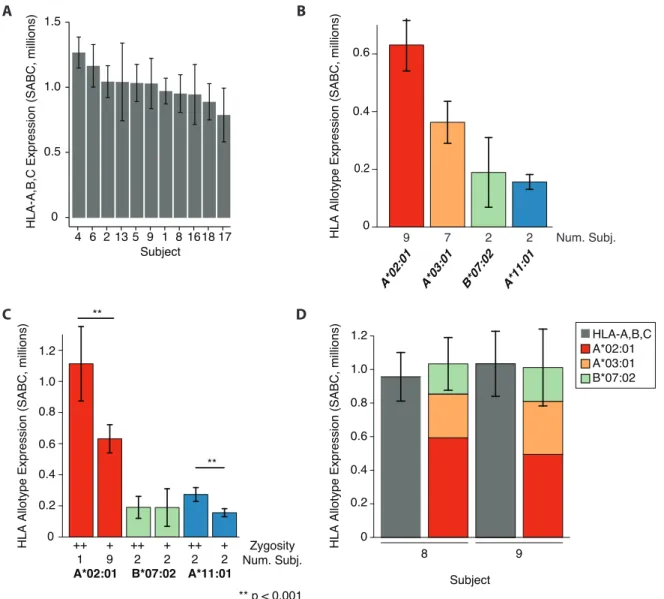
First, we quantified MHCI expression using a pan HLA-A,B,C antibody. Globally, MHC class I expression was 1.1 x 10⁶ molecules per cell with ± 16% inter-individual variation
(Figure 6A). Using the same technique, Berlin et al. found between 50,000 and 300,000 MHCI molecules expressed on acute myeloid leukemia cells and benign leukocytes.89 We conclude that B-LCLs exhibit particularly high MHCI expression. Next, we quantified expression of 4 common HLA allotypes: HLA-A*02:01, HLA-A*03:01, HLA-A*11:01, and HLA-B*07:02. We found relatively consistent expression of each allotype across cell lines (Figure 6B). A hierarchy of allotype expression emerged: A*02:01 > A*03:01 > B*07:02 ≈ A*11:01. Even when normalized to global HLA-A,B,C expression in each cell line, the relative contribution of each allotype to surface expressed was consistent. Finally, to estimate the variance attributable to environmental vs. genetic factors, we compared the complete profiles of HLA-A,B expression on B-LCLs derived from monozygotic twins (subjects 8 and 9, Figure 6D). We found very similar profiles of expression between these two subjects in global and allotype-specific quantifications. We noted that differences in the process of EBV transformation may influence MHCI expression.90 This analysis also confirms that HLA-A,B expression makes up for the majority of HLA-A,B,C levels.
One hypothesis to explain these results is that allotypes forming more stable pMHCI complexes persist on the surface longer and exhibit greater surface expression. The fact that different alleles demonstrate variable increases in expression in homozygous conditions may support this hypothesis. For example, we could imagine in the case of HLA-A*02:01, peptides efficiently form highly stable complexes allowing homozygous cell lines to almost double expression. In contrast, if peptide-HLA-B*07:02 complexes are less stable, additional proteins in homozygous cell lines may be retained intracellularly during quality control steps, or recycled from the surface at a greater rate. Notably, transcript level expression for HLA-A was ~50% of HLA-B genes and was similar in all cell lines. Other factors shaping MHCI expression may include protein abundance, peptide supply, the restrictiveness of binding motifs,50 or allotypic differences in tapasin and TAP interaction.35,91,92 Globally, a combination of these factors may define inter-allotypic variation in MHC expression. We conclude surface expression is an intrinsic feature of each allotype.
Figure 6. Absolute global and allotype specific HLA expression on B-LCLs. (A) Absolute expression of HLA-A, B and C molecules on 11 B-LCL cell lines. (B) Absolute expression of 4 HLA allotypes in heterozygous cell lines. The number of subjects is indicated. (C) A comparison of absolute expression of 3 HLA allotypes in B-LCLs with homozygous and heterozygous genotypes. The number of subjects and zygosity are indicated. (D) Complete expression profiles of HLA-A,B allotypes in monozygotic twin subjects. Results are the average of 3 experiments. Surface expression is measured in Specific Antibody Binding Capacity (SABC), details in appendix 1. The HLA alleles expressed by each subject are indicated in Table I.
8 9 0 0.2 0.4 0.6 0.8 1.0 1.2 HLA-A,B,C A*02:01 A*03:01 B*07:02
A*02:01 A*03:01 B*07:02 A*11:01
0 0.4 0.6 0.2 A*02:01 ++ 1 + 9 ++ 2 + 2 ++ 2 + 2 0 0.2 0.8 1.0 0.4 0.6 1.2 B*07:02 A*11:01 ** ** ** p < 0.001 0 0.5 1.0 1.5 4 6 2 13 5 9 1 8 1618 17 Subject
HLA-A,B,C Expression (SABC, millions)
A B
C D
HLA Allotype Expression (SABC, millions)
Zygosity Num. Subj.
9 7 2 2 Num. Subj.
HLA Allotype Expression (SABC, millions)
Subject
2.3 The efficiency of mild acid elution is HLA allotype dependent
In large scale proteogenomics studies of the immunopeptidome, MAPs can be isolated from surface MHCI molecules using mild acid elution (MAE) to release peptides from MHCI binding pockets. With this technique, studies have found differences in the diversity of the peptide repertoires detected for different allotypes.42,55,56,93 One hypothesis among many is that MAE efficacy differs by allotype and contributes to differences in the number of identifications. We investigated this question with small scale MAE studies following the protocol in appendix 2. Results are representative of at least one experiment on 2 cell lines per allotype in technical triplicate.Preliminary results suggest MAE liberates peptides in an allotype dependent manner (Figure 7). Relative to untreated cells, we saw a global decrease in expression for all alleles following MAE, reflecting the instability of the MHCI α-chain without bound peptide.94 We initially remarked poor efficacy of elution for A*03:01 and A*11:01, which belong to the same superfamily and have a similar binding motif of T/L/V at P2 and K dominating PΩ (Figure 3). MAE was considerably more efficient for B*07:02 which has a P2: P, PΩ: L motif. Finally, MAE was most effective for A*02:01 which has a P2: L and PΩ: V/L. Interestingly the hierarchy of elution efficacy could be related to the types and strengths of interactions mediating peptide binding for each allotype. It appears MAE more efficiently elutes peptides relying on hydrophobic interactions such as L and V anchors than polar or charged anchors such as T, K, and P. Further investigation is warranted to confirm this hierarchy across cell lines and allotypes.
Importantly, these experiments were preformed with ~6 x 10⁵ cells whereas an immunopeptidome MAE experiment uses ~5 x 10⁸ cells to have enough material for MS analyses. The applicability of these findings on a larger scale is not yet clear. This question could be answered simply by incorporating allele specific antibodies and flow cytometry analysis following a large scale elution study.
Figure 7. Relative MHCI expression of 4 HLA allotypes and global HLA expression at during mild acid elution lasting 15, 30 or 60 seconds. Each point represents a single experiment on one cell line expressing each allele heterozygously, analyses were performed in technical triplicate.
To limit the potential bias in the MAP repertoire introduced by allotype specific MAE efficacy, a longer elution time could be used. Residual MHCI expression after 5 minutes of MAE is negligible (< 5%) independent of allotypes although longer elution periods may lead to cell death.
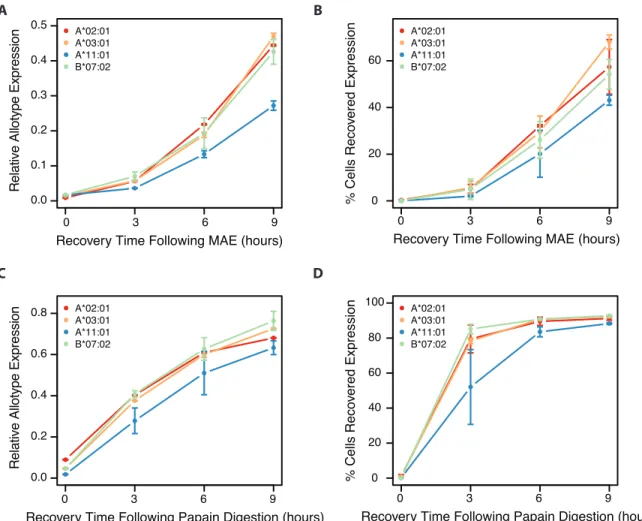
2.4 Recovery of HLA expression
We subsequently investigated inter-allotype differences in recovery of MHCI expression following either MAE or proteolytic cleavage. The papain protease, naturally produced by papayas, has been used in immunopeptidome studies to cleave surface MHCI molecules.95,96 We expected some variation in recovery given established inter-allotype differences in tapasin dependence and peptide editing,97 in the occurrence of the allotypic binding motifs in the proteome,50 and in absolute allotype expression. We hypothesized allotypes demonstrating more efficient peptide loading would recover expression more quickly.
0.00 0.25 0.50 0.75 1.00 0 20 40 60 Time (s)
Relative HLA Expression
HLA Allotype A*11:01 A*02:01 A*03:01 HLA-A,B,C B*07:02