1
WEIGHING RISK FACTORS ASSOCIATED WITH BEE COLONY COLLAPSE DISORDER BY 2
CLASSIFICATION AND REGRESSION TREE ANALYSIS 3
4
Dennis vanEngelsdorpa,b, Niko Speybroeckc,d, Jay D. Evanse, Bach Kim Nguyenf, Chris Mullinb, Maryann 5
Frazierb, Jim Frazierb, Diana Cox-Fosterb, Yanping Chene, David R. Tarpyg, Eric Haubrugef, Jeffrey S. 6
Pettise, and Claude Saegermanh* 7
a
Bureau of Plant Industry, Pennsylvania Department of Agriculture, 2301 North Cameron Street. 8
Harrisburg PA 17110, TEL: 717-772-5225; FAX:717-705-6518 9
EMAIL:[email protected]
10
b
Department of Entomology, The Pennsylvania State University, University Park, PA 16802; TEL: 814-11
865-1895; FAX: 814-865-3048; EMAIL: [email protected], [email protected], [email protected], 12
[email protected], [email protected] 13
c
Institute of Tropical Medicine, Nationalestraat 155, 2000 Antwerp, Belgium; EMAIL: 14
15
d
Institute of Health and Society, Université Catholique de Louvain, Clos Chapelle-aux-Champs, 1200 16
Bruxelles, Belgium 17
e
USDA – ARS Bee Research Laboratory, Bldg. 476 BARC-E, Beltsville, MD 20705 USA EMAIL: 18
[email protected], [email protected], [email protected]
19
f
Department of Functional and Evolutionary Entomology, Agro-Bio Tech, University of Liege -5030 20
Gembloux, Belgium, TEL: +32-81-62-2287; FAX: +32-81-62-2312; EMAIL: [email protected], 21
22
g
Department of Entomology, Campus Box 7613, North Carolina State University, Raleigh, NC 27695-23
7613; TEL: (919) 515-1660; FAX: (919) 515-7746; EMAIL: [email protected]
24
h
Department of Infectious and Parasitic Diseases, Epidemiology and Risk analysis applied to the 25
Veterinary Sciences, Faculty of Veterinary Medicine, University of Liege, B-4000 Liege, Belgium, TEL 26
+32-4-366-4579; FAX +32-4-366-4261; EMAIL: [email protected]
*
Corresponding author: Department of Infectious and Parasitic Diseases, Epidemiology and Risk analysis 28
applied to the Veterinary Sciences, Faculty of Veterinary Medicine, University of Liege, B-4000 Liege, 29
Belgium, TEL +32-4-366-4579; FAX +32-4-366-4261; EMAIL: [email protected] 30
ABSTRACT 31
Colony Collapse Disorder (CCD), a syndrome whose defining trait is the rapid loss of adult worker honey 32
bees, is thought to be responsible for a minority of the large over-wintering losses experienced by U.S. 33
beekeepers since the winter of 2006-2007. Using the same data set developed to perform a mono-34
factorial analysis (vanEngelsdorp et al. 2009), we conducted a classification and regression tree (CART) 35
analysis in an attempt to better understand the relative importance and inter-relations among different risk 36
variables in explaining CCD. Fifty-five exploratory variables were used to construct two CART models: 37
one with and one without a cost of misclassifying a CCD-diagnosed colony as a non-CCD colony. The 38
resulting model tree which permitted for misclassification had a sensitivity and specificity of 85% and 39
59% respectively. While factors measuring colony stress (e.g., adult bee physiological measures such as 40
fluctuating asymmetry or mass of head, and morphological measures such as frames of brood) were 41
important discriminating values, 6 of the 19 variables having the greatest discriminatory value were 42
pesticide levels in different hive matrices. Notably, coumaphos levels in brood (a miticide commonly 43
used by beekeepers) had the highest discriminatory value and were highest in control (healthy) colonies. 44
Our CART analysis provides evidence that CCD is likely the result of several factors acting in concert, 45
making afflicted colonies more susceptible to disease. This analysis highlights several areas that warrant 46
further attention, including the effect of sub-lethal pesticide exposure on pathogen prevalence and the role 47
of variability in bee tolerance to pesticides on colony survivorship. 48
49
Keywords: Colony collapse disorder, Epidemiology, Classification and Regression Tree analysis, 50
Pathogens, Apiculture, Apis mellifera. 51
52
INTRODUCTION 53
Large-scale losses of managed honey bees (Apis mellifera L.) have been reported globally 54
(Haubruge et al. 2006, vanEngelsdorp and Meixner 2010). In the United States, a portion of the dead and 55
dying colonies were characterized by a common set of specific symptoms: (i) the rapid loss of adult 56
worker bees from affected beehives, resulting in weak or dead colonies with excess brood present relative 57
to adult bees; (ii) a noticeable lack of dead worker bees both within and surrounding the hive; and (iii) the 58
delayed invasion of hive pests (e.g., small hive beetles and wax moths) and kleptoparasitism from 59
neighbouring honey bee colonies (Cox-Foster et al. 2007). Subsequently, this syndrome has been termed 60
Colony Collapse Disorder, or CCD, and its case definition has been revised to include (iv) the absence of 61
varroa and nosema loads at levels thought to cause economic damage (vanEngelsdorp et al. 2009). 62
In an attempt to better characterize CCD, an initial descriptive epizootiological study was 63
conducted (vanEngelsdorp et al. 2009). This mono-factorial study focused on identifying and quantifying 64
direct and indirect measures of risk in affected populations and comparing these measures with apparently 65
healthy populations. Some measures of risk differed between apparently healthy and unhealthy 66
populations, although no one factor clearly separated the two groups. Generally, CCD-affected colonies 67
had higher pathogen incidence and pathogen loads, but no pathogen on its own was found in all CCD 68
colonies. This finding suggests that some underlying risk factor or combination of risk factors 69
compromises the immunity of bees and thus decreases a colony’s ability to fight pathogenic infection 70
(vanEngelsdorp et al. 2009). A recent effort found broad changes in gene expression between bees from 71
healthy and collapsed colonies, along with elevated pathogen levels in CCD colonies, but no systematic 72
differences in RNA transcripts for genes implicated in honey bee immunity (Johnson et al. 2009b). 73
A classification and regression tree (CART) analysis is a useful non-parametric data-mining 74
technique. This analysis is particularly helpful when attempting to investigate which direct and indirect 75
measures of risk are predictive of a newly emerging or complex disease (Saegerman et al. 2004). Contrary 76
to classical regression (which uses linear combinations), CART does not require the data to be linear or 77
additive. Furthermore, CART analysis does not require possible interactions between factors to be pre-78
specified (Breiman et al. 1984). In essence, the classification trees resulting from a CART analysis 79
accommodate more flexible relationships among variables, missing covariate values, multi-colinearity, 80
and outliers in an intuitive manner (Speybroeck et al. 2004). When values for some predictive factors are 81
missing, they can be estimated using other predictor (“surrogate”) variables, permitting the use of 82
incomplete data sets when generating regression trees. Another advantage of a CART analysis (as 83
compared to a classical multivariate regression analysis) is that it allows for the calculation of the overall 84
discriminatory power, or relative importance, of each explanatory variable. 85
The monofactorial study by vanEngelsdorp and colleagues (2009) investigated more than 200 86
variables, but only 61 occurred with enough frequency to make meaningful comparisons between 87
diseased (CCD) and apparently healthy populations. Included in this list of variables were 6 that were 88
directly linked with either the operational or refined definition of CCD: frames of bees, ratio of bees to 89
brood, presence of varroa mites (Varroa destructor), spore loads and presence of Nosema ceranae, 90
Nosema apis, or both (see case definition discussion above). While the inclusion of these variables either 91
validated the application of the operational case definition (or justified the revision of the original case 92
definition of CCD), the use of these “case defining” variables in a multi-factorial analysis could skew 93
results as these variables are inherently not independent. In the current study, we preformed a CART 94
analysis to help identify those variables that, independently or in combination, best discriminate CCD 95
from non-CCD populations. However, to avoid creating a circular argument, we included only truly 96
independent variables (n=55) and discarded those (n=6) that were intrinsic to CCD’s case definition. This 97
study is the first to apply a CART analysis to honey bee pathology in an attempt to advance the 98
understanding of the underlying causes of CCD. 99
MATERIALS AND METHODS 101
Study apiaries and colonies 102
As outlined in vanEngelsdorp et al. (2009), 91 colonies from 13 apiaries resident in either Florida 103
or California during January and February 2007 had adult bees, brood, wax, and/or beebread (pollen 104
provisions) sampled for further analysis. 105
Case definition 106
Select colonies were classified in the field as either (i) not having CCD symptoms (39 ‘control’ 107
colonies) or (ii) having CCD symptoms (52 ‘CCD’ colonies). Colonies were considered to have CCD 108
symptoms when adult bee populations were in obvious rapid decline leaving brood poorly attended, or 109
were dead in an apiary having clear symptoms of CCD. In those CCD colonies where bees remained, 110
there were insufficient number of bees to cover the brood, the remaining worker bees appeared young 111
(i.e., adults bees that were unable to fly), and the queen was present. Notably, both dead and weak 112
colonies in CCD apiaries were not being robbed by other bees despite the lack of bloom in the area, 113
neither were they being attacked by secondary pests despite the presence of honey and beebread in the 114
vacated equipment (vanEngelsdorp et al. 2009). 115
Explanatory variables 116
After elimination of six variables inherently linked to defining CCD colonies (vanEngelsdorp et 117
al., 2009, and above), the remaining variables were either indirect measures of colony stress (e.g., adult 118
bee physiological and morphological measures) or direct measures of risk that are thought to directly and 119
adversely affect colony health (e.g., parasite, pathogen, and pesticide loads). 120
Classification and regression tree analysis 121
A CART (Classification and regression tree) analysis was conducted on the data set, where 122
colony status (CCD or Control) was used as the dependent variable and the 55 direct/indirect measures of 123
risk were used as independent or predictor variables. A CART analysis is a non-linear and non-parametric 124
model that is fitted by binary recursive partitioning of multidimensional covariate space. Using CART 6.0 125
software (Salford Systems, San Diego, CA, USA), the analysis successively splits the dataset into 126
increasingly homogeneous subsets until it is stratified meet specified criteria (Saegerman et al. 2004, 127
Thang et al. 2008). The Gini index was used as the splitting method, and 10-fold cross-validation was 128
used to test the predictive capacity of the obtained trees. CART performs cross validation by growing 129
maximal trees on subsets of data then calculating error rates based on unused portions of the data set. To 130
accomplish this, CART divides the data set into 10 randomly selected and roughly equal parts, with each 131
“part” containing a similar distribution of data from the populations of interest (i.e., CCD vs. Control). 132
CART then uses the first 9 parts of the data, constructs the largest possible tree, and uses the remaining 133
1/10 of the data to obtain initial estimates of the error rate of the selected sub-tree. The process is repeated 134
using different combinations of the remaining 9 sub-sets of data and a different 1/10 data sub-set to test 135
the resulting tree. This process is repeated until each 1/10 sub-set of the data has been used as to test a tree 136
that was grown using a 9/10 data sub set. The results of the 10 mini-tests are then combined to calculate 137
error rates for trees of each possible size; these error rates are applied to prune the tree grown using the 138
entire data set. 139
The consequence of this complex process is a set of fairly reliable estimates of the independent predictive 140
accuracy of the tree, even when some of the data for independent variables are incomplete and/or specific 141
events are either rare or overwhelmingly frequent. 142
143
For each node in a CART generated tree, the “primary splitter” is the variable that best splits the node, 144
maximizing the purity of the resulting nodes. When the primary splitting variable is missing for an 145
individual observation, that observation is not discarded but, instead, a surrogate splitting variable is 146
sought. A surrogate splitter is a variable which pattern within the dataset, relative to the outcome variable, 147
is similar to the primary splitter. Thus, the program uses the best available information in the face of 148
missing values. In datasets of reasonable quality, this allows all observations to be used. This is a 149
significant advantage of this methodology over more traditional multivariate regression modelling, in 150
which observations which are missing any of the predictor variables are often discarded. 151
In this study, two classification and regression tree models were constructed: one without and one 152
with a cost of misclassifying a CCD diagnosed (positive) colony as an apparently healthy (negative) 153
colony. For the second tree, several possibilities were tested, but the tree generated allowing for a 154
misclassification cost of 2 resulted in the smallest number of misclassified colonies while minimizing the 155
size (complexity) of the resulting tree (cf. Suman et al. 2010 for details). The cost (penalty) is a measure 156
of the likelihood of misclassifying a CCD-diagnosed (positive) colony as an apparently healthy (negative) 157
colony. This classification enabled us to make a distinction between groups of colonies containing at least 158
one colony with CCD from groups of colonies without any CCD-diagnosed colonies. The discriminatory 159
power of each variable included in the analysis was also calculated. 160
RESULTS 161
Classification and regression trees analysis without a misclassification cost 162
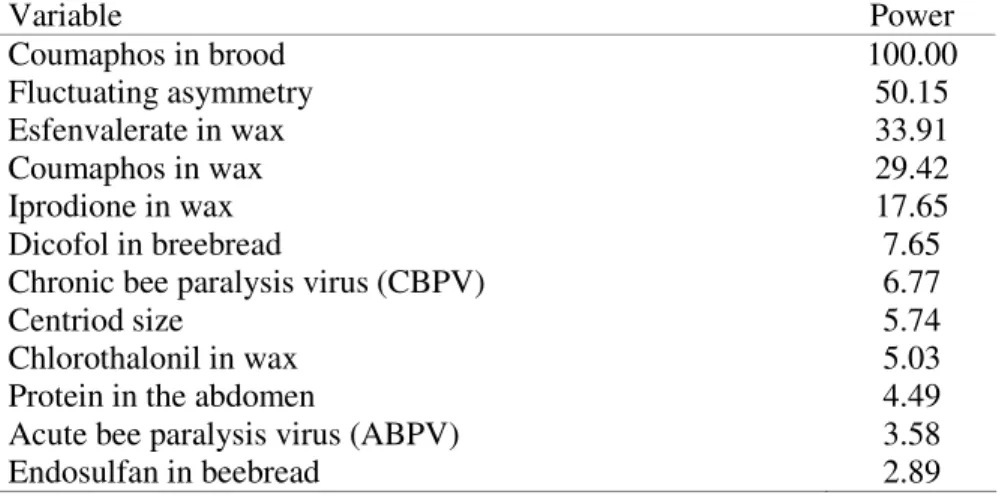
The CART analysis without a misclassification cost showed that coumaphos load in brood (p: 163
100.00) and the fluctuating asymmetry (p: 50.15) were the two predictor variables with the strongest 164
overall discriminating power (Table 1 and Figure 1). Generally, CCD colonies had lower levels of 165
coumaphos in brood and their adult bees were more symmetrical when compared to samples taken from 166
apparently healthy colonies. As indicated by having a discriminatory power of more than 15% , three 167
additional variables—that is, variables that did not act as nodes on the Regression tree (Figure 1)—also 168
had significant discriminating power: loads of esfenvalerate (p: 33.91), coumaphos (p: 29.42), and 169
iprodione (p: 17.65) in the wax (Table 1). Overall, the resulting tree (Figure 1) had a sensitivity of 65% 170
and a specificity of 87%. 171
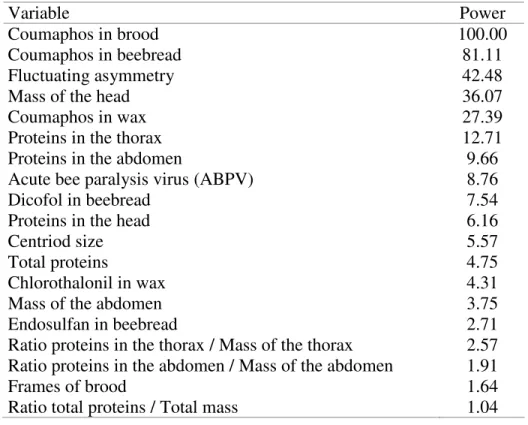
Classification and regression trees analysis with a cost of misclassification 172
When conducting the CART analysis with a misclassification cost of 2, at least five variables 173
distinguished themselves as most important: coumaphos in brood (p: 100.00), coumaphos in beebread (p: 174
81.11), fluctuating asymmetry (p: 42.48), mass of the head (p: 36.07), coumaphos in wax (p: 27.39), and 175
proteins in the thorax (p: 12.71; Table 2). Some of these variables did not act as splitting nodes in the 176
regression tree (Figure 2). As with the first model, the tree permitting misclassification first segregated 177
the study population based on coumaphos loads in bee brood. A majority of healthy colonies had 178
coumaphos loads in bee brood > 66 ppb. Both of the resulting branches were further split by three other 179
variables (Figure 2) and resulted in five terminal nodes, including one node that contained only CCD 180
colonies. Generally, this model revealed that when compared to CCD colonies, control colonies are best 181
characterized as having higher levels of coumaphos in brood, the adult bees were more asymmetrical, and 182
had heads with a greater mass. This entire tree had a sensitivity of 85% and a specificity of 59%. 183
184
4. DISCUSSION 185
In the United States, overwintering losses of honey bee colonies have averaged around 30% or 186
more over the winters 2006/2007, 2007/2008, and 2008/2009 (vanEngelsdorp et al. 2007, vanEngelsdorp 187
et al. 2008, vanEngelsdorp et al. 2010). While most operations identify known threats as the cause of 188
mortality (e.g., poor queens, colony starvation, and varroa mite parasitism), some of these losses shared 189
symptoms associated with CCD (specifically, no dead bees in affected colonies). Previous attempts to 190
find the cause of CCD failed to identify a single factor that explained all cases of CCD (Cox-Foster et al. 191
2007, Johnson et al. 2009b, vanEngelsdorp et al. 2009). In an attempt to better characterize CCD 192
following an initial descriptive (and monofactorial) study, we present here the results of a multifactorial 193
CART analysis. 194
The use of CART analysis in epidemiological studies permits the identification of risk factors that 195
are useful in disease diagnosis (Saegerman et al. 2004) as well as those that may play an important role in 196
disease occurrence (Thang et al. 2008). CART analysis is a valuable tool in epidemiological studies 197
because it generates a non-linear and non-parametric model. In addition, this approach is particularly 198
useful when, as in this case, the dataset includes missing values, because the CART model generates 199
surrogate data points based on relationships identified within the existing data (Saegerman et al. 2004, 200
Thang et al. 2008). 201
Among 55 variables used in our CART analysis, one variable stood out as the most important 202
when differentiating CCD from control colonies: coumaphos levels in brood. In both the tree with and 203
without a misclassification cost, colonies from control colonies had the highest level of coumaphos in 204
brood. 205
The presence of some pesticide products found in hives is not surprising (Bogdanov et al. 1998, 206
Tremolada et al. 2004, Martel et al. 2007). Coumaphos is the active ingredient found in varroa mite 207
control products widely used by U.S. beekeepers. This lipophilic product is known to accumulate in wax. 208
It is therefore not surprising that this product is found extensively in beekeeping operations both in the 209
U.S. and Europe (Mullin et al. 2010, vanEngelsdorp and Meixner 2010). Even one treatment of the 210
organophosphorus miticide coumaphos, marketed as CheckMite+TM (Bayer), can elevate coumaphos 211
levels in brood-chamber honey stores to 60 and 111 ppb (Karazafiris et al. 2008). The discriminatory 212
value of coumaphos in brood suggests that healthy colonies had mite populations that were more 213
aggressively or persistently controlled by the beekeepers. While varroa mite levels were not different 214
between CCD and control populations at the time of sampling (vanEngelsdorp et al. 2009), it is possible 215
that mite populations differed at some time prior to sample collection. CCD may therefore be a 216
consequence of elevated levels of mites—relative to mite levels in control colonies—some time prior to 217
sampling. Clearly, longitudinal studies that monitor the mite levels prior to the onset of CCD are needed 218
to quantify the effect of mite levels prior to colony collapse. 219
Coumaphos was initially selected as a mite control agent because of its relative low toxicity to 220
honey bees. Despite this low toxicity, chronic sub-lethal exposure to this product can have detrimental 221
effects on colony health (Pettis et al. 2004). Furthermore, the low toxicity of this product also relies, at 222
least in part, on the rapid detoxification of these miticides by the exposed bees (Johnson et al. 2009a). 223
Honey bees, as compared to other insects, have relatively few insecticide detoxifying genes (Claudianos 224
et al. 2006), which may in part explain why honey bees are relatively sensitive to pesticide exposure 225
(Atkins 1992). One gene family in particular, cytochrome P450 mono-oxygenase enzymes (P450), is used 226
by honey bees to detoxify coumaphos (Johnson et al. 2006, Johnson et al. 2009a). As a result, exposure to 227
both products (e.g., coumaphos and fluvalinate) simultaneously has a synergistic effect on toxicity 228
towards bees (Johnson et al. 2009a). While unproven, it does stand to reason that certain populations of 229
honey bees can vary in their tolerance of pesticide exposure as a result of differences in the expression of 230
detoxifying genes. Should this be the case, differences in pesticide resistance could explain the relative 231
importance of some pesticide loads in distinguishing CCD populations from control populations. In the 232
mono-factorial analysis, coumaphos and esfenvalerate in wax were consistently found at higher 233
concentrations in the control colonies (vanEngelsdorp et al. 2009). Pathogenic attack, specifically viral 234
attack, may arrest translation of proteins that mediate pesticide detoxification (Johnson et al. 2009b). 235
Alternatively, since sub-lethal pesticide exposure can increase susceptibility to pathogen attack 236
(Bendahou et al. 1997), it is possible that colonies afflicted with CCD are less tolerant to environmental 237
pesticide exposure and consequently are more susceptible to pathogen attack, which leads to collapse. 238
239
While higher levels of coumaphos may benefit colonies by controlling mite populations 240
(vanEngelsdorp et al. 2009), this hypothesis does not explain completely why pesticides not used in 241
beekeeping are important discriminating variables when distinguishing control colonies from CCD 242
colonies. As determined by the CART analysis (Tables 1 and 2), the pesticides that are important 243
distinguishing variables come from diverse classes such as coumaphos (an organophosphate), 244
esfenvalerate (a pyrethroid), dicofol (an organochlorine), iprodione and chlorthalonil (two fungicides), 245
and endosulfan (a cyclodiene). More work is needed to explain why some exogenous chemicals are 246
positively associated with CCD while others are negatively associated. 247
As in the current study, fluctuating asymmetry (FA) was found to discriminate between CCD and 248
non-CCD colonies in our earlier mono-factorial comparisons (vanEngelsdorp et al. 2009). In this current 249
effort, FA was an important discriminating factor in both CART models (without a misclassification cost: 250
2nd most predictive variable, p = 50.15; with a misclassification cost: 3rd most predictive variable, p = 251
42.48). FA, defined as random differences in the shape or size of a bilaterally symmetrical character 252
(Palmer and Strobeck 1986), can be an indicator of individual fitness (VanValen 1962) because 253
organisms exposed to stress during their development show less symmetry than unstressed organisms 254
(Tuyttens 2003). Average FA score of worker bees has previously been suggested as a measure of 255
colony level fitness (Schneider et al. 2003). While measuring fluctuating asymmetry is a less sensitive test 256
when it comes to differentiating control colonies from CCD colonies as compared to other variables, it is 257
a more practical test than expensive and time consuming pesticide analyses needed to determine 258
coumaphos levels in brood and beebread. It is not, however, as easily measured as some other 259
discriminating variables (such as head mass). The value of FA as a measure to predict colony health in 260
general and CCD in particular, warrants further investigation. 261
Head masses between of bees from CCD and non-CCD populations were not significantly 262
different overall (vanEngelsdorp et al. 2009). However, as a discriminating risk factor in CART model 263
with a cost of misclassification, head mass appears to be important. For instance, of the 31 individual 264
colonies that had low coumaphos levels in beebread (≤ 44 ppb), those from control colonies had heavier 265
heads (Figure 2). The heads of winter bees are about 15% lighter than the heads of summer bees (Meyer-266
Rochow and Vakkuri 2002), which may be the result of reduced hypopharyngeal gland size in winter bees 267
(Fluri et al. 1982) or because summer bees have larger brains (Meyer-Rochow and Vakkuri 2002). The 268
volume of certain brain regions, and presumably the mass of the total bee brain, also changes as summer 269
bees age, with antennal-lobes in forager bees being larger than 4 days old house bees (Brown et al. 2002). 270
As bees age, the size of their hypopharyngeal glands increases for one week and then decreases 271
(Crailsheim and Stolberg 1989). It is therefore possible that the increased head mass in healthy colonies 272
reflects the overall age profile of the bees sampled, as bees remaining in CCD colonies are thought to be 273
young (vanEngelsdorp et al. 2009). 274
The ability of individual pathogen loads to distinguish CCD and non-CCD colonies was minimal. 275
This confirms previous findings that none of the pathogens quantified by this effort can be implicated as 276
the sole “cause” of CCD. This is not to say, however, that disease agents play no role in CCD, as they 277
clearly do (Cox-Foster et al. 2007, Johnson et al. 2009b, vanEngelsdorp et al. 2009). The use of CART 278
analysis in epidemiological studies permits the identification of risk factors that are useful in disease 279
diagnosis (Saegerman et al. 2004) as well as those that may play an important role in disease occurrence 280
(Thang et al. 2008). This study is the first to apply this analytical tool to bee pathology in general and 281
CCD in particular. It is important to note that this study, being an epizootiological study, did not set out to 282
test a specific hypothesis (Koepsell and Weiss 2003) and so did not intend to identify the cause or causes 283
of CCD. Rather, the results of this analysis are intended to act as a guide for further epidemiological- and 284
hypothesis-driven research. To that end, the CART analysis presented here highlights several areas that 285
warrant further attention, including the effect that sub-lethal pesticide exposure may have on pathogen 286
prevalence, and the potential effect that tolerance to pesticides has on colony survivorship. This analysis 287
also provides further evidence that CCD is likely the result of several factors, acting in concert, which 288
together decrease colony fitness and make affected colonies more susceptible to disease. 289
290
ACKNOWLEDGMENTS 291
This research was funded by the National Honey Board and the USDA-ARS Areawide Program on bee 292
health, the Pennsylvania Department of Agriculture, Penn State Hatch funds, the North Carolina 293
Agriculture Foundation, a grant from the North Carolina Department of Agriculture & Consumer 294
Services, the National Research Initiative of the USDA Cooperative State Research, Education and 295
Extension Service grant number 2007-02281, and the University of Liege Belgium. 296
References Cited 297
298
Atkins, E. 1992. Injury to honey bees by poisoning, pp. 1155-1203. In J. M. Graham [ed.], The Hive and 299
the Honey Bee. Revised Edition. Bookcrafters, Hamilton, IL. 300
Bendahou, N., M. Bounias, and C. Fleche. 1997. Acute toxicity of cypermethrin and fenitrothion on 301
honeybees (Apis mellifera mellifera) according to age, formulations and (chronic paralysis 302
virus)/insecticide interaction. Journal of Environmental Biology 18: 55-65. 303
Bogdanov, S., V. Kilchenmann, and A. Imdorf. 1998. Acaricide residues in some bee products. Journal 304
of Apicultural Research 37: 57-67. 305
Breiman, I., J. H. Friedman, R. A. Olsen, and C. J. Stone. 1984. Classification and regression trees. 306
Wadsworth, Pacific Growe, CA. 307
Brown, S., R. Napper, C. Thompson, and A. Mercer. 2002. Stereological analysis reveals striking 308
differences in the structural plasticity of two readily identifiable glomeruli in the antennal lobes of 309
the adult worker honeybee. The Journal of Neuroscience 22: 8514-22. 310
Claudianos, C., H. Ranson, R. M. Johnson, S. Biswas, M. A. Schuler, M. R. Berenbaum, R. 311
Feyereisen, and J. G. Oakeshott. 2006. A deficit of detoxification enzymes: pesticide sensitivity 312
and environmental response in the honeybee. Insect Molecular Biology 15: 615-636. 313
Cox-Foster, D. L., S. Conlan, E. C. Holmes, G. Palacios, J. D. Evans, N. A. Moran, P. L. Quan, T. 314
Briese, M. Hornig, D. M. Geiser, V. Martinson, D. vanEngelsdorp, A. L. Kalkstein, A. 315
Drysdale, J. Hui, J. H. Zhai, L. W. Cui, S. K. Hutchison, J. F. Simons, M. Egholm, J. S. 316
Pettis, and W. I. Lipkin. 2007. A metagenomic survey of microbes in honey bee colony collapse 317
disorder. Science (Washington) 318: 283-286. 318
Crailsheim, K., and E. Stolberg. 1989. Influence of diet, age and colony condition upon intestinal 319
proteolytic activity and size of the hypopharyngeal glands in the honeybee (Apis mellifera L.). 320
Journal of Insect Physiology 35: 595-602. 321
Fluri, P., M. Luscher, H. Wille, and L. Gerig. 1982. Changes in weight of pharyngeal gland and 322
haemolymph titres of juvenile hormone, protein and vitellogenin in worker honey bees. Journal of 323
Insect Physiology 28: 61-68. 324
Haubruge, E., B. K. Nguyen, J. Widart, J.-P. Thomé, P. Fickers, and E. Depauw. 2006. Le 325
dépérissement de l’abeille domestique, Apis mellifera L., 1758 (Hymenoptera : Apidae) : faits et 326
causes probables. Notes fauniques de Gembloux 56: 3-21. 327
Johnson, R. M., Z. Wen, M. A. Schuler, and M. R. Berenbaum. 2006. Mediation of pyrethroid 328
insecticide toxicity to honey bees (Hymenoptera: Apidae) by cytochrome P450 monooxygenases. 329
Journal of Economic Entomology 99: 1046-1050. 330
Johnson, R. M., H. S. Pollock, and M. R. Berenbaum. 2009a. Synergistic interactions between in-hive 331
miticides in Apis mellifera. Journal of Economic Entomology 102: 474-479. 332
Johnson, R. M., J. D. Evans, G. E. Robinson, and M. R. Berenbaum. 2009b. Changes in transcript 333
abundance relating to colony collapse disorder in honey bees (Apis mellifera). Proceedings of the 334
National Academy of Sciences 106: 14790-14795. 335
Karazafiris, E., C. Tananaki, U. Menkissoglu-Spiroudi, and A. Thrasyvoulou. 2008. Residue 336
distribution of the acaricide coumaphos in honey following application of a new slow-release 337
formulation. Pest Management Science 64: 165-171. 338
Koepsell, T. D., and N. S. Weiss. 2003. Epidemiologic methods: Studying the occurrence of illness. 339
Oxford University Press, New York. 340
Martel, A. C., S. Zeggane, C. Aurières, P. Drajnudel, J. P. Faucon, and M. Aubert. 2007. Acaricide 341
residues in honey and wax after treatment of honey bee colonies with Apivar(R) or Asuntol(R)50. 342
Apidologie 38: 534-544. 343
Meyer-Rochow, V. B., and O. Vakkuri. 2002. Honeybee heads weigh less in winter than in summer: a 344
possible explanation. Ethology, Ecology & Evolution 14: 69-71. 345
Mullin, C. A., M. Frazier, J. L. Frazier, S. Ashcraft, R. Simonds, D. vanEngelsdorp, and J. S. Pettis. 346
2010. High levels of miticides and agrochemicals in North American apiaries: Implications for 347
honey bee health. PloS ONE 5: e9754. 348
Palmer, A. R., and C. Strobeck. 1986. Fluctuating asymmetry: measurement, analysis, patterns; 349
Augmented title: review. Annual Review of Ecology and Systematics 17: 391-421. 350
Pettis, J. S., A. M. Collins, R. Wilbanks, and M. F. Feldlaufer. 2004. Effects of coumaphos on queen 351
rearing in the honey bee, Apis mellifera. Apidologie 35: 605-610. 352
Saegerman, C., N. Speybroeck, S. Roels, E. Vanopdenbosch, E. Thiry, and D. Berkvens. 2004. 353
Decision support tools for clinical diagnosis of disease in cows with suspected bovine spongiform 354
encephalopathy. Journal of Clinical Microbiology 42: 172-178. 355
Schneider, S. S., L. J. Leamy, L. A. Lewis, and G. DeGrandi-Hoffman. 2003. The influence of 356
hybridization between African and European honey bees, Apis mellifera, on asymmetries in wing 357
size and shape. Evolution 57: 2350-2364. 358
Speybroeck, N., D. Berkvens, A. Mfoukou-Ntsakala, M. Aerts, N. Hens, G. v. Huylenbroeck, and E. 359
Thys. 2004. Classification trees versus multinomial models in the analysis of urban farming 360
systems in Central Africa. Agricultural Systems 80: 133-149. 361
Suman, P., Thys E., Mfoukou-Ntsakala A., Ali L., Ouedraogo M., Van den Bossche P., Van 362
Huylenbroeck G., Berkvens D., and N. Speybroeck. 2010. Methodology for assessing 363
determinants of manure use in urban areas of Africa. Waste Management Research 364
doi:10.1177/0734242X09356016. 365
Thang, N. D., A. Erhart, N. Speybroeck, L. Hung, T. Le Khanh, H. Cong Trinh, K. Pham Van, M. 366
Coosemans, and U. D'Alessandro. 2008. Malaria in central Vietnam: analysis of risk factors by 367
multivariate analysis and classification tree models. Malaria Journal 7: (30 January 2008). 368
Tremolada, P., I. Bernardinelli, M. Colombo, M. Spreafico, and M. Vighi. 2004. Coumaphos 369
distribution in the hive ecosystem: case study for modeling applications. Ecotoxicology 13: 589-370
601. 371
Tuyttens, F. A. M. 2003. Measures of developmental instability as integrated, A Posteriori indicators of 372
farm animal welfare: a review. Animal Welfare 12: 535-540. 373
vanEngelsdorp, D., and M. D. Meixner. 2010. A historical review of managed honey bee populations in 374
Europe and the United States and the factors that may affect them. Journal of Invertebrate 375
Pathology 103: S80-S95. 376
vanEngelsdorp, D., R. Underwood, D. Caron, and J. Hayes, Jr. 2007. An estimate of managed colony 377
losses in the winter of 2006-2007: a report commissioned by the Apiary Inspectors of America. 378
American Bee Journal 147: 599-603. 379
vanEngelsdorp, D., J. Hayes, Jr., R. M. Underwood, and J. Pettis. 2008. A survey of honey bee 380
colony losses in the U.S., Fall 2007 to Spring 2008. PLoS ONE 3: e4071. 381
vanEngelsdorp, D., J. H. Jr., R. Underwood, and J. S. Pettis. 2010. A survey of honey bee colony 382
losses in the U.S., fall 2008 to spring 2009. Journal of Apicultural Research 49: 7-14. 383
vanEngelsdorp, D., J. D. Evans, C. Saegerman, C. Mullin, E. Haubruge, B. K. Nguyen, M. Frazier, 384
J. Frazier, D. Cox-Foster, Y. Chen, R. Underwood, D. R. Tarpy, and J. S. Pettis. 2009. 385
Colony Collapse Disorder: A descriptive study. PloS ONE 4: e6481. 386
VanValen, L. 1962. A study of fluctuating asymmetry. Evolution 16: 125-142. 387
388 389
Table 1. Ranking of CCD colony risk factors by overall discriminatory power without a cost of 390
misclassifying a CCD-diagnosed colony as a non-CCD colony 391 392 Variable Power Coumaphos in brood 100.00 Fluctuating asymmetry 50.15 Esfenvalerate in wax 33.91 Coumaphos in wax 29.42 Iprodione in wax 17.65 Dicofol in breebread 7.65
Chronic bee paralysis virus (CBPV) 6.77
Centriod size 5.74
Chlorothalonil in wax 5.03
Protein in the abdomen 4.49
Acute bee paralysis virus (ABPV) 3.58
Endosulfan in beebread 2.89
Table 2. Ranking of CCD colony risk factors by overall discriminatory power with a cost of 2
394
for misclassifying a CCD-diagnosed colony as a non-CCD colony
395
Variable
Power
Coumaphos in brood
100.00
Coumaphos in beebread
81.11
Fluctuating asymmetry
42.48
Mass of the head
36.07
Coumaphos in wax
27.39
Proteins in the thorax
12.71
Proteins in the abdomen
9.66
Acute bee paralysis virus (ABPV)
8.76
Dicofol in beebread
7.54
Proteins in the head
6.16
Centriod size
5.57
Total proteins
4.75
Chlorothalonil in wax
4.31
Mass of the abdomen
3.75
Endosulfan in beebread
2.71
Ratio proteins in the thorax / Mass of the thorax
2.57
Ratio proteins in the abdomen / Mass of the abdomen
1.91
Frames of brood
1.64
Ratio total proteins / Total mass
1.04
397
Figure 1. Classification tree of the risk factors for CCD colonies without a cost of misclassifying a CCD-398
diagnosed colony as a non-CCD colony 399
400
Figure 2. Classification and regression tree of the risk factors for CCD colonies with a cost of 1.8 points 401
for misclassifying a CCD-diagnosed colony as a non-CCD colony 402