HAL Id: hal-02338664
https://hal.archives-ouvertes.fr/hal-02338664v2
Submitted on 31 Jan 2020
HAL is a multi-disciplinary open access
archive for the deposit and dissemination of
sci-entific research documents, whether they are
pub-lished or not. The documents may come from
teaching and research institutions in France or
abroad, or from public or private research centers.
L’archive ouverte pluridisciplinaire HAL, est
destinée au dépôt et à la diffusion de documents
scientifiques de niveau recherche, publiés ou non,
émanant des établissements d’enseignement et de
recherche français ou étrangers, des laboratoires
publics ou privés.
Chiroptical fingerprints to characterize lavender and
lavandin essential oils
Sofia Lafhal, Isabelle Bombarda, Nathalie Dupuy, Marion Jean, Kirstin Ruiz,
Pierre Vanloot, Nicolas Vanthuyne
To cite this version:
Sofia Lafhal, Isabelle Bombarda, Nathalie Dupuy, Marion Jean, Kirstin Ruiz, et al.. Chiroptical
fin-gerprints to characterize lavender and lavandin essential oils. Journal of Chromatography A, Elsevier,
2020, 1610, pp.460568. �10.1016/j.chroma.2019.460568�. �hal-02338664v2�
Contents lists available at ScienceDirect
Journal
of
Chromatography
A
journal homepage: www.elsevier.com/locate/chroma
Chiroptical
fingerprints
to
characterize
lavender
and
lavandin
essential
oils
Sofia
Lafhal
a,
Isabelle
Bombarda
a,
Nathalie
Dupuy
a, ∗,
Marion
Jean
b,
Kirstin
Ruiz
b,
Pierre
Vanloot
a,
Nicolas
Vanthuyne
b, ∗a Aix Marseille Univ, Avignon Université, CNRS, IRD, IMBE, Marseille, France b Aix Marseille Univ, CNRS, Centrale Marseille, iSm2, Marseille, France
a
r
t
i
c
l
e
i
n
f
o
Article history: Received 18 June 2019 Revised 9 September 2019 Accepted 24 September 2019 Available online 24 September 2019
Keywords:
Polarimetry Chemometrics Chiroptical detector Lavender essential oil PLS-DA
a
b
s
t
r
a
c
t
PolarimetricHPLCdetectorwasusedtoacquirechromatogramsforlavender/lavandinessentialsoils(EOs) ondifferentchiralstationaryphases.Amylosetris-(3,5-dichloro-phenylcarbamate)immobilizedonsilica allowedthebestseparationofthenumerouschiralphytomarkersandwasthususedtoobtaina chiropti-calfingerprintfor158samplesofFrenchlavender/lavandinEOs.Samplesfromdifferentvarieties(Abrial, Fine,Grosso,Maillette,Matherone,SumianandSuper)werecollectedoverthreecropyears(2012,2013 and2014),fromfourdifferentlocationsinFrance(“Alpes-de-Haute-Provence”,“Ardèche”,“Drôme” and “Vaucluse”)totakeintoaccountseasonalandgeographic originvariations.Thecombinationofthe po-larimetricfingerprintsandchemometricswastestedforvarietaldiscrimination.Weassessedtheability todiscriminatetheEOssamplesandtheirvarietybypartialleastsquares-discriminantanalysis(PLS-DA). Thiscasestudyshowed thatliquidchromatographywithpolarimetricdetectorintandemwith chemo-metricanalysiswasefficienttodifferentiatethevarietaloriginsofFrenchlavender/lavandinEOs.
© 2019 Elsevier B.V. All rights reserved.
1. Introduction
The first polarimetric chromatogram obtained in liquid chro- matography was reported in 1976 by Hesse and Hagel, who used a bench polarimeter to characterize the enantiomers of 2-phenyl- cyclohexanone separated on microcrystalline cellulose triacetate [1]. Since then, chiroptical detectors, i.e. polarimetric and circular dichroism (CD) detectors [2–4], were developed [5]and are nowa- days routinely used in HPLC on chiral support to identify and dif- ferentiate chiral molecules [6]. Moreover, chiroptical detectors can be applied to the determination of enantiomeric ratios on chi- ral stationary phases (CSPs) with baseline [7]or partial separation [8,9], but also on achiral support [10–13], to preparative purposes [14,15], and to the assignment of absolute configurations [16–18]. They have sometimes been used to characterize complex mixtures focusing on chiral components [19], because the analysis is simpli- fied by hiding achiral molecules, which are not sensed by chirop- tical detection. For instance, sugars in human urine were quanti- fied by polarimetric detection without chiral separation [20], enan- tiomeric ratios of lorazepam in human plasma were determined by
∗ Corresponding authors.
E-mail addresses: nathalie.dupuy@univ-amu.fr (N. Dupuy),
nicolas.vanthuyne@univ-amu.fr (N. Vanthuyne).
CD detection [21], and the absolute configuration of camphor was assigned in different Artemisia essential oils [22].
The chemical composition of an essential oil (EO) depends on the species, the origin, the cultivar, the harvest season, the ex- traction method and the nature of the vegetal material. The qual- ity and the authenticity of EOs are assessed by the quantification of several compounds, according to the monographs produced by International Organization for Standardization (ISO) or European Pharmacopeia [23]. These chemical components are often chiral, so the use of chiral markers [24] and the determination of enan- tiomeric excesses are crucial for the characterization of EO [25,26]. The aim of this study was to use polarimetric chromatograms to characterize French lavender EOs. Indeed, lavender (Lavandula
an-gustifolia) and lavandin (sterile hybrid of Lavandula angustifolia P.
Mill. ×Lavandulalatifolia (L.f.) Medikus) are widely grown for their essential oils (EOs) in Mediterranean Basin [27]. The 39 Lavan-dula species and their numerous hybrids are of great interest in fragrance and flavor industries [28]: the lavender EOs containing larger amount of linalool and linalyl acetate are raw materials in perfumes and cosmetics, those with higher percentage of camphor are used for their anti-inflammatory and antibacterial properties, whereas lavandin EOs are widespread in household cleaners. These useful properties of lavender EOs are related to the properties of each enantiomer of each chiral component, so that they may be biased by the stereochemical composition of the EO. However, the
https://doi.org/10.1016/j.chroma.2019.460568
2 S. Lafhal, I. Bombarda and N. Dupuy et al. / Journal of Chromatography A 1610 (2020) 460568 chiral compounds are not necessarily enantiopure in natural prod-
ucts [29], but they may occur as scalemic or racemic mixtures, thus indicating their formation by several biochemical pathways.
Lavender EOs are sometimes characterized by non- enantioselective techniques, such as gas chromatography [30], vibrational spectroscopies [31,32]or both [33]. Their chiral compo- nents can be studied, on one hand, by enantioselective GC, that is available since the early 90s [34], thanks to the enantioselectivity of cyclodextrin derivatives. Indeed, the separation by GC for the enantiomers of the main markers of lavender EOs has already been published [35–37]and recently optimized by flow modulated comprehensive two-dimensional GC to be used for quality control [38]. On the other hand, chiroptical vibrational spectroscopy has been used by our group to analyze the enantiomeric composition of the markers in Artemisia herba-alba EOs [39]. In the case of lavender EOs, preliminary tests proved that the intensity of the signal for vibrational and electronic circular dichroism spectra was too weak to be used.
To introduce an original way to characterize EOs, we focused on HPLC on chiral support with polarimetric detection. The principle of a polarimetric detector is to measure the angle of rotation of a linearly polarized light caused by the enantio-enriched molecule(s) in the cell, using one or several wavelength depending on the man- ufacturer. So, for a racemic mixture, two enantiomers separated on a chiral stationary phase (CSP), give signals of same area but op- posite signs, positive and negative. The intensity of the signal is related to the value of the rotatory power at the wavelength(s) used by the polarimetric detector, to the amount and to the enan- tiomeric excess (ee) of the chiral sample. Liquid chromatography with polarimetric detection has already allowed the determination of enantiomeric excesses for a single EOs component, firstly iso- lated from the other molecules: for menthyl acetate in peppermint oils [40] and carvone in caraway or spearmint oils [41]. The in- jection of a crude EO on a HPLC column able to separate even partially several chiral molecules, leads to a polarimetric chro- matogram with multiple positive and negative peaks, which can be considered as a chiroptical fingerprint of the mixture. Chemo- metrics analysis by Partial Least Squares-Discriminant Analysis re- gression (PLS-DA) of the polarimetric chromatograms was used to discriminate between the species of essential oils studied (laven- der and lavandin) and their varieties (Fine, Maillette, Matherone, Abrial, Grosso, Sumian, Super). Lavender/lavandin EOs are good candidates because they contain mainly chiral compounds (80–90% of the total composition); ( −)-(R)-linalyl acetate, ( −)-(R)-linalool, ( +)-( R)-camphor, ( +)-( R)-borneol, ( +)-( S)-terpinen-4-ol and ( −)-( R)-lavandulol have been detected with high enantiomeric purities in lavender/lavandin EOs [36,42].
2. Materialandmethods
2.1.Essentialoilsamples
EOs obtained by steam distillation were provided by local French producers: 158 samples were analyzed including 94 la- vandin oil samples and 64 lavender oil samples over 3 years of harvests (2012, 2013 and 2014), various varieties and various French collect areas (“Alpes-de-Haute-Provence” (04), “Ardèche” (07), “Drôme” (26) and “Vaucluse” (84)). The lavender/lavandin EOs studied were [ Lavandulaangustifolia Miller] (lavender) and its hy- brid [ Lavandulaangustifolia Miller × Lavandulalatifolia Linnaeus fils Medikus] (lavandin) type France; they were divided into varieties: Fine (FI, n=21), Maillette (MA, n=27) and Matherone (MT, n=16) varieties for lavender samples and Abrial (AB, n=16), Grosso (GR, n= 37), Sumian (SU, n= 19) and Super (SP, n= 22) varieties for la- vandin samples.
2.2. Purestandardsubstances
Pure standard substances were purchased from Alfa Aesar for ( −)-borneol, ( +)- and ( −)-camphor; from Sigma Aldrich for ( +)- borneol, ( −)-limonene,
β
-myrcene, cis- and trans-β
-ocimene, ( −)- terpinen-4-ol and 3-octanone; from Fluka for ( −)-linalool, racemic linalool, ( +)-terpinen-4-ol and ( +)-limonene; from Adrian for racemic lavandulyl acetate; from France lavande for racemic linalyl acetate; from TCI Europe for ( −)-β
-caryophyllene; and from Merck for eucalyptol, racemicα
-terpineol and ( −)-α
-terpineol.( −)-Linalyl acetate was synthesized from ( −)-linalool (95% GC purity, 90% ee) by esterification in basic medium following Vidari procedure [43]. Then ( −)-linalyl acetate was purified by prepara- tive HPLC ( >99% GC purity, >99% ee) with a Chiralpak IE column (250 × 10mm, amylose tris-(3,5-dichloro-phenyl-carbamate), Chiral Technologies Europe).
Racemic lavandulol (95% GC purity) was obtained from racemic lavandulyl acetate (94% GC purity) by hydrolysis in basic medium. ( +)- and ( −)-Lavandulol were then isolated by preparative HPLC ( >96% ee for each enantiomer) with Lux-Cellulose-2 column (250 × 10 mm, cellulose tris-(3-chloro-4-methyl-phenyl-carbamate), Phenomenex).
2.3. Chiralgaschromatographyanalysis
An Agilent Technologies gas chromatograph (7890A) was used with a flame ionization detector (FID), and a Rt®-
β
Dex se capil-lary column Restek (30 m × 0.25 mm, 0.25 μm film thickness). The data acquisition and processing were performed using the Chem- station B.04.03 - SP1 (87) (Agilent) software. 1 μL of diluted essen- tial oil (30 μL in 1.5 mL of ethanol) was injected. Oven temperature was programmed 1 min at 40 °C, then 40 to 120 °C (1 °C.min −1), then 120 to 170 °C (5 °C.min −1), and held at final temperature for 20 min. Injector and detector temperatures were set at 220 °C. Hy- drogen was the carrier gas at a flow rate of 4 mL.min −1. Linear re- tention indices were calculated with reference to n-alkanes (C8– C24).
GC–MS analyses were performed on a 7890A GC system cou- pled to a 5975C VL mass spectrometer detector (Agilent Tech- nologies) equipped with a Rt®-
β
Dex se capillary column Restek(30 m × 0.25 mm, 0.25 μm film thickness). Data acquisition and pro- cessing were performed using the MSD Chemstation E.01.01.335 (Agilent) software. 1 μL of diluted essential oil (30 μL in 1.5 mL of ethanol) was injected. The experimental conditions developed in the laboratory were the same that GC analysis except for injector and detector temperatures (250 °C); carrier gas (helium); ioniza- tion voltage 70 eV; electron multiplier, 1 kV.
Compound identification was done by comparison of their mass spectra with those of Wiley275 and NIST05a libraries as well as by comparison of their retention indices with those of authentic samples. EOs compositions were given as relative area percentages.
2.4. HPLCoverchiralstationaryphases
Different chiral stationary phases for HPLC were screened on Merck-Lachrom chromatographic units, controlled by the EZChrom Elite software, with a pump model L-2130, an autosampler model L-2200, an oven model L-2350 and a Jasco OR-1590 online po- larimeter detector. The analytical solvents (heptane/isopropanol, 95:5, v/v, 1 mL min −1, 25 °C) with HPLC grade are commercially available from VWR. They are degassed prior to use and filtered through Millipore membranes type HV/0.45 μm. Essential oils were analyzed with a concentration of 10 mg/mL and the standards were recorded with a concentration of 3 mg mL −1, both with 20 μL as injection volume.
The 16 tested columns are Chiralpak IA, IB, IC, ID, IE, IF, AD-H, AS-H, AZ-H and Chiralcel OD-3, OJ-H (250 × 4.6mm, Chiral Tech- nologies Europe, Illkirch, France), Lux-Cellulose-2, Lux-Cellulose- 4, Lux-Amylose-2 (250 × 4.6mm, Phenomenex, Le Pecq, France) and ( S,S)-Ulmo, ( S,S)-Whelk-O1 (250 × 4.6 mm, Regis Technologies, Morton Grove, USA).
2.5. Chemometricsanalysis
2.5.1. Datatreatment
The HPLC data were transformed with linear baseline correction to remove baseline variation.
2.5.2. Principalcomponentanalysis(PCA)andpartialleastsquare
regression(PLS)
Principal component analysis (PCA) and Partial least squares (PLS) regression are two tools currently used in chemometrics and were described in a previous study [31,33].
2.5.3. Software
Chemometrics analysis was performed using Unscrambler X V.10.3 (CAMO/Software, Oslo, Norway).
3. Resultsanddiscussion
After a classical determination of the EOs chemical composition by gas chromatography, the choice of chromatographic conditions compatible with the use of polarimetric detector is detailed. The chiral markers thus highlighted on a polarimetric chromatogram were used to discriminate between the varieties of lavender / la- vandin EOs thanks to chemometrics.
3.1. Chemicalandenantiomericcompositionofthelavenderand
lavandinEOsstudied
The lavender and lavandin essential oils contain 15 main molecules (see Supp. Data for chemical structures), including 10 chiral ones. Gas chromatography analyses on 2,3-di- O-ethyl-6- O- tert-butyl-dimethylsilyl
β
-cyclodextrin gave the chemical compo- sition and the enantiomeric ratios of the 158 EOs according to the AFNOR norms (See Supp. Data for typical chromatograms and AFNOR norms). Compound identifications were done using reten- tion indices and co-elution with standards of the 15 compounds investigated. Variations in composition, mean values and ranges are reported for lavender EOs in Table 1and for lavandin EOs in Table2.( −)-Linalool (13.11–53.73%) and ( −)-linalyl acetate (17.34– 54.89%) were the main constituents and their enantiomeric com- position was in accordance with literature [36,38,44]: linalyl ac- etate was found with high ee ( >99%), while the two enan- tiomers of linalool were confirmed in all the varieties studied (ee between 88 and 94%). Enantiomeric distribution of linalyl ac- etate and linalool, the main compounds of lavender/lavandin EOs were already used to identify adulteration [45]. ( + )-Camphor, ( −)- lavandulyl acetate, ( −)-lavandulol and ( +)-
α
-terpineol were also found in high enantiomeric purity (ee >99% ee); their enantiomers: ( −)-camphor (retention indice RI: 1178), ( + )-lavandulyl acetate (RI: 1309), ( +)-lavandulol (RI: 1291) and ( −)-α
-terpineol (RI: 1342), have not been detected in EOs. This enantiopurity is a character- istic of Mediterranean EOs as already reported by Mosandl and coll. [36], and then by Flores et al. [44], but is lost in the Austrian Lavender oil sold by Sigma-Aldrich, as shown by Sandra and coll. [38], with only 87%, 84% and 36% ee for camphor, lavandulol andα
-terpineol, respectively. In the case of terpinen-4-ol, the presence of the 2 enantiomers was observed (92 to 98% ee) except in AB and SP varieties where ( +)-terpinen-4-ol has high enantiomeric purity ( >99% ee). In our analytical conditions, eucalyptol, ( + )- and ( −)- limonene were co-eluted and ( +)- and ( −)-borneol were partially separated.3.2.ChoiceoftheHPLCstationaryphase
An efficient description of an EO with a chiroptical detection requires multiple, thin and intense signals from its chiral com- ponents. For not enantiopure component, the use of chiral sta- tionary phases rather than achiral ones doubled the number of potential observed peaks. Indeed, even in the case of very poor enantiomers separation, two opposite polarimetric signals should be distinguished [46,47]. Normal phase conditions on CSPs were chosen, allowing retention for the 8 oxygenated chiral compounds, which account for more than 90% of all chiral components: only limonene and
β
-caryophyllene were not retained. So, 16 different chiral stationary phases were screened in normal phase in order to obtain polarimetric traces containing as much information as pos- sible, i.e. the maximum of positive and negative peaks. One sam- ple of each variety of lavender/lavandin EOs (AB, FI, GR, MA, MT, SU and SP) was injected on the 16 CSPs and isocratically eluted with a binary mixture heptane / isopropanol (95:5, v/v) (See Supp. Data for the chromatograms of Abrial lavandin EO). On polarimet- ric detector, the first signals observed, between 3 and 3.5 min in our case, corresponds to the injection peak with unretained com- pounds that were not considered in this study. On each of theTable 1
Chemical composition of lavender EO varieties (GC%).
Peak : RI a Compounds Fine ( n = 21) Maillette ( n = 27) Matherone ( n = 16) Lavender ( n = 64) Min Max Mean Min Max Mean Min Max Mean Min Max Mean
1 : 997 Eucalyptol, ( + )- and ( −)-limonene ∗ 0.28 1.44 0.71 0.00 0.53 0.11 0.83 1.93 1.26 0.00 1.93 0.69
2 : 1009 β-Myrcene 0.30 0.93 0.50 0.00 1.65 0.43 0.33 0.83 0.54 0.00 1.65 0.49 3 : 1051 3-Octanone 0.37 1.59 0.88 0.89 2.56 1.59 0.17 0.88 0.43 0.17 2.56 0.97 4 : 1080 cis - β-Ocimene 2.72 7.72 4.90 1.04 4.18 1.95 4.15 8.73 6.68 1.04 8.73 4.51 5 : 1083 trans - β-Ocimene 2.15 5.19 3.70 0.48 4.19 1.31 6.85 14.38 9.42 0.48 14.38 4.81 6 : 1185 ( + )-Camphor ∗ 0.00 1.10 0.23 0.17 0.85 0.43 0.00 0.36 0.15 0.00 1.10 0.27 7 : 1211 ( −)-Linalool ∗ 19.33 32.94 28.51 24.36 53.73 41.65 13.11 27.07 20.36 13.11 53.73 30.17 8 : 1228 ( + )-Linalool ∗ 0.69 2.36 1.42 0.88 3.44 1.81 0.59 2.09 1.30 0.59 3.44 1.51
9 : 1244 ( −)-Borneol ∗and ( + )-borneol ∗ 0.82 1.61 1.14 0.86 2.06 1.62 0.32 1.20 0.69 0.32 2.06 1.15
10 : 1270 ( −)-Linalyl acetate ∗ 37.11 48.51 41.90 34.27 54.89 43.66 38.72 49.42 42.89 34.27 54.89 42.82 11 : 1278 ( + )-Terpinen-4-ol ∗ 2.50 8.36 4.40 0.00 1.74 0.38 1.29 2.65 2.00 0.00 8.36 2.26 12 : 1287 ( −)-Terpinen-4-ol ∗ 0.00 0.29 0.03 0.00 0.21 0.01 0.00 0.27 0.05 0.00 0.29 0.03 13 : 1301 ( −)-Lavandulyl acetate ∗ 2.75 11.39 4.95 0.00 2.14 0.69 2.89 8.29 5.83 0.00 11.39 3.82 14 : 1320 ( −)-Lavandulol ∗ 0.56 2.26 1.07 0.00 1.42 0.18 0.56 4.49 1.63 0.00 4.49 0.96 15 : 1349 ( + )- α-Terpineol ∗ 0.00 0.93 0.45 0.00 1.18 0.53 0.00 0.94 0.46 0.00 1.18 0.48 16 : 1414 ( −)- β-Caryophyllene ∗ 3.72 6.26 5.21 2.76 6.16 3.63 5.27 7.35 6.32 2.76 7.35 5.05 a RI : Retention indices on Rt®- βDex
4 S. Lafhal, I. Bombarda and N. Dupuy et al. / Journal of Chromatography A 1610 (2020) 460568 Ta b le 2 Chemical com p osition of la v a ndin EO va ri e ti e s (GC%). Pe a k : RI a Compounds Abrial ( n = 16 ) Gr osso ( n = 37 ) Super ( n = 19 ) Sumian ( n = 22) La v a ndin ( n = 94 ) Min Max Mean Min Max Mean Min Max Mean Min Max Mean Min Max Mean 1 : 997 Eucal y p tol, ( + and ( − )-limonene ∗ 6.35 10.67 8.18 3.18 8.00 5.38 2.34 3.59 2.82 2.50 10.34 6.49 2.34 10.67 5.72 2 : 1009 β -Myr cene 0.35 0.58 0.49 0.41 0.81 0.59 0.41 1.13 0.63 0.39 0.64 0.52 0.35 1.13 0.56 3 : 1051 3-Oct anone 0.14 0.37 0.24 0.00 0.11 0.00 0.44 1.17 0.76 0.12 1.47 0.91 0.00 1.47 0.48 4 : 1080 cis - β -Ocimene 1.23 3.33 2.62 1.23 2.25 1.66 1.26 3.06 1.83 1.44 4.55 3.09 1.23 4.55 2.30 5 : 1083 tr ans - β -Ocimene 0.49 5.09 3.20 0.15 0.46 0.31 1.01 2.79 1.75 0.50 3.08 1.97 0.15 5.09 1.81 6 : 1185 ( + )-Camphor ∗ 9.17 11.18 10.24 6.59 9.65 7.69 4.43 6.21 5.15 3.38 10.26 6.65 3.38 11.18 7.43 7 : 1211 ( − )-Linalool ∗ 33.81 40.20 36.76 30.10 40.81 35.61 31.12 40.50 36.42 37.56 50.94 45.25 30.10 50.94 38.51 8 : 1228 ( + )-Linalool ∗ 0.84 1.41 1.21 0.91 2.49 1.60 1.04 3.03 1.83 1.08 1.79 1.48 0.84 3.03 1.53 9 : 1244 ( − )-Borneol ∗and ( + )-borneol ∗ 2.48 3.71 3.21 2.67 4.55 3.45 2.46 4.56 3.59 2.39 8.68 6.52 2.39 8.68 4.19 10 : 1270 ( − )-Linal y l ace tat e ∗ 23.85 32.03 27.43 27.21 40.53 33.80 36.34 47.30 40.39 17.34 32.11 23.10 17.34 47.30 31.18 11 : 1278 ( + )-T e rpinen-4-ol ∗ 0.54 1.60 0.99 2.09 5.52 3.78 0.00 1.02 0.31 0.00 3.86 0.75 0.00 5.52 1.46 12 : 1287 ( − )-T e rpinen-4-ol ∗ 0.00 0.00 0.00 0.00 0.33 0.11 0.00 0.00 0.00 0.00 0.22 0.03 0.00 0.33 0.03 13 : 1301 ( − )-La v a ndul y l ace tat e ∗ 1.41 2.09 1.72 1.62 3.27 2.60 0.83 2.27 1.55 0.00 1.92 0.63 0.00 3.27 1.62 14 : 1320 ( − )-La v a ndulol ∗ 0.44 1.12 0.79 0.43 1.57 0.77 0.15 1.00 0.44 0.00 1.45 0.26 0.00 1.57 0.56 15 : 1349 ( + )-α -T erpineol ∗ 0.34 0.71 0.56 0.25 1.21 0.69 0.18 1.28 0.67 0.42 0.83 0.65 0.18 1.28 0.64 16 : 1414 ( − )-β -Car y o ph y llene ∗ 1.86 2.86 2.36 1.57 2.46 1.95 1.52 2.37 1.85 1.29 2.69 1.70 1.29 2.86 1.96 a RI : Re te n ti o n indices on Rt®-β De x se capillar y column.
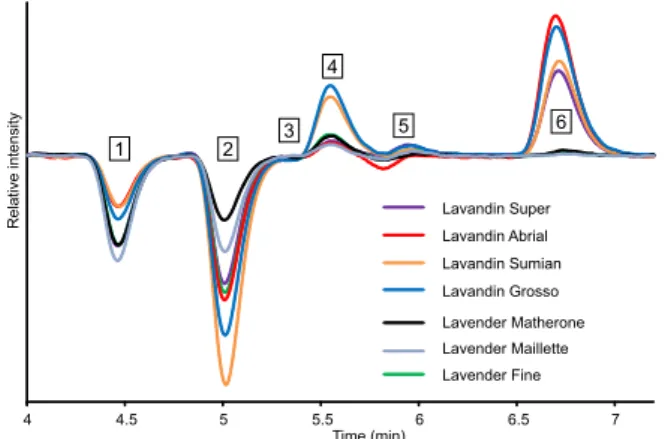
Fig. 1. Typical chromatograms of lavender/lavandin essential oils showing six char- acteristic areas using chiral HPLC (Chiralpak IE, heptane/2-PrOH 95/5, 1 mL min −1 ,
25 °C) equipped with polarimetric detection.
16 chromatograms, two intense peaks, positive and negative, were distinguishable, more or less separated, with different elution or- der, accompanied by weaker signals on some columns. For in- stance, five distinct peaks were obtained between 4 and 7 min on Chiralpak IE, as shown in Fig.1. Moreover, the intensities of these chiral markers vary depending on the lavender and lavandin EOs, so Chiralpak IE was chosen to pursue our goal to use polarimetric chromatograms to study French lavender EOs.
3.3. Identificationofthechiralmarkersinvolved
For each pure standard substance, the polarimetric chro- matogram was registered by injecting 60 μg on Chiralpak IE with heptane/isopropanol (95:5, v/v) as mobile phase. Eucalyptol, 3- octanone,
β
-myrcene, cis- and trans-β
-ocimene, the five achiral standards, gave no signal as expected. However, it was important to check that these compounds did not induce refractive index artefacts [48,49], i.e. pseudo-rotation signals caused by variation in the refractive index of the eluent, that might interfere with the study. Limonene andβ
-caryophyllene, the two non-oxygenated chiral molecules, were not retained in the normal phase conditions used. The first four minutes of the polarimetric chromatogram, corresponding to column dead time and to injection peak and to unretained compounds, were not considered in the chemometrics treatment.The main chiral components were eluted between 4 and 7.2 min, their corresponding polarimetric chromatograms are over- laid in Fig.2. In fact, the enantiomers of linalyl acetate, lavandulyl
Fig. 2. Polarimetric chromatograms (Chiralpak IE, heptane/2-PrOH 95/5, 1 mL min −1 , 25 °C) of the main chiral standards components of lavender/lavandin
essential oils: ( −)-linalyl acetate, racemic linalool, ( + )-lavandulol, ( −)-lavandulol, ( + )-terpinen-4-ol with ee = 50%, ( −)-borneol, ( + )-borneol, ( S )-( −)- α-terpineol, ( + )-camphor and ( −)-camphor.
Fig. 3. Polarimetric fingerprints on Chiralpak IE for 10 different batches of Matherone lavender essential oils (heptane/2-PrOH 95/5, 1 mL min −1 , 25 °C).
acetate, lavandulol,
α
-terpineol and camphor were not separated on this chiral stationary phase. Chiralpak IE was only able to base- line separate ( +) and ( −)-terpinen-4-ol (α
=1.19), and poorly the enantiomers of linalool (α
=1.13) and borneol (α
= 1.03). So, this method based on polarimetric detection did not require the enan- tiomers separation to discriminate between EOs in our case. Re- tention times, relative intensities and specific rotations at 589 nm from literature are given for the chiral standards in Supplemen- tary Data. The intensity of the polarimetric signal given by the de- tector for an enantiomer depends on the magnitude of the op- tical rotatory dispersion. Indeed, the polarimetric detector used, Jasco OR-1590, has a multiple wavelength based operating mode: the signal results from the addition of the optical rotation contri- butions at wavelengths between 350 and 900 nm, the main con- tributions coming from the emission lines of the mercury lamp (365, 405, 436, 546 and 578 nm). This operating mode explains why the enantiomers with low specific rotation at 589 nm, like linalyl acetate or lavandulol, are easily detected and give work- able signal. However, lavandulyl acetate has an optical rotatory dispersion that is too weak to obtain an available polarimetric trace.Thanks to the seven remaining chiral components used as markers, six characteristic areas could be distinguished. For each area, the intensity of the observed sign was related to the amount, enantiomeric excess and optical rotatory dispersion of the corre- sponding compounds. The first area, labeled 1, shows a large neg- ative peak for the EOs and corresponds to the co-elution of ( +/ −)-linalyl acetate, which have a small response but is present in large quantities, between 17 and 55%. Linalool is eluted in the area la- beled 2, with a medium negative peak for enantiopure ( −)-linalool but two separated positive and negative signals for the racemate. The intensity is lower for the racemate because the enantiomers are not baseline separated: the positive and negative peaks over- lap, leading to a loss of polarimetric signal ( Fig. 1). In the EOs, linalool is abundant, between 17 and 57%, and has a high enan-
tiomeric purity, ( −/+) ratio between 37/3 and 94/6: a large nega- tive peak is so obtained in the area labeled 2 ( Fig. 2). Lavandulol enantiomers are co-eluted in the area labeled 3, with a small po- larimetric signal, due to its low specific rotation. Moreover, most of the EOs studied contains less of 2% of lavandulol, so no sig- nal was observed in the area 3. It should be noted that for the only two Matherone lavender EOs with ( −)-lavandulol contents of 4%, the negative polarimetric signal is clearly noticeable ( Fig. 3), underlining the sensitivity of the method. In the area labeled 4, ( +)-terpinen-4-ol, ( +) and ( −)-borneol are eluted. ( +)-Terpinen-4- ol has a very high enantiomeric purity (ee > 99%) and its con- tent in the EOs ranges between 0 and 8.36%. So that a positive peak is apparent on this area of the polarimetric chromatogram of each EO studied. Furthermore, this positive peak overlaps with the signal of ( + )-borneol. Just following in this area, a small nega- tive peak corresponds to the elution of ( −)-borneol, which is thus evidenced in some Matherone lavender EOs ( Fig.3) and Abrial la- vandin EOs (See Supp. Data). The enantiomers of
α
-terpineol are co-eluted at 5.90 min in the area labeled 5. This component has a large polarimetric response but the ( +)-enantiomer is present at less than 1.28% in the EOs studied, so that only a small posi- tive peak is in this area. The area labeled 6 is characteristic of the amount of ( +)-camphor in the EOs, since ( +)-camphor is enan- tiopure and give a strong polarimetric signal between 6.5 and 7 min.The polarimetric chromatogram obtained on Chiralpak IE can thus be considered as a chiroptical fingerprint of the EOs. Fig. 3 displays ten polarimetric fingerprints for different Math- erone lavender EOs and allows comparing qualitatively their chem- ical and enantiomeric composition. For instance, the ten Math- erone EOs differ according to the amount of ( −)-linalyl acetate and ( −)-linalool; some of them contains a small amount of ( −)-linalool, ( −)-lavandulol or ( −)-borneol. These polarimetric finger- prints, showing significant variations between lavender/lavandin EOs, could be utilized for varieties differentiation.
6 S. Lafhal, I. Bombarda and N. Dupuy et al. / Journal of Chromatography A 1610 (2020) 460568
Fig. 4. Discrimination of lavender essential oils and lavandin essential oils. Score plot for the first and second components of the Principal component analysis (PCA) model of polarimetric fingerprints (Chiralpak IE column) with a linear baseline correction. AB: Abrial, FI: Fine, GR: Grosso, MA: Maillette, MT: Matherone, SP: Super and SU: Sumian.
3.4.Assessmentofthedifferencesinchemicalcompositionby
principalcomponentanalysis
The first and two components (PC1/PC2) of the PCA carried out on polarimetric fingerprints represent 92% of the total chro- matographic variance ( Fig. 4). The lavender and lavandin groups are separated on the first component (PC1), lavender is negatively projected while lavandin is positively projected except SP variety which is partially negatively projected but near the center. PC1 also allows the separation of lavender and lavandin varieties. PC1 can be described positively with linalyl acetate and camphor con- tents; and negatively with linalool content ( Figs. 4 and 5). If we compare with GC data obtained previously [31], lavandin EOs have high ( +)-camphor content, low ( −)-linalyl acetate and high ( −)-linalool content compared to lavender. MT variety has low ( +)- camphor content (0.15%) compared to AB variety (10.24%). As it was observed previously, there is a gradient of camphor content in relation to PC1 (MT (0.15%) < FI (0.23%) < MA (0.43%) < SP (5.15%) < SU (6.65%) < GR (7.69%) < AB (10.24%)). PC2 allows sepa- ration of SU variety and lavender varieties. PC2 can be described by linalool content. SU variety has high ( −)-linalool content (45.25%). MT variety has low ( −)-linalool content (20.36%) compared to MA variety (41.65%). As it was observed previously, there is a gradi- ent of linalool content in lavender varieties in relation to PC2 (MT (20.36%) < FI (28.51%) < MA (41.65%)).
3.5.Discriminationoflavender/lavandinEOsbyPLS1-DA
The prediction results are given in Table 3 for the 52 laven- der/lavandin EOs recognition. To build all PLS1-DA models, 106 samples were used: (FI, n=14), (MA, n=18), (MT, n=10), (AB, n=11), (GR, n=25), (SU, n=15) and (SP, n=13) and the valida- tion step was performed by full cross- validation. To test the per- formance of the models in prediction, 52 samples were used: (FI, n=7), (MA, n=9), (MT, n=6), (AB, n=5), (GR, n=12), (SU, n=6) and (SP, n= 7). For best prediction performance and to classify samples, the PLS1-DA regression models were built from linear baseline polarimetric fingerprints. In the step 1, the discrimination between the lavender/lavandin EOs was studied. The results were good, with 100% of correct classification with only 4 latent vari- ables. In the step 2, the seven varieties were discriminated. Very good results were obtained for AB, GR (one false positive sample), SP (one false negative sample) and MA varieties with a percentage
Fig. 5. Discrimination of lavender/lavandin essential oils. Loading plot for the first and second components of the Principal component analysis (PCA) model of polari- metric fingerprints with a linear baseline correction.
of correct classification between 96 and 100%. Good results were obtained for SU (two false negative samples) and MT (two false negative samples) varieties with a percentage of correct classifica- tion equal to 93%. Finally, FI variety (three false negative samples and one false positive sample) gives a percentage of correct classi- fication equal to 86%. This low result can be explained by the fact that this variety comes from the lavender plant which grows spon- taneously also called “wild lavandula”.
Ta b le 3 Classification matrix obt a ine d in pr e diction (PL S -D A) of la v e nder and la v a ndin va ri e ti e s es ta blishe d fr om linear baseline polarime tric fing e rprint s (Chir alpak IE column). Varie ty N umb er of lat e nt v a riables AB ( n = 5 ) GR ( n = 12 ) SP ( n = 7) SU ( n = 6) FI ( n = 7) MA ( n = 9) MT ( n = 6) Fa ls e - neg a ti v e sam ples Fa ls e - positi v e sam ples la v a ndin AB 5 5 0 0 0 0 0 0 0 0 GR 12 0 12 0 1 0 0 0 0 1 SP 6 0 0 6 0 0 0 0 1 0 SU 4 0 0 0 4 0 0 0 2 0 la v e nder FI 11 0 0 0 0 4 0 1 3 1 MA 10 0 0 0 0 0 9 0 0 0 MT 7 0 0 0 0 0 0 4 2 0 4. Conclusion
Polarimetric detection combined with chemometric analysis en- abled to differentiate lavender and lavandin essential oils and their varieties (Abrial, Grosso, Sumian, Super, Fine, Maillette and Math- erone), which were very well predicted with a percentage of cor- rect classification of 100% for lavender/lavandin and between 93 and 100% for their varieties except for FI variety (86%), consid- ering each lavender plant as a variety. According to chemometric analysis, the varieties are mainly discriminated by their content of ( + )-camphor and ( −)-linalool. The analysis time takes 8 min with HPLC, but could be shortened by using UPLC. This work also em- phasizes the usefulness of chiroptical detectors whose sensitivity can be further improved to extend their scope, and the interest to develop UPLC chiroptical detectors.
DeclarationofCompetingInterest None.
Acknowledgment
The authors are grateful to the “Société Coopérative Parfums Provence Ventoux”, “Société Coopérative des Plantes à Parfums de Provence” and “France Lavande”, for providing samples of laven- der/lavandin essential oils. Authors are thankful to AMU and CNRS for their financial support.
Supplementarymaterial
Supplementary material associated with this article can be found, in the online version, at doi: 10.1016/j.chroma.2019.460568. References
[1] G. Hesse , R. Hagel , Chromatographic resolution of racemates, Liebigs Ann. Chem. (1976) 996–1008 .
[2] L. Kott , W.B. Holzheuer , M.M. Wong , G.K. Webster , An evaluation of four com- mercial HPLC chiral detectors: a comparison of three polarimeters and a circu- lar dichroism detector, J. Pharmaceut. Biomed. 43 (2007) 57–65 .
[3] A. Mannschreck , D. Andert , A. Eiglsperger , E. Gmahl , H. Buchner , Chiropti- cal detection - novel possibilities of its application to enantiomers, Chro- matographia 25 (1988) 182–188 .
[4] J. Zukowski , Y.B. Tang , A. Berthod , D.W. Armstrong , Investigation of a cir- cular-dichroism spectrophotometer as a liquid-chromatography detector for enantiomers - sensitivity, advantages and limitations, Anal. Chim. Acta 258 (1992) 83–92 .
[5] D.K. Lloyd , D.M. Goodall , Polarimetric detection in high-performance liq- uid-chromatography, Chirality 1 (1989) 251–264 .
[6] N. Vanthuyne , C. Roussel , Chiroptical detectors for the study of unusual phe- nomena in chiral chromatography, Top. Curr. Chem. 340 (2013) 107–151 .
[7] S.W. Linder , G.W. Yanik , D.R. Bobbitt , Evaluation of laser-based polarimetry for the determination of enantiomeric excess (ee) at the extremes of the ee scale, Microchem. J. 76 (2004) 105–112 .
[8] A. Mannschreck , M. Mintas , G. Becher , G. Stuhler , Liquid-chromatography of enantiomers: determination of enantiomeric purity in spite of extensive peak overlap, Angew. Chem. 19 (1980) 469–470 .
[9] R. Kiesswetter , F. Brandl , N. Kastner-Pustet , A. Mannschreck , Chiroptical de- tection during liquid chromatography: deconvolution of overlapping peaks of enantiomers and its applications, Chirality 15 (2003) S40–S49 .
[10] B.H. Reitsma , E.S. Yeung , High-performance liquid-chromatographic determina- tion of enantiomeric ratios of amino-acids without chiral separation, J. Chro- matogr. 362 (1986) 353–362 .
[11] E. Bossu , V. Cotichini , G. Gostoli , A. Farina , Determination of optical purity by nonenantioselective LC using CD detection, J. Pharmaceut. Biomed. 26 (2001) 837–848 .
[12] M. Lorin , R. Delepee , J.C. Maurizot , J.P. Ribet , P. Morin , Sensitivity improvement of circular dichroism detection in HPLC by using a low-pass electronic noise filter: application to the enantiomeric determination purity of a basic drug, Chirality 19 (2007) 106–113 .
[13] B.S. Scott , D.L. Dunn , High-performance liquid-chromatographic analysis of epinephrine enantiomers using a UV detector in series with an optical-activity detector, J. Chromatogr. 319 (1985) 419–426 .
8 S. Lafhal, I. Bombarda and N. Dupuy et al. / Journal of Chromatography A 1610 (2020) 460568 [14] W.L. Champion , J. Lee , A.W. Garrison , J.C. DiMarco , A. Matabe , K.B. Prick-
ett , Liquid chromatographic separation of the enantiomers of trans-chlordane, cis-chlordane, heptachlor, heptachlor epoxide and alpha-hexachlorocyclohex- ane with application to small-scale preparative separation, J. Chromatogr. A 1024 (2004) 55–62 .
[15] F. Brandl , N. Pustet , A. Mannschreck , Chiroptical detection during liquid chro- matography 7 - The rotation angle/absorbance ratio of chiral molecules. Its possible use for on-line analysis during preparative separations of enan- tiomers, J. Chromatogr. A 909 (2001) 147–154 .
[16] C. Roussel , N. Hart , B. Bonnet , C. Suteu , A. Hirtopeanu , V.C. Kravtsov , R. Lubo- radzki , N. Vanthuyne , Contribution of chiral HPLC in tandem with polarimetric detection in the determination of absolute configuration by chemical intercon- version method: example in 1-(thi)oxothiazolinyl-3-(thi)oxothiazolinyl toluene atropisomer series, Chirality 14 (2002) 665–673 .
[17] P. Salvadori , C. Rosini , C. Bertucci , Circular dichroic detection in the HPLC of chiral molecules - direct determination of elution orders, J. Org. Chem. 49 (1984) 5050–5054 .
[18] C. Bertucci , D. Tedesco , Advantages of electronic circular dichroism detection for the stereochemical analysis and characterization of drugs and natural prod- ucts by liquid chromatography, J. Chromatogr. A 1269 (2012) 69–81 .
[19] W. Boehme , G. Wagner , U. Oehme , U. Priesnitz , Spectrophotometric and po- larimetric detectors in liquid-chromatography for the determination of enan- tiomer ratios in complex-mixtures, Anal. Chem. 54 (1982) 709–711 .
[20] J.C. Kuo , E.S. Yeung , Determination of carbohydrates in urine by high-per- formance liquid-chromatography and optical-activity detection, J. Chromatogr. 223 (1981) 321–329 .
[21] H. Kanazawa , Y. Kunito , Y. Matsushima , S. Okubo , F. Mashige , Stereospecific analysis of lorazepam in plasma by chiral column chromatography with a cir- cular dichroism-based detector, J. Chromatogr. A 871 (20 0 0) 181–188 .
[22] D. El Montassir , A. Aamouche , N. Vanthuyne , M. Jean , P. Vanloot , M. Taourirte , N. Dupuy , C. Roussel , Attempts to separate ( −)-alpha-thujone, ( + )-beta-thujone epimers from camphor enantiomers by enantioselective HPLC with polarimetric detection, J. Sep. Sci. 36 (2013) 832–839 .
[23] T.K.T. Do , F. Hadji-Minaglou , S. Antoniotti , X. Fernandez ,Authenticity of essen- tial oils, Trac-Trend. Anal. Chem. 66 (2015) 146–157 .
[24] A. Caligiani , M. Cirlini , G. Palla , R. Ravaglia , M. Arlorio , GC–MS detection of chi- ral markers in cocoa beans of different quality and geographic origin, Chirality 19 (2007) 329–334 .
[25] A. Mosandl , Enantioselective capillary gas-chromatography and stable-isotope ratio mass-spectrometry in the authenticity control of flavors and essential oils, Food Rev. Int. 11 (1995) 597–664 .
[26] R. Marchelli , A. Dossena , G. Palla , The potential of enantioselective analysis as a quality control tool, Trends Food Sci. Tech. 7 (1996) 113–119 .
[27] M. Lis-Balchin , Lavender: The Genus Lavandula, CRC Press, London, 2003 ed., .
[28] A.C. Aprotosoaie , E. Gille , A. Trifan , V.S. Luca , A. Miron ,Essential oils of lavan- dula genus: a systematic review of their chemistry, Phytochem. Rev. 16 (2017) 761–799 .
[29] J.M. Finefield , D.H. Sherman , M. Kreitman , R.M. Williams , Enantiomeric nat- ural products: occurrence and biogenesis, Angew. Chem. 51 (2012) 4802– 4836 .
[30] R. Shellie , L. Mondello , P. Marriott , G. Dugo ,Characterisation of lavender essen- tial oils by using gas chromatography-mass spectrometry with correlation of linear retention indices and comparison with comprehensive two-dimensional gas chromatography, J. Chromatogr. A 970 (2002) 225–234 .
[31] S. Lafhal , P. Vanloot , I. Bombarda , R. Valls , J. Kister , N. Dupuy , Raman spec- troscopy for identification and quantification analysis of essential oil varieties: a multivariate approach applied to lavender and lavandin essential oils, J. Ra- man Spectrosc. 46 (2015) 577–585 .
[32] S. Lafhal , P. Vanloot , I. Bombarda , J. Kister , N. Dupuy , Chemometric analysis of French lavender and lavandin essential oils by near infrared spectroscopy, Ind. Crop. Prod. 80 (2016) 156–164 .
[33] I. Bombarda , N. Dupuy , J.P. Le Van Da , E.M. Gaydou ,Comparative chemometric analyses of geographic origins and compositions of lavandin var. grosso es- sential oils by mid-infrared spectroscopy and gas chromatography, Anal. Chim. Acta 613 (2008) 31–39 .
[34] W.A. Konig , R. Krebber , P. Evers , G. Bruhn , Stereochemical analysis of con- stituents of essential oils and flavor compounds by enantioselective capillary gas-chromatography, Hrc-J. High Res. Chrom. 13 (1990) 328–332 .
[35] V. Schubert , A. Mosandl , Chiral compounds of essential oils : stereodifferentia- tion of linalool using multidimensional gas-chromatography, Phytochem. Anal. 2 (1991) 171–174 .
[36] P. Kreis , A. Mosandl , Chiral compounds of essential oils. Part XI. Simultaneous stereoanalysis of lauandula oil constituents, Flavour Frag. J. 7 (1992) 187–193 .
[37] C. Bicchi , L. Blumberg , C. Cagliero , C. Cordero , P. Rubiolo , E. Liberto , Devel- opment of fast enantioselective gas-chromatographic analysis using gas-chro- matographic method-translation software in routine essential oil analysis (lavender essential oil), J. Chromatogr. A 1217 (2010) 1530–1536 .
[38] J. Krupcik , R. Gorovenko , I. Spanik , D.W. Armstrong , P. Sandra , Enantioselective comprehensive two-dimensional gas chromatography of lavender essential oil, J. Sep. Sci. 39 (2016) 4765–4772 .
[39] M.E.A. Said , P. Vanloot , I. Bombarda , J.V. Naubron , E. Dahmane , A. Aamouche , M. Jean , N. Vanthuyne , N. Dupuy , C. Roussel , Analysis of the major chiral com- pounds of artemisia herba-alba essential oils (EOs) using reconstructed vibra- tional circular dichroism (VCD) spectra: en route to a VCD chiral signature of EOs, Anal. Chim. Acta 903 (2016) 121–130 .
[40] S. Ebel , A. Fischer , HPLC-determination of menthyl acetate in several pepper- mint-oils by polarimetric detection, Arch. Pharm. 322 (1989) 83–88 .
[41] M. Bounoshita , K. Hibi , H. Nakamura , Determination of enantiomer ratios of D,L-Carvone in supercritical-fluid extracts from caraway seeds and spearmint leaves by high-performance liquid-chromatography with polarimetric and ul- traviolet spectrophotometric detection, Anal. Sci. 9 (1993) 425–428 .
[42] U. Ravid , E. Putievsky , I. Katzir , Stereochemical analysis of borneol in essential oils using permethylated β-cyclodextrin as a chiral stationary phase, Flavour Frag. J. 11 (1996) 191–195 .
[43] G. Vidari , A. Di Rosa , G. Zanoni , C. Bicchi , Enantioselective synthesis of each stereoisomer of the pyranoid linalool oxides: the linalool route, Tetrahe- dron-Asymmetr. 10 (1999) 3547–3557 .
[44] G. Flores , G.P. Blanch , M.L.R. del Castillo , M. Herraiz , Enantiomeric composition studies in lavandula species using supercritical fluids, J. Sep. Sci. 28 (2005) 2333–2338 .
[45] E.N.C. Renaud , D.J. Charles , J.E. Simon , Essential oil quantity and composition from 10 cultivars of organically grown lavender and lavandin, J. Essent. Oil Res. 13 (2001) 269–273 .
[46] T.J. Edkins , P.C. Meier , R.D. Shah , D.R. Bobbitt , H. Saranadasa , R.D. Lodevico , Quantitative analysis of incomplete HPLC resolution of enantiomers. fit of po- larimetric detection for d - and l -phenylalanine to a Gaussian function, Enan- tiomer 7 (2002) 11–22 .
[47] M. Holik , A. Mannschreck , Determining enantiomeric excess from overlapping HPLC peaks: discussion of errors in the methods, Chemometr. Intell. Lab. 72 (2004) 153–160 .
[48] R. Däppen , P. Voigt , F. Maystre , A.E. Bruno , Aspects of quantitative-determina- tions with polarimetric detectors in liquid-chromatography, Anal. Chim. Acta 282 (1993) 47–54 .
[49] F.G. Sanchez , A.N. Diaz , I.M. Lama , Polarimetric detection in liquid chromatog- raphy: an approach to correct refractive index artefacts, J. Liq. Chromatogr. R. T. 31 (2008) 3115–3131 .