Published in: (1998), pp. 169-171 Status : Postprint (Author’s Version)
ABSORPTION AND IONIZATION SPECTROSCOPY OF
METHYL HALIDES AND DEUTERATED METHYL
HALIDES BETWEEN 6 AND 12 eV.
R. Locht1, B. Leyh1∗‡, H.-W. Jochims2 and H. Baumgärtel2
1
Laboratoire de dynamique moléculaire, B6c, Université de Liège, B. 4000 SART-TILMAN (Belgium) 2
Institut fiir Physikalische und Theoretische Chemie, Freie Universität Berlin, Takustraβe 3, D.14195 BERLIN
The autoionization of Rydberg series in the valence shell range has been shown to be involved in the dissociative photoionization of CH3F, CH3Cl, CH3Br and CH3I. To investigate such processes in more detail, we recorded the absorption spectra and some mass-resolved photoionization curves for CH3Cl, CH3Br and CH3I as well as for their perdeuterated analogues in the 6-12 eV range. This study is in the line with a previous investigation performed at higher energy [1].
This work was performed on the 1.5m-NIM-l beamline at the synchrotron radiation facility BESSY. A modified McPherson lm normal incidence monochromator was used [2]. The light is dispersed by a 1200 l/mm Platinum grating. For the photoabsorption experiments, the sample was expanded in an absorption cell at controlled pressure. The entrance and exit slits were adjusted at l00µm. For the photoionization studies, the absorption cell was replaced by an ionization chamber followed by a quadrupole mass spectrometer.
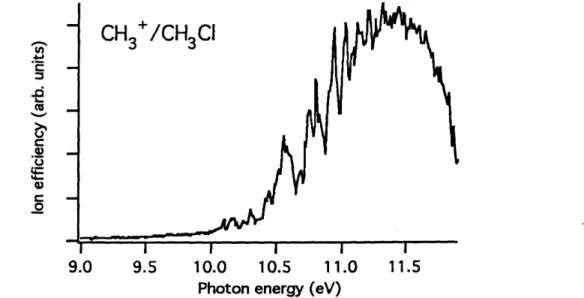
As an example, the cases of CH3Cl and CD3Cl will be discussed now in more detail. The photoabsorption curves of CH3Cl and CD3Cl in the 6-12 photon energy range are displayed in Figures 1 and 2, respectively. Figure 3 shows the CH3
+
photoionization curve at low energy corresponding to the ion pair formation process:
CH3Cl + hν → CH3+ + Cl- Figure 1. Absorption spectrum of CH3Cl in the 6-12 eV range
Published in: (1998), pp. 169-171 Status : Postprint (Author’s Version)
Figure 2. Absorption spectrum of CD3Cl in the 6-12 eV range
Figure 3. Low-energy part of the photoionization curve of CH3 +
from CH3Cl measured with a lithium fluoride window.
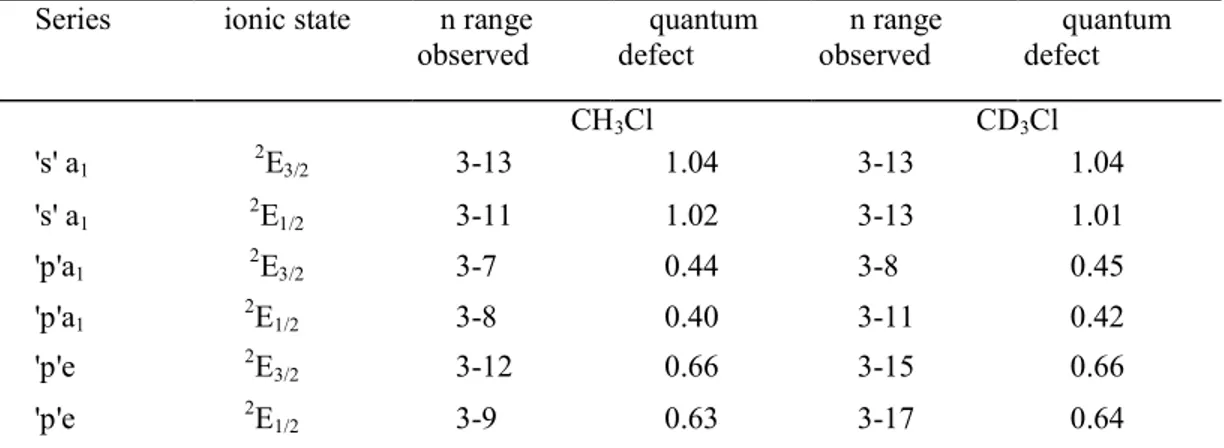
In the photon energy range investigated, the Rydberg series converging to the spin-orbit doublet (2E3/2 and 2E1/2) of CH3C1+ [3] corresponding to the 1e43a122e3 configuration are observed. The n=3 to n≥10 members of the n's'a1, n'p'a1 and n'p'e series have been identified (Table 1) and their vibrational frequencies have been deduced. The isotope ratios observed for these frequencies are very close to those of the neutral molecule.
Published in: (1998), pp. 169-171 Status : Postprint (Author’s Version)
Table 1. Summary of the Rydberg series observed in the absorption spectra of CH3Cl and CD3Cl in the 6-12 eV range.
Series ionic state n range observed quantum defect n range observed quantum defect CH3Cl CD3Cl 's' a1 2E3/2 3-13 1.04 3-13 1.04 's' a1 2 E1/2 3-11 1.02 3-13 1.01 'p'a1 2E3/2 3-7 0.44 3-8 0.45 'p'a1 2E1/2 3-8 0.40 3-11 0.42 'p'e 2E3/2 3-12 0.66 3-15 0.66 'p'e 2E1/2 3-9 0.63 3-17 0.64 Acknowledgements
R.L. and B.L. gratefully acknowledge the financial support of the European Community under Contract N°:ERBFMGECT 952031
References
[1] R. Locht, B. Leyh, H.-W. Jochims, K. Hottmann and H. Baumgärtel, BESSY Jahresbericht (1996) 162.
[2] E. Biller, H.-W. Jochims and H. Baumgärtel, BESSY Jahresbericht (1994) 456.