HAL Id: hal-01008918
https://hal.archives-ouvertes.fr/hal-01008918
Submitted on 20 Apr 2018HAL is a multi-disciplinary open access archive for the deposit and dissemination of sci-entific research documents, whether they are pub-lished or not. The documents may come from teaching and research institutions in France or abroad, or from public or private research centers.
L’archive ouverte pluridisciplinaire HAL, est destinée au dépôt et à la diffusion de documents scientifiques de niveau recherche, publiés ou non, émanant des établissements d’enseignement et de recherche français ou étrangers, des laboratoires publics ou privés.
Identifying soil parameters by inverse analysis of field
testing
Aurélie Papon, Yvon Riou, Pierre Yves Hicher, Christophe Dano
To cite this version:
Aurélie Papon, Yvon Riou, Pierre Yves Hicher, Christophe Dano. Identifying soil parameters by inverse analysis of field testing. 11th ASCE Aerospace Division International Conference on Engineering, Construction and Operations in Challenging Environments (Earth and Space Conference 2008), Mar 2008, Long Beach, Californie, United States. �hal-01008918�
IDENTIFYING SOIL PARAMETERS
BY INVERSE ANALYSIS OF FIELD TESTING
A. Papon, Y. Riou, P-Y. Hicher, C. Dano
Research Institute in Civil and Mechanical Engineering, Ecole Centrale Nantes – University of Nantes – CNRS UMR 6183, BP 92101, 44321 NANTES cedex 3 (France)
[email protected], [email protected], [email protected], [email protected]
Abstract
The identification of constitutive parameters by inverse analysis of limited experimental information is investigated. In order to ensure the quality of measurements, all the data come from a thick wall cylinder test performed on a saturated sand sample. A numerical FEM-simulation considering a linear elastic perfectly plastic model (Mohr-Coulomb) is carried out in order to determine the pressure – cavity deformation relationship. Two kinds of optimization algorithms, a deterministic and a stochastic one, are presented and implemented in the inverse procedure. The performance of theses algorithms taking for identifying three parameters (Young’s Modulus, friction angle and dilatancy angle) is compared. The two kinds of algorithms provide a quite similar response for the mathematical optimum, but some parameters sets did not have an acceptable physical meaning. Contrary to the deterministic algorithm, the genetic method provides an assembly of “satisfactory” individuals. Some of the parameters sets have acceptable physical meaning and the expert has to choose the best one considering his scientific and technical background.
Inverse analysis of field tests in the geotechnical area
For identifying soil mechanical parameters, two kinds of experimental tests can be carried out: laboratory tests and field tests. Laboratory tests are selected because the measurement conditions are well controlled and the homogeneous stress paths make possible the identification procedure by analytical methods. Field tests are selected when the characterization of the soil by standard laboratory tests can be questioned because of sampling induced disturbances, or prohibitive costs, or the incapacity to transport samples to the laboratory, which is typically the case of extra-terrestrial soils. In this case, due to the non homogeneous stress paths, a more sophisticated inverse analysis is required. Many studies have been conducted on pressuremeter tests in order to characterize soil parameters (Mehta, 1989; Cambou and Bahar, 1993; Ledesma et al., 1996; Schnaid and Mantaras, 1998; Zentar et al., 2001; Dano et al., 2007; Rechea et al., 2007).
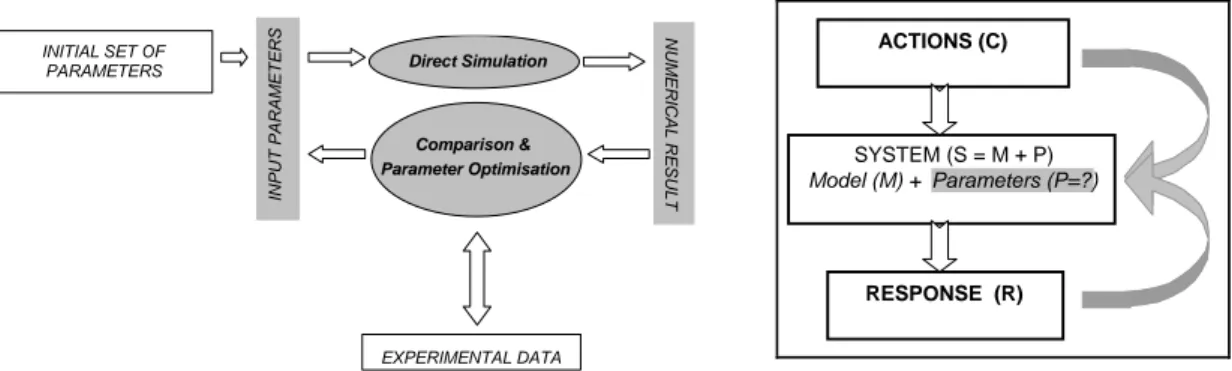
Inverse analysis consists in minimizing the difference between experimental data collected in situ and the predictions of analytical or numerical calculations (Figure 1). The nature of the simulation – analytical or numerical – depends mainly on the complexity of both the constitutive model selected to represent the behavior of the soil and the boundary conditions. The fitting of experimental data with calculations is achieved by combining a direct modeling scheme and a parameters optimization routine. Such a generally ill-posed mathematical problem requires also to define precisely (i) the set of parameters to be optimized, for instance from a preliminary
sensitivity study or a prior knowledge of the soil behavior, and (ii) the domain in which solutions are considered as acceptable, from physical and mechanical points of view.
In most of geotechnical applications, an inverse analysis requires the use of a simulation tool that could be a finite element code and an optimization tool, mainly a deterministic algorithm (simplex, conjugate gradient, Levenberg-Marquardt method, Newton-Raphson algorithms). In this paper a stochastic method (genetic algorithms), acting as an optimization tool, is investigated on well-calibrated pressuremeter tests and compared to a deterministic algorithm: the simplex method.
EXPERIMENTAL DATA INITIAL SET OF
PARAMETERS Direct Simulation
Comparison & Parameter Optimisation NU M E R IC A L RE S U L T INPU T PAR AM ETERS SYSTEM (S = M + P) Model (M) + Parameters (P=?) ACTIONS (C) RESPONSE (R)
Figure 1. Flow chart of the inversion procedure.
Two types of algorithms
The optimization procedure consists in minimizing a cost function Ferr, which
represents the difference between N experimental values and N numerical values of the studied field “u”. The classical quadratic error cost function is applied in this study:
∑
= − = N i k i num i k err x u u x F 1 2 ) ( exp ) ( )) ( ( ) ( (1)which x(k): set of parameters
Each term of the norm can be balanced by considering the accuracy of the measure. It has been proved that these weighting coefficients play an important role in the identification procedure. However without real objective justifications in the determination of the coefficients and considering that the aim of the paper is to compare optimization algorithms, the cost function used here does not contain weighting coefficients.
In the literature, different algorithms are proposed in order to minimize this function. In the geotechnical field, deterministic algorithms are traditionally used. The practice shows that the simplex method is more robust than algorithms based on local gradients, because it does not require derivatives of the cost function. A simplex is a polyhedron containing N+1 points in a N-dimensional space, where N is the number of parameters. The initial simplex is modified according to the value of the cost function at the N+1 vertexes, using the three following operations: reflection, contraction and expansion. The convergence criterion is linked to the size of the simplex or to the cost function. The uniqueness of the solution is usually assessed by
multiple optimizations from different initial sets of parameters, in order to avoid convergence towards a secondary minimum of the cost function.
Genetic algorithms have been developed to circumvent that shortcoming. This method belongs to the family of stochastic algorithms. It is derived from Darwin’s evolution theory. Like in biology, the survival of the best adapted individuals, represented by the best sets of parameters, and the multiplication of competitive ones are guaranteed through the transmission of a favorable gene pool. Gene mutation makes possible an emergence of new competitive individuals. The basic principles of this type of algorithms are described by Goldberg (1989).
Contrary to deterministic algorithms, the solution corresponds to an entire population of individuals with different gene pools and the result gives a global view of this set of gene pools. The strategy of the algorithm is to detect individuals with low cost function, using a reduced numbers of simulations, based on gene cross-over and selection. Thanks to mutation, genetic algorithms are able to continue the exploration of a given search domain and check out another minimum. Iterations are called generations. A generation is made of five successive steps. The performance of each individual is evaluated by calculating the value of the cost function. Then individuals are selected according to a rule defined previously. The selected individuals are crossed with each other. Some individuals undergo a gene mutation. The methods of cross-over and mutation depend on the parameters coding. Finally the new individuals replace the previous population. Two possible criteria of convergence can be established: one depends on the number of individuals which have the same gene pool and the other replaces on the values of the cost function.
Application to thick wall cylinder tests
Description of the experimental conditions
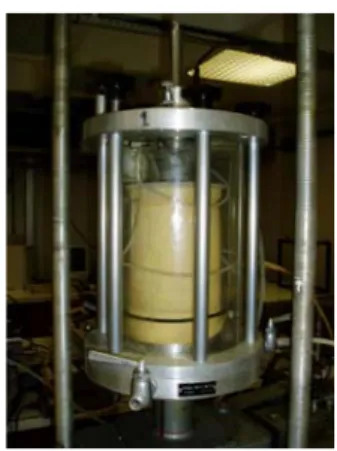
This study is based on thick wall cylinder tests (Figure 2) carried out on saturated Hostun sand (Dupla, 1995). The test selected for this study was carried out on a dense sample (ID=0.80) with a confinement pressure of 100 kPa. The cylinder-shaped
sample is 100 mm large and 150 mm high, with a 10 mm large central cavity (re ri =10). Dry sand is layed with a funnel from a small fall height. The specimen is compacted with a small sledge-hammer and then saturated. The test is carried out in drained conditions. The confinement is kept constant on the external wall, whereas the pressure in the cavity is gradually increased. The increase of the volume cavity as well as the sample volume variation are measured.
Numerical modeling
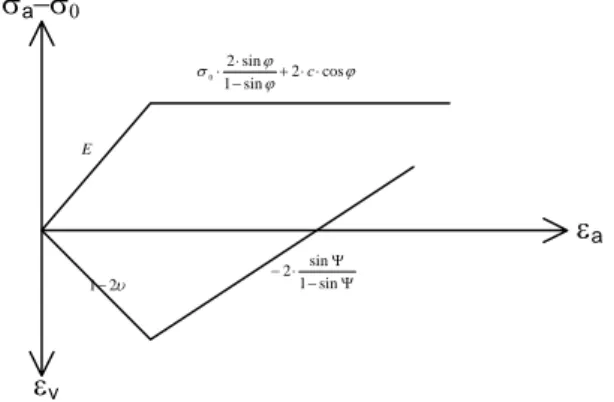
Due to the axisymmetry of the problem, a 2D finite element modeling is performed to simulate the cavity expansion. 8 node quadrilaterals are used and the model contains 1911 nodes and 600 elements. In accordance with the experiment, the displacements are null at the bottom of the specimen. The lateral and vertical stresses are kept constant (100 kPa). The loading is displacement controlled (constant displacement along the probe). The identification is carried out with the codes CESAR_LCPC for the mechanical modeling and ModeFrontier (ESTECO) for the optimization process. Because of its relatively extensive use in geotechnical design and for a preliminary study of a new technique of identification on the laboratory pressuremeter, the linear elastic perfectly plastic model of Mohr-Coulomb type is selected. This model is characterized by five classical parameters (Figure 3): Young’s modulus E, Poisson’s ratio ν, internal friction angle ϕ, dilatancy angle ψ and cohesion c. The identification is performed on the three following parameters: Young’s modulus E, friction angle ϕ and dilatancy angle ψ. The cohesion is considered to be null, since the sand is saturated. The numerical simulations are hardly sensitive to Poisson’s ratio ν, so that its value is taken equal to 0.33. The calculation considers the hypothesis of small strains, which is justified by the values of the local deformations which are always smaller than 10% along the diameter of the sample.
σa−σ0 ϕ ϕ ϕ σ 2 cos sin 1 sin 2 0 − + ⋅ ⋅ ⋅ ⋅ c υ 2 1− E Ψ − Ψ ⋅ − sin 1 sin 2 εa εv
Figure 3. Deviatoric stress and volume strain - axial strain triaxial test, Mohr-Coulomb model.
Comparison between genetic and simplex method
Genetic Algorithms
The initial population is set to 200 individuals, randomly distributed between 5 and 50 MPa for the Young’s modulus, 30 and 50 degrees for the internal friction angle and 0 and 30 degrees for the dilatancy angle. The discretisation step is respectively 1 MPa, 0.5 degree and 0.5 degree. Taking into account the measure uncertainties, the individuals are considered as relevant when their performance (the value of the cost function) is lower than 85 kPa, which represents a mean error of 4.25 kPa in the evaluation of the pressure applied in the probe. Figure 4 compares the experimental and two numerical simulation curves, for which the cost function is smaller than 85 kPa. The calculation is stopped at the end of the 5th generation, when almost halfof the individuals have a “satisfactory” performance.
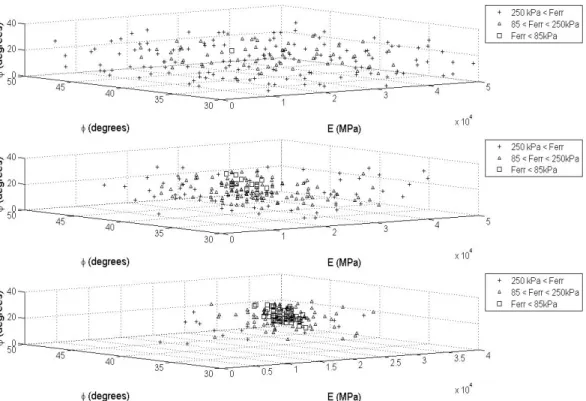
Figure 5 illustrates the evolution of the distribution of the individuals at the 1st, 3rd and 5th generations and therefore the gradual convergence to the minima. The mathematical optimum is obtained for the following set of parameters:
E = 24 MPa, ϕ = 40.5 degrees, ψ = 29.5 degrees
0 200 400 600 800 0 0,1 0,2 0,3 0,4 0,5 εcav P ( k Pa ) (a) experiment
numerical simulation E=24MPa, Phi=40.5°, Psi=29.5°, Ferr=67.7kPa numerical simulation E=30MPa, Phi=41°, Psi=10.5°, Ferr=84.7kPa
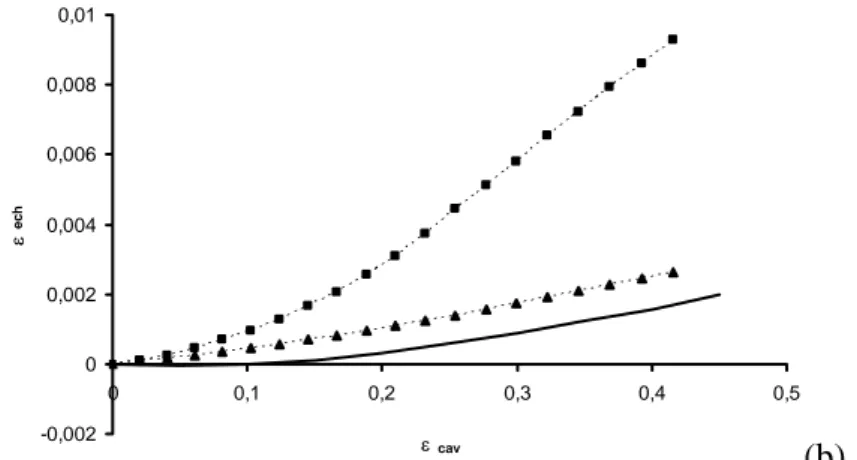
-0,002 0 0,002 0,004 0,006 0,008 0,01 0 0,1 0,2 0,3 0,4 0,5 ε cav ε ec h (b)
Figure 4. Experimental and numerical curves for satisfactory individuals (a) sample pressuremeter curve
(b) volumetric strain of the sample –volumetric strain of the cavity. For this mathematical optimum, the corresponding values of ϕ and ψ do not respect the connection between these two parameters, commonly accepted in the geotechnical field. Nevertheless in Figure 6, some parameters sets, less competitive but however relevant, have a more physical meaning (for instance: E = 30 MPa, ϕ = 41 degrees and ψ = 10.5 degrees). A comparative analysis of the numerical and experimental volumetric strains (cavity and sample) makes possible the finding of a satisfactory set in terms of dilatancy angle values (Figure 4b).
Figure 5. Distribution of the individuals at the 1st, 3rd and 5th generations.
Ferr
Figure 6. Distribution of the “satisfactory” individuals of the 5th generation.
Simplex Algorithm
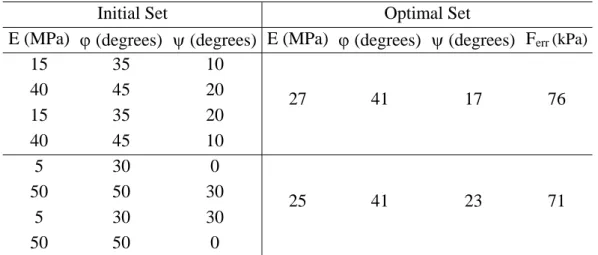
Some calculations with different initial simplexes are also carried out. The scattering in the optimal sets, related to the initial values, is summarized in Table 1. The two detected optima are secondary minima, considering the results obtained with the genetic method (Ferr > 68kPa). However their performance, lower than 85 kPa, provides a good fitting with the experimental data. The values of the dilatancy angle are however too high and physically unacceptable. In general, the simplex algorithm needs about sixty iterations in order to converge.
Initial Set Optimal Set
E (MPa) ϕ (degrees) ψ (degrees) E (MPa) ϕ (degrees) ψ (degrees) Ferr (kPa)
15 35 10 40 45 20 15 35 20 40 45 10 27 41 17 76 5 30 0 50 50 30 5 30 30 50 50 0 25 41 23 71
Table 1. Results of optimization calculations with the simplex algorithm.
In terms of Young’s modulus and friction angle, the difference between the results of the simplex and genetic method is small enough. However, the genetic method provides a large range of possible dilatancy angles and the expert will have to find the adequate value based on his experience. He will dispose also of a lot of different pairs (E, ϕ), among which, considering his scientific and technical background or results of others tests, he will be able to determine with better accuracy the parameters for the design calculations.
Conclusion and perspectives
The example of parameters identification outlined in this paper shows to what extend the genetic method can be interesting. Contrary to the simplex algorithm, the genetic method does not provide only a global mathematic minimum, but also a large range of “satisfactory” individuals, which must be regarded as possible solutions, considering the incertitude of the experimental data. Among these “satisfactory” individuals the expert can choice the best set of parameters considering his scientific and technical background or other experimental tests.
The calculation time has not been mentioned yet. In this analysis, the calculation time with the genetic method is 15 times longer than the one with the simplex method. It must be noted that the search for the mathematical optimum, which can be, in certain cases, of no physical meaning, requires with the simplex method a minimum number of calculations with different initial sets of parameters. Moreover, the other deterministic methods are less robust than the simplex method, and therefore can lead to results of poorer quality.
The perspectives of this initial study concern the identification of parameters of more realistic constitutive models (elastoplastic models with a non linear hardening, double yielding surface, non linear elastic behavior). Other field tests have also to be considered, since the authors are aware that a pressuremeter test could be difficult to handle in extra-terrestrial soil.
References
Cambou, B. and R. Bahar (1993), ‘Utilisation de l’essai pressiométrique pour l’identification de paramètres intrinsèques du comportement d’un sol’, Revue Française de Géotechnique, 63, 39-50 (in French).
Dano, C., P-Y. Hicher, D. Rangeard and P. Marchina (2007), ‘Interpretation of dilatometer tests in a heavy oil reservoir’, International Journal for Numerical and Analytical Methods in Geomechanics, 31(10), 1197-1215.
Dupla, J.C. (1995), ‘Application de la sollicitation d’expansion de cavité cylindrique à l’évaluation des caractéristiques de liquéfaction d’un sable, PhD thesis, ENPC (in French).
Goldberg D. E (1989). Genetic algorithms in search, optimization and machine learning. Adisson-Wesley
Ledesma A., A. Gens and E.E. Alonso (1996), ‘Estimation of parameters in geotechnical backanalysis – 1° : maximum likelihood approach, Computers and Geotechnics, 18(1), 1-27.
Mehta, B.J. (1989), ‘Evaluation of subsoil properties by pressuremeter test’, 12th International Congress of Soil Mechanics and Foundation Engineering, Rio de
Janeiro, Proceedings, 1, 295-298.
Rechea, C., S. Levasseur and R.J. Finno (2007), ‘Inverse analysis techniques for parameter identification in simulation of excavation support systems’, Computers and Geotechnics, accepted for publication.
Schnaid, F. and F.M. Mantaras (1998), ‘Assessment of soil properties in cohesive-frictional materials with pressuremeter tests’, 1st International Conference on Site Characterization, Atlanta, Proceedings, Robertson and Mayne (eds.), 811-816.
Zentar, R., P-Y. Hicher and G. Moulin (2001), ‘Identification of soil parameters by inverse analysis’, Computers and Geotechnics, 28, 129-144.