HAL Id: hal-01008379
https://hal.archives-ouvertes.fr/hal-01008379
Submitted on 3 May 2018HAL is a multi-disciplinary open access archive for the deposit and dissemination of sci-entific research documents, whether they are pub-lished or not. The documents may come from teaching and research institutions in France or abroad, or from public or private research centers.
L’archive ouverte pluridisciplinaire HAL, est destinée au dépôt et à la diffusion de documents scientifiques de niveau recherche, publiés ou non, émanant des établissements d’enseignement et de recherche français ou étrangers, des laboratoires publics ou privés.
Laterally static and cyclic pile behavior in clay
Meriam Khemakhem, N. Chenaf, Josselin Garnier, G. Rault, L. Thorel,
Christophe Dano
To cite this version:
Meriam Khemakhem, N. Chenaf, Josselin Garnier, G. Rault, L. Thorel, et al.. Laterally static and cyclic pile behavior in clay. 7th International Conference on Physical Modelling in Geotechnics, 2010, Zurich, Switzerland. �hal-01008379�
Laterally static and cyclic pile behavior in clay
M. Khemakhem, N. Chenaf, J. Gamier, G. Rault ,L.Thorel
Laboratoire Central des Ponts et Chaussees, Nantes, France
C.Dano
Institut de recherche en Genie Civil et Mecanique, Nantes, France
ABSTRACT: While deep foundations have been used extensively in clay to support both monotonic and cy-clic lateral loading, significant uncertainties still now exist in predicting the field behaviour of such founda-tions, especially for the cyclic loading. Cyclic loads result of waves and winds forces on offshore structures or on bridge piers, mooring of boat on quays and variable overloads on many constructions and buildings.
Useful data on cyclic loading of piles in sand have already been obtained from centrifuge model tests and the purpose of tl}e present study is to provide new data on the response of piles in clay under lateral static and cy-clic loads. The clay is a normally consolidated kaolin whose undfained shear strength increases with depth. Testing equipments and soil model preparation are presented in detail. The program of centrifuge tests is pre-sented. Undrained tests on a rigid and flexible pile models (1/50) are performed. In the first test series, the ul-timate static load was esul-timated. For cyclic loads, the pile top deflection was recorded using displacement transducer installed on the model rigid pile. The effect of the number of cycles on the head displacement was discussed.
I INTRODUCTION
Most of practical interest to the engineer is the knowledge of the deflection and the bending mo-ment resulting on foundations. The bending momo-ment is required in the sizing of the foundation and the de-flection is necessary to define the serviceability of the supported structure under static or cyclic loading conditions.
Theoretical approaches including specification about cyclic were developed to predict the behavior of piles in clay: the elastic continuum analysis pro-posed by Poulos (1982), the non linear subgrade re-action developed by Matlock (1960), the finite ele-ments model ofRandolph (1977). These approaches were validated and developed by filed tests carried on full scale·pile (Mattock, 1970; Tassios & Leven-dis, 1974 ; Reese & Welch, 1975 ; Brown and al, 1987) . The results of such tests are relevant but these tests are still expensive and quite difficult to realize. The geotechnical centrifuge offers the pos-sibility to field-test large model scale of piles and different types of soil. However, few tests in centri-fuge were conducted to determine the behaviour of piles subjected to static and cyclic loading in clay (Hamilton & a!, 1991 ; Kitazume & Miyajima, 1994 ; llyas & al, 2004).
The experiments described herein were aimed at predicting the load-deflection relationship of rigid and flexible piles driven on normally consolidated clay, submitted successively to static and cyclic loading. Experimental static responses were com-pared to computed ones. The calculation was done by the Pilate LCPC software which will be presented later.
2 TEST PROCEDURE
All tests were conducted at 50 g on the geo-technical centrifuge in the LCPC in Nantes. The ra-dius of the centrifuge is 5.5 m and its maximum ac-celeration is up to 200 g.
2.1 Model piles
Rigid and flexible model piles were manufac-tured to simulate at 50 g a prototype steel pile with a diameter of B = 0,9 m to a depth of D = 16 m below
the ground surface. The flexible model pile is made of a tubular aluminium pipe with a thickness of I
mm . The rigid model pile is a fully aluminium pipe. Hence,· only the stiffness rigidity E PIP differs from
rigid to flexible model pile. The table behind sum-marize the p~oprieties of the prototype piles.
Table 1. Proprieties of the prototype piles
B(m) D(m)
Flexible pile 0,9 16 895
Rigid pile 0,9 16 38100
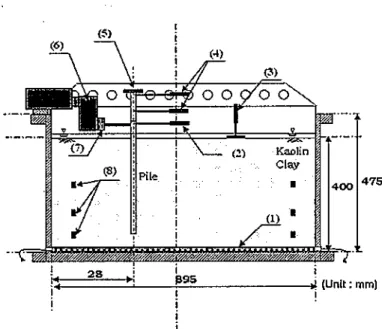
The pile instrumentation is presented in the Figure 1. Tlie lateral displacement of the pile head was recorded by a displacement transducer (2) which was mounted in front of the loading point. The pile head was extended so that
it
was possible to mount two additional displacement transducers (4). This data is important to ensure a redundant measure-ment. The vertical displacement of the pile is also controlled by a displacement transducer mounted inthe head of the pile (5).
A typical model set up for tests is schemati-cally shown in Figure 2.The test layout is also pre-sented in the Figure 3. Lateral loading was applied using in flight a serve-actuator (6) controlled from the centrifuge operator's room. The lateral load was recorded by a load transducer (7)- mounted in the serve-actuator. All data were recorded using trans-ducers connected to a microprocessor.
~)
T
(1) Drainage geotextile (:!) Kaolin Cl'Y•
•
•
(2) Horizontal displacement transducer at the loading point (3) Soil settlement transducer
(4) Horizontal pile displacement transducer (5) Vertical pile displacement transducer (6) Servo- actuator
(7) Load transducer (8) Pore water transducer Figure2 .. Model set up
2.2 Clay sample
2.2.1. Preparation -Preliminary consolidation
475
Tests were performed in a cylindrical steel tubs 895 mm in diameter by 475 mm deep. The kaolin clay named Speswhite and used in this study was homogenous and saturated. The table 2 lists its main physical proprieties.
Table 2. Physical proprieties of kaolin clay
Average bulk unit weight r~l7.5kN/m3
Final average water content w-50%
Compres,sion index Cc= 0,44
Vertical index of consolidation Cv -310 m2 Is
Swelling index Cs = 0,44
Clay sample was prepared in order to reproduce filed conditions at 50 g like in normally consolidated clay. This technique of preparation was used in the LCPC to simulate deep-water anchrages and severals other kinds of offshore plate form foundations (ElOCON- CHEVRON).
Three layers were successively poured in the model container .Each layer was prepared and con-solidated in the following manner. First, a clay sluny
was prepared with an initial average water content
w = 90% and allowed tb rest for 24 hours:· Before being placed in the container, the slurry was mixed for about four hours and a drainage geotextil was disposed at its bottom. Second, to· reduce the flight time necessary to the final consolidation, this layer was preliminary consolidated at lg under the value of the overburden pressure enhanced at its center like in 50 g field normally consolidated clay. This pressure is applied by stages. This process was re-peated for each layer. When the preliminary consoli-dation of a layer was achieved, the next layer was placed above and then consolidated. The figure be-low (Fig.4) presents the theoretical pressnre applied for each layer The_ preliminary consolidation is fol-lowed by the in-flight consolidation. This process ensure the ultimate consolidation of the clay sample
The theoretical final height of each layer after the preliminary consolidation at 1 g was about 133 mm.,
the final model sample thickness was about 400 mm. The pile was installed at 1g by driving it into a drilled hole before turning on the centrifuge.
Figure 4, Preliminary consolidation pressure
2.2.2. In flight Consolidation
The clay sample was then reconsolidated under it self weight in the centrifuge at 50 g to allow the ex-cess pore water pressure to dissipate through the free surface clay and the opening holes at the bottom. Free water approXiniately 15 mm -deep was main-tained above the- ground soil to unsure the satura-tion ..
Settlements and.pore .water transducers were used in order to control the consolidation ratio during the in-flight. Two series of three pore water transducers are placed into the clay through holes distributed in the container's wall. Two settlements transducer were placed above_ the soil free surface (see Fig.2).
A settlement graphical method was mainly used to estimate and to control the consolidation ratio at any time from the settlement data during the in-flight. This method, simple and practice, was first proposed by Asaoka (1978) and then developed by Magnan and Deroy (1980). First, a time interval l!.t
was chosen, in thiS study D.t = 20 m!J . Then, during the in-flight, the settlement s1 was measured at the time t1 as shown ih the table below -(Tab. 2), s1_
1 and
s1are successively the settlements recorded at two successive time steps !1_1 and t1 = tH
+
D.t. The val-ues of s1_1 are then plotted versuss1• The final set-tlement
s.,
is the intersection of this curve and the bisector. The final predict settlement and the last measured average settlement give the consolidation ratio:U = s(t) x100(%) (1)
s_
Table2. Asaoka method
I :
\::L
I
~,
I
~,
I
~:
I
~:
I
~:
I
~,
I : I
Generally, a value at least equal to U = 70% was achieved before starting the pile loading. The final model sample thickness after the in-flight consolida-tion was about 395 mm. For each model container, four tests were performed. The consolidation in flight had to be repeated for each test: the centrifuge was stopped to adjust the position of the serve-actuator to conduct the next test. The duration of consolidation was unpredictable. We have noted that the consolidation in the first tests was faster and
bet-ter
thmi
the subsequent ones. If a maximum of fourhours was necessary to achieve U = 85 % for the first and the second tests, the latest required about six hours to reach 71% of consolidation.
2.2.3. Penetrometer test
Undrained shear strength of the soil was meas-ured at 1 g and in flight after the final consolidation process using a cone pentrometer. The penetrometer used has a cross bar of 300 mm long and 12 mm in
diameter attached perpendicularly to the end of a vertical shaft. The cone was pushed in the soil at a rate of 5 mm Is and its penetration resistance q c was
monitored by a cell load cell fastened onto the cone. The depth of penetration was monitored by a poten-tiometer located inside the actuator. Undrained shear strength S,. was then calculated using a correlation between the pentrometer resistance and the scissom-eter undrained shear strength which was checked in the LCPC for the same normally consolidated clay :
(2)
2.3 Experimental program
In this study, results of five tests will be pre-sented. Static and cyclic lateral load tests were car-ried out. After the completion of the consolidation in-flight, each pile was laterally loaded at its top.
Static loading tests were performed to estimate the ultimate lateral load of the interaction soil-pile. The load is applied using dispiacement control mode at a rate of 4 mm Is . Lateral displacement was
applied on pile until the load recoded did not io-crease and became constant. This rate was chosen so that the conditions around the pile during the loading are essentially undraine4. This rate was estimated from T -bar tests performed in a centrifuge at the University of Western Australia by Steward and Randolph (1991). Authors suggested two approxi-mate limits of loading's rates between the drained (Eq. 3) and undraioed conditions (Eq. 4). The rate depends on the T-bar diameter B and the vertical consolidatioll index Cv.
v< 0•2 Cv for drained conditions (3)
B
v> 2
°
Cv forundrained conditionsB (4)
The limit" rate for. undrained conditions was esti-mated for these tests, it was found that
v>.3mm/s
For cyclic loading, a rigid pile was subjected to one-way cyclic loading using loading control mode. The cyclic input was a fifty- cycles sinusoidal se-quence with a frequency of 0,5 Hz. The amplitude was fixed at twenty per cent of the ultimate lateral load estimated in the static tests. A typical record of the load applied is given in Figure 5.
z
•
"
-n 4 12 1& w u 28 n ~ ® « « Time fsecondeslFigure 5. Beginning of cyClic load sequence in model scale
3 . TEST RESULTS
All results presented herein are in prototype scale.
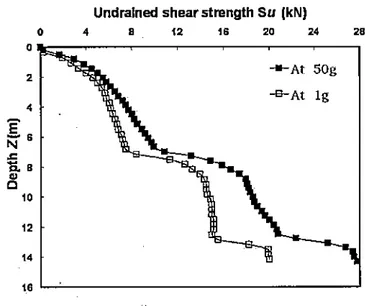
3.1 Undrained shear strength profile
Results reveal as expected that the soil strength increase lineill-ly with the depth both at 1 g and at 50
gas shown in Fig.6. The consolidation was achieved in flight, thus the values of the undrained shear strength were higher at 50 g.
As mentioned, the re-consolidation in flight was unavoidable. For each test, a penetrometer test had to be done. The comparisons between the shear strength profile at 50g, for all test, show that the soil resistance was almost comparable.
Undralned shear strength Su (kN)
0 4
'
"
"
"
"
0
'
--At SOg -B-At lg4
:[6
N .c...
•
c 10"
"
16Figure. 6. Undrained shear strength profile
3.2 Ultimate lateral static load Load-displacement relationship
After all tests completed, a gap was observed in front of the pile. The soil behind the pile was con-fined aS ~hown in Fig. 7.
GOD
r---,
z 500,
:t: 400'll
..9
300 jj c 2002
'0 ~ 100-e-Test 1 Rigid pile
-s-Test 2 Rigid pile -*""Test 3 Rigid pile Computed result -+-Test 4 Flexible pile
Flexible pile --+---Test 5 Flexible pile
ol---~--~----~--~~~~~
0,0 0,2 0,4 0,6 0,8 1,0 1,2
Normalized Horizontal Displacement Ytop/8
The relationship between lateral load and lateral displacement at the loading point is drawn as shown in Fig. 9 , the horizontal displacement was nonnal-ized with respect to the pile diameter B. As ex-pected, the applied load increased with applied dis-placement For small disdis-placement, the lateral load
H can be considered to increase linearly with the top deflection of the pile Yrop . This relation can be ex-pressed by the following equation:
H=kyTop . (5)
Where k is a coefficient of the soil-pile interaction. We noted that equal stiffuess rigidity piles have ap-proximately the same coefficient k. In addition, the coefficient k for rigid piles was higher than flexible ones for all tests. We concluded that the lateral load for small displacements depends on the stiffuess ri-gidity of the pile considered. Centrifuge tests were conducted by Katuzume & Miyajima (1994), it was found that the horizontal load increased almost line-arly with the increase of the square root of pile rigid-ity.
For higher displacement, the results emphasize the highly non linearity nature of the soil- pile- inter-action. The ultimate load H u was deduced from the
load-displacement .A value between 400 and 500 kN was approximately found for all piles regardless the stiffness rigiaity.
The lateral load- displacement relationship was also computed using the Pilate LCPC software which is based on the elastic continuum analysis. Calculated P-y curyes, stiffuess rigidity of piles and boundary conditions were introduced first into Pi-late. The pile tip was supposed free. The results ob-tained for each load increment are presented in Fig. 9. It is a fair agreement with the measured curves. Moreover, it can be seen that the difference still ex-ists between the responses for rigid and flexible piles. The coefficient of the interaction soil-pile of rigid pile remains higher than the flexible one for small displacement. Finally, the ultimate load was the same for the highest displacement as experimen-tal results.
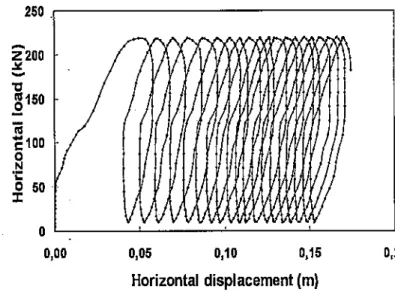
3.3 Pile he"ad displacement under cyclic lateral load
The cyclic curve of displacement at the load-ing point is shown in Figure 9. In the first loading stage, before the first cycle, the horizontal displace-ment rose up toy;·. After the first Cycle, a residual displacement was' accumulated with increasing cy-cles for the same load. The displacement nonnalized with the displacement y1 versus tlie number of cycles is presented in th6.Figure 10. As shoWn, the nonnal-ized ratio yjy, increased. with the number of cycles for the same load, but no stabiliiation was reached.
It is reasonable to attribute this phenomenon to the degradation of clay's strength under cyclic load-ing, which contribute to increase the displacement. Cyclic simple shear loading tests were carried on clay (Purzin & a/, 1995), it was seen that the mean effective stresses decreases and so the clay was no longer as resistant as before cyclic loading. A slight increase of the pore pressure may cause the degrada-tion of the soil.
The last issue to be discussed in this section con-cerns the comparison between the behavior of the head pile under cyclic loading in the sand (Rosquoet, 2004) and in the clay. We noted a fair agreement be-tween them. The top displacement of the pile em-bedded in the sand was fitted by a logarithmic curve: _,)',_ = 1 +b ln(N) (6)
y,
Where _b is a coefficient depending on the amplitude and the density of the soil. and N is the number of cycles applied.
A similar fitting is possible to piles embedded in clay, but more tests are needed to define parameters which could affect the coefficient b. These parame-ters could be the amplitude, the consolidation degree or both. 250 'C ~150 ;; C'100
2
·c
0 50 :J: 0 0,00/;I~
V
0,05,/
~
iJ
' III/Ir~/;
0,10 0,15 Horizontal displacement (m)Figure 9. Cyclic lateral load -displacement relationship
14
r---.
12 10~·
;;:,
4 2 . 0 5 10 15 ~ ~ 30 ~ ~ ~ ~ Number of cyclesFigure IO.Nonnalized displacement - number of cycles rela-tionship
4 CONCLUSION
The behavior of the· pile embedded in normally consolidated clay under static and cyclic lateral
load-ing was undertaken in this study. The displacement
of the head pile was investigated. Results were re-producible despite the stopping of the centrifuge and the reconsolidation of the sample clay for each test. Careful supervision was needed to avert the clay's swelling. In fact, it was necessary to aspirate the wa-ter above the ground surface as soon as the centri-fuge was stopped. In sum, the following conclusions
were obtained:
1) The lateral load-displacement relationship de-pends on the stiffuess rigidity of Piles. This result was affirmed by calculation (Pilate).
2) The ultimate lateral load deduced from the load -displacement curve at the loading point was reproducible regardless the stiffuess rigidity of pile.
2) Cyclic loading could cause the degradation of the normally consolidated clay, thus the pile head displacement didn't reach stabilization.
For a through investigation, tests with more sig-nificant number of cycles are needed to define probably a stabilization threshold of the residual dis-placement. In addition, an accurate measure of the pore pressure nearer to the pile is particularly rela-vant even if the conditions are supposed undrained according to Steward & Randolph (1991). The pur-pose of these measurements is to focus on the causes of the degradation of the soil around the pile under cycles. Lastly, it is necessary to test clay with differ-ent consolidation degree to compare the effect of cy-clic loading on the clay and on the pile head dis-placement under the same cyclic loading.
References
A.saoka A. 1978. Observation procedure of settlement predic-tion. Soils and foundations, Vol. 18, No. 4, 1978. Japenese Society of Soils Mechanics and Foundation Engineering, dec 1978, pp. 87-i0,1
Brown D.A.,Reese L.C. & O'Neill, M.W.1987. Cyclic lateral loading of a large scale pij.e groupe .Journal of Geotechnical Enginnering, 1987;Vol. 11-3(11), pp. 1326-1343
G.Poulos, H. 1982. Single pile response to cyclic lateral. Jour-nal of Geotechnical Engineering Div.ision ASCE, 1982, Vol. 108(GT), pp. 355-375
Hamilton, J.M.,.Dunnavant, T.W & Murff, J.D.
199l.Centrifuge study of laterally loaded behavior in clay . Centrifuge 1991, pp. 285-292
House A.R, Oliveira, J.R.M.S. & Randolph .:t>.·:i::F. 2001. Evalu-ating the coefficient of consolidation using penetration tests. International Journal of Physical Modelling in Geotechnics 3 (2001), pp. 17-26
Ilyas, T.; Leung, C.F., Chow, Y.K. & Budi, S.S. 2004. Centri-fuge model study· of laterally loaded pile groups in clay. Journal of Geotechnical and Geoenvironmental engineering, 2004, Vol. 130(3), pp. 274-283
Kitazume, M. & Miyajima, S. 1994. Lateral resistance of a long pile in soft clay. Centrifuge 1994, pp. 485 -490
Magnan JP & Deroy JM. 1980. Analyse graphique des courbes de consolidation oedom6trique. Bulletin de Liaison des FontS et Chauss6es, sep-oct. 1980, pp. 53-56
Magnan JP & Deroy JM. 1980. Analyse graphique des tasse-ments observes sous les ouvrages. Bulletin de Liaison des Pants et Chaussees, sep-oct. 1980, pp. 45-52
Reese. L & Welch.R. 1975. Lateral loading of deep founda-tions in stiff clay. Journal of geotechnical engineering divi-sion, Proceedings of the American Society of Civil Engi-neering, Vol.101, No. GT7, July, 1975, pp. 633-649 Rosquoet, F. 2004. Pieu sous charge lattirale cyclique. These de
Doctorat, Ecole Centrale de Nantes, Universite de Nantes, France, 305p. (in French).
Purzin A, Frydman S & Talesnick, M. 1995. Nonnalized non-degrading behavior of soft clay under cyclic simple shear loading. Journal of Geotechnical Engineering, 1995, Vol. 121(12), pp. 836-843
Tassios, .T & E. Levendis E. 1974. Efforts tept'ititifs horizon-taux sur pieux verticaux, Annates de l'institut teclmique du b8.timent et des travaux publics .No. 315, 1974, pp. 45-71