XXX-X-XXXX-XXXX-X/XX/$XX.00 ©20XX IEEE
Experimental Analysis and Assessment of a HIT
Photovoltaic Module
Sofiane HADDAD
1, Abdelhamid RABHI
2, Ammar SOUKKOU
1, Mohammed Hassan ALI
3,
Ahmed ELHAJJAJI
21Electronics Department, MSBY Jijel University, Jijel, Algeria
2Modeling, Information and Systems Laboratory, University of Picardie Jules Verne, Amiens, France 3
University of Djibouti, Research Center of Djibouti University, Djibouti
[email protected] ; [email protected] ; [email protected];
Abstract—Assessment of solar module’s performance using real I–V (current-voltage) characteristics is strongly dependent on its operating environments. In this paper, the effects of sudden fluctuating of the meteorological conditions on the I–V measurements and PV power output, of a HIT (Heterojunction with Intrinsic Thin layer) PV module, have been investigated. The used data have been collected from a platform of PV system installed by MIS laboratory at Amiens, (France). Collected data have been adjusted every five minutes. Results obtained from evaluated I–V characteristics have been analysed in order to achieve a better understanding of the performance changes of the investigated PV module and the behaviour of the output power, under random effect caused by weather conditions. The suggested procedure is not only limited to a specified PV module technology and region, it could be used to meet the growing needs of electricity service providers to better manage of grid-connected PV systems.
Keywords—Experimental analysis, photovoltaic module, I–V curves, analytic indicators
I. INTRODUCTION
Solar energy is the most promising and powerful energy source among renewable energies [1-4]. Photovoltaic (PV) is a technology involving the direct conversion of solar insolation (radiation) into electricity using solar cells. PV solar cells have been used for many years to provide electricity to isolated consumers and remote electrical installations that are not connected to a grid. However, the amount of electricity produced depends mainly on the quality of the light available and the efficiency of the PV cells. The conversion efficiency of a PV cell is the percentage of the solar energy shining on a PV device that is converted into electricity. Improving this conversion efficiency is a key goal of research and helps make PV technologies cost-competitive with more conventional sources of energy. The efficiency of a solar cell rely upon various physical parameters such as series resistance (Rs), shunt resistance (Rsh), ideality factor (A), photocurrent (Iph) and saturation current (Is) [5-8].
Solar irradiance is very much affected by changes in weather. On clear days, a surface receiving solar energy will capture mainly direct radiation. On cloudy days, the surface will receive mostly diffuse radiation because direct radiation has been obstructed by the clouds. Hence, clouds have a large impact on the solar irradiance received by a PV cell. Locations where cloud cover occurs continuously during weeks at a time can present challenges and PV systems will have to be larger to meet energy needs. Some power can be
generated even under overcast conditions, but it is just a fraction of what is available during sunny, clear-sky conditions [1, 9-12].
Minimizing PV power losses is an area of study currently attracting a significant amount of research and development [11-15]. The variation of PV generation depends on deterministic and random aspects. Deterministic aspects are related to data and time of the year whereas random aspects are linked to weather conditions [14- 17].
The present study used the I–V measurements to analyse the effects of weather conditions (mainly clouds) on PV modules output power. It is well recognized that cloud particles not only scatter radiation but also absorb infrared radiation and reflect some of the radiation back to space, changing in this way the amount and spectral quality of solar radiation reaching the Earth's surface [18-21], and therefore affect solar PV system efficiency.
This paper is organized as follows. Section 2 describes the data acquisition system used to evaluate the performance of PV modules. Section 3 provides the used methodology for the conduct of this study. Analytic indicators to assess the performance of the investigated PV modules have been presented in Section 3, which is followed in section 4 by a discussion of how to state the main results. Final conclusions and directions for future work are reported in Section 5.
II. DATA ACQUISITION SYSTEM
In order to conduct a comprehensive study of the relationship between PV power output and the meteorological conditions (solar irradiance and air temperature). The acquisition of the I-V curves was done using a PV system installed at Amiens, by MIS Laboratory of University of Picardie Jules Verne (UPJV) in France. The used PV module is a HIT power solar module (Sanyo 215Wc) which has 72 cells connected in series. Its main electrical specifications are reported in Table 1. The major components of the considered PV system include: meteorological measurement devices (thermocouple and pyranometer), electrical current and voltage sensors, a USB communication board, a programmable electric load and a PC equipped with a LabVIEW interface are the same defined in [22].
The data acquisition process was established during a selected typical-day from 9:16 until 17:16 with a measurement interval of 5 minutes which outcome a
database of 97 I–V characteristics and the same number of meteorological parameters (as shown in Fig. 1 and Fig. 2).
III. METHODOLOGY
The methodology consists of four complementary stages namely data acquisition, I–V characteristics evolution, analytic indicators, and maximum PV power controlling. Details of the procedure applied in this paper are as follows:
• Stage 1 data acquisition: real-time acquisition of I–V measurements and solar irradiance is carried out by LabVIEW software and data acquisition boards. This implementation based on a PC and standard operating systems constitutes a great trend in PV power controlling automation (see Fig. 2 -left). The experimental setup and the monitoring system are the same described in [22].
• Stage 2 I–V characteristics evolution: A set of 97 I–V measurements is used to follow the factors affecting PV output (See Fig. 2 -right). The evolution of I–V characteristics itself will be further analyzed to obtain the final results. • Stage 3 analytic indicators: In order to analyze
the evolution of the I–V characteristics we calculate three selected analytic indicators from the I–V curves of the PV module, and investigating if there are any changes in these indicators. Any significant changes in these parameters can indicate the presence of a factor causing power loss on the PV module side. • Stage 4 comparison and verification: Using I–V
characteristics data in normal operating conditions and in abnormal operating conditions (under shading effects, mostly, caused by moving clouds), we have tracked the experimental maximum power point (MPP) to take into account the power output variations of the PV module in the previous analysis.
The used analytic indicators are described in the following sub-sections.
A. Equivalent series-resistance determination
The equivalent series resistance is one of the most significant factors which influence the performance of PV modules. The slope of the I–V curve between Vmpp and Voc is affected by the amount of series resistance internal to the PV modules and in the array wiring. Increased resistance reduces the steepness of the slope and decreases the fill factor (FF). In [23] the authors showed that the equivalent series resistance under illuminated conditions can be calculated from the slope of the I–V curve in the vicinity of the MPP, using the following expression:
0.75 = − = dV Rs dI I Impp (1)
where Impp and Vmpp represent the current and the voltage at MPP, respectively.
The estimation of Rs requires the measurement of two points from the I-V curve to calculate the discrete
approximation dV/dI. Additionally, it is required to measure the current at the MPP.
B. Equivalent thermal voltage calculation
The equivalent thermal voltage (See Eq. (2)) is sensitive to the presence of certain types of partial shadows that have a large heterogeneous or partial impact on the I–V curve. This occurs due to the activation of bypass diodes and the presence of inflexion points in the I–V curve [23-25].
(
)(
)
(
)
2 ln − − = − − − Vmpp Voc Isc Impp Vte Isc Impp Impp Isc Impp Isc(2)
where Voc is the open-circuit voltage, and Isc is the short circuit current.
C. Shading strength factor (SSf)
The shading strength is defined as the amount of lost irradiance due to shading divided by the total irradiance without shading [26]. The PV power of the global maximum power point decreases (the PV power losses increases), if the shading strength percentage (SS) increase. The SSf can be defined as: (%) 100 max ∆ = G × SSf G (3)
where ∆G is the irradiance difference between two consecutive measurements and Gmax is the maximum of that two irradiance measurements.
IV. RESULTS AND DISCUSSION
The indicators presented previously (Section 3) have been evaluated experimentally by using a HIT PV module. The experimental data, which based on empirical observations, were taken in a typical cloudy day. In case of moving clouds, the PV module is randomly shaded and the PV power operates under non-uniform conditions. The maximum power is generated at only one point on the power curve; this occurs at the knee of the curve. This point represents the maximum efficiency of the device in converting sunlight into electricity. Each I–V curve has a set of distinctive operation points that should be understood in order to appropriately install and diagnose PV power systems. Fig. 2 shows how the I–V curve of the PV module is affected at different irradiance levels.
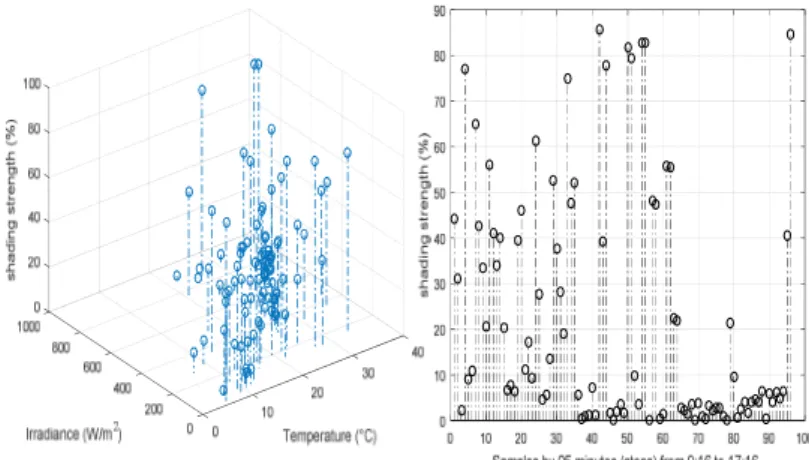
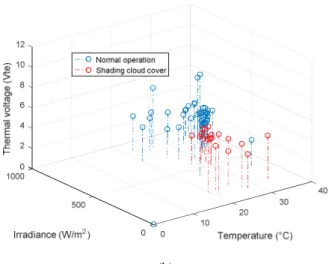
The amount of current produced is directly proportional to increases in solar irradiance intensity. Basically, Voc does not change, its behaviour is essentially constant, even as solar irradiance intensity is changed (voltage drop 1.23%, see Table 2). In the following, we show how shading affects the global PV power and causes losses due to operation at a local MPP. The global PV power decreases if the shading strength factor increases as can be seen in Fig. 3 and Fig. 4. Thus, high value of shading strength will cause lower power output, higher equivalent series resistance (See Fig. 5). Therefore, changes in the module current at MPP (Imp), as well as changes in Vmp have direct impact on the value of Vte. Accordingly, the equivalent thermal voltage could be used to detect partial shades on small ranges; it shows a dependency on the irradiation, presenting a decreasing value as the clouds passing in front of the sun.
A base value of each analytic indicator is determined from real data of the I–V curves of the PV module during normal-irradiance conditions as follows:
1 ( , ) , = ∑N j base N Rs Rs j IVj Gj (4) 1 ( , ) , = ∑N j base N Vte Vte j IVj Gj (5) 1 ( , ) = ∑N j base N SS SSj IVj Gj (6)
where IVj is the j-th I–V curve measured at the irradiance Gj. Rs,j , Vte,j, and SSj are the raw values of the equivalent series-resistance, the equivalent thermal voltage and the shading strength factor, respectively, calculated from j-th I–V curve.
With respect to Table 2, a 44.75% global maximum power (of the whole day: 08 hours) drop caused by fluctuation of solar irradiances. Note that this loss of PV power is a distinctive case study of a relatively cloudy day (09th October 2015) where shading has a random effect and may be uniform or non-uniform (generally, depends on the size of the photovoltaic installation).
When solar irradiance passes from a high value to a low value (i.e. from 700 W/m2 to 200W/m2) and the PV module is completely shaded, the characteristic I–V has no other inflection points and appears with normal evolution, in this case the SS factor presents a good indicator to reflect the rapid change in irradiation. It can be seen clearly that around 1.23% global voltage drop and 9.40% thermal voltage drop occur when PV power swings from a high level to a lower level. From the numerical values of different parameters and the analytic indicators, reported in Table 2, the variations produced in Voc, Isc, Vmpp, Impp and Pmpp could be used to propose other indicators to analyze the change of other parameters appearing in the PV models, such as the ideality factor, reverse saturation currents and the parallel resistance.
V. CONCLUSION
In this paper, the effects of meteorological conditions on a HIT photovoltaic module performance have been analyzed and discussed. The performed experimental tests provide an investigation of the effects of the cloud cover on the main electrical characteristics of the PV module (based on empirical observations). This work is aiming at helping photovoltaic energy system operators to seek optimum operating performance, in order to assess the energy production of their PV systems.
The performance of the proposed procedure is verified using measured I–V and P–V curves, from 9:16 am to 5:16 pm by 05 minutes step (8 hours). It has been shown that, the global PV power losses can reaches 44.75% on the selected daytime, using a HIT PV module technology at a specific location, nevertheless it can be applied for other PV module technologies and areas. The main advantage is that it doesn’t require any complicated controls and it avoids logarithmic and exponential calculations, so it can be easily used by operators working in PV systems area. However this work could be extended to include a broader range of indicators
using simplified expressions published in the literature and based on real data acquisition.
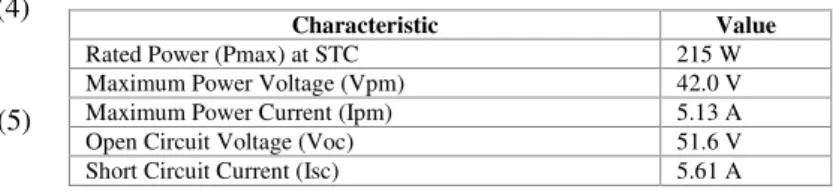
TABLE I.PVMODULE ELECTRICAL SPECIFICATIONS.
TABLE II.ANALYTIC INDICATORS:INCREASING/DROPPING PERCENTAGE.
Fig. 1. a) PV module temperature (left) and b) solar irradiance (right), for one day (09th October 2015).
Parameters Voc (V) Isc (A) Vmpp (V) Impp (A) Pmpp (W) Vte (V) SSf (%) Rs cell (Ω) Base values in normal operation 43.52 5.343 35.173 4.636 163.062 3.127 12.9 0.710 Base values under shading effects 42.98 2.740 36.743 2.452 90.094 2.833 70.3 2.089 Increasing percentage (%) - - 4.46 - - - 81.7 194.23 Dropping percentage (%) 1.23 48.72 - 47.11 44.75 9.40 - - Characteristic Value
Rated Power (Pmax) at STC 215 W
Maximum Power Voltage (Vpm) 42.0 V
Maximum Power Current (Ipm) 5.13 A
Open Circuit Voltage (Voc) 51.6 V
(e)
Fig. 2. The test facility at Amiens, University of Picardie Jules Verne (France). (a) The platform of PV energy containing the used module: Sanyo HIT Power 215N, (b) Electrical load, current and voltage sensors, (c) Acquisition card, (d) LabVIEW acquisition interface (left) [22], (e) I–V raw data, 05 minutes-step 97 I–V characteristics evolution from 09:16 to 17:16 (right).
Fig. 3. Shading strength factor variations as a function of solar irradiance and module temperature (left) and its variation each five minutes time step (right), (09th October 2015).
Fig. 4. Maximum power point variations (09th October 2015).
(a) (b)
(a)
(c) (d)
(b)
Fig. 5. Equivalent series resistance of the PV module (a), thermal voltage variations (b).
ACKNOWLEDGMENT
The authors would like to thank the Modelling, Information and Systems (MIS) laboratory at Amiens, University of Picardie Jules Verne, France, for the provided facilities and databases.
REFERENCES
[1] Bühler J, Gasparin F. P, Krenzinger A. Post-processing data of measured I–V curves of photovoltaic devices. Renew. Energy 2014; 68:602–610.
[2] Shahnazari M.R,. Lari H.R. Modeling of a solar power plant in Iran. Energy Strat. Rev.2017;18:24–37.
[3] Griffiths S, Mills R. Potential of rooftop solar photovoltaics in the energy system evolution of the United Arab Emirates, Energy Strat. Rev. 2016;9:1–7.
[4] Reinoso C. R. S. Milone D. H, Buitrago R. H. Simulation of photovoltaic centrals with dynamic shading, Appl. Energy. 2013;103:278–289.
[5] Alam D.F, Yousri D.A, Eteiba M.B. Flower Pollination Algorithm based solar PV parameter estimation, Energy Conv. Manage.,2015;101:410–422.
[6] Babu B. C, Gurjar S. A Novel Simplified Two-Diode Model of Photovoltaic (PV) Module, IEEE J. Photovoltaics. 2014;4:1156-1161. [7] Hassan Ali M, Rabhi A, Haddad S. A. EL Hajjaji. Real-Time Determination of Solar Cell Parameters, J. Electronic Materials. 2017;1–9, https://doi.org/10.1007/s11664-017-5697-0
[8] Muhsen D. H, Ghazali A. B, Khatib T, Abed I. A. Parameters extraction of double diode photovoltaic module’s model based on hybrid evolutionary algorithm, Energy Conv. Manage. 2015;105:552– 561
[9] Giraud F. Salameh Z. M. Analysis of the Effects of a Passing Cloud on a Grid-Interactive Photovoltaic System with Battery Storage using Neural Networks. IEEE Trans. Energy Conv. 1999;14:1572–1577 [10] Bouraiou A, Hamouda M, Chaker A, Mostefaoui M, Lachtar S, Sadok
M, Boutasseta N, Othmani M, Issam A. Analysis and evaluation of the impact of climatic conditions on the photovoltaic modules performance in the desert environment, Energy Conv. Manage 2015;106 :1345–1355.
[11] Lipperheide M, Bosch J.L, Kleissl J. Embedded nowcasting method using cloud speed persistence for a photovoltaic power plant, Sol. Energy 2015;112:232–238.
[12] Paulescu M, Badescu V, Brabec M. Tools for PV (photovoltaic) plant operators: Nowcasting of passing clouds, Energy 2013;54:104–112. [13] Brabec M, Badescu V, Paulescu M, Dumitrescu A. A new perspective
on the relationship between cloud shade and point cloudiness, Atmosph. Research 2016;172–173:136–146.
[14] Roy S. Statistical estimates of short duration power generated by a photovoltaic unit in environment of scattered cloud cover. Energy 2015;89:14–23.
[15] Amrouche B, Sicot L, Guessoum A, Belhamel M. Experimental analysis of the maximum power point's properties for four photovoltaic modules from different technologies: Monocrystalline and polycrystalline silicon, CIS and CdTe, Sol. Energy Materials & Sol. Cells 2013;118:124–134.
[16] Kankiewicz A, Sengupta M, Moon D. Observed impacts of transient clouds on utility-scale PV fields. In: Solar 2010 Conference Proceedings, (2010)
[17] Tzoumanikas P, Nikitidou E, Bais A.F, Kazantzidis A. The effect of clouds on surface solar irradiance, based on data from an all-sky imaging system, Renew. Energy 2016;95:314–322.
[18] Adam M. E, Ahmed E. A. Comparative analysis of cloud effects on ultraviolet-B and broadband solar radiation: Dependence on cloud amount and solar zenith angle. Atmosph Research 2016;168:149–157. [19] Kanniah K. D, Beringer J, Hutley L. Exploring the link between clouds, radiation, and canopy productivity of tropical savannas, Agric. Forest Meteorology 2013;182– 183:304– 313.
[20] Furlan C, de Oliveira A. P, Soares J, Codato G, Escobedo J. F. The role of clouds in improving the regression model for hourly values of diffuse solar radiation, Appl. Energy. 2012;92:240–254.
[21] Tzoumanikas P, Nikitidou E, Bais A.F, Kazantzidis A. The effect of clouds on surface solar irradiance, based on data from an all-sky imaging system, Renew. Energy. 2016;95:314–322.
[22] Boutana N, Mellit A, Haddad S, Rabhi A, Massi Pavan A. An explicit I-V model for photovoltaic modul A.e technologies. Energy Conv. Manage. 2017;138:400–412.
[23] Spataru S, Sera D, Kerekes T, Teodorescu R. Diagnostic method for photovoltaic systems based on light I–V measurements, Sol. Energy. 2015;119 :29–44.
[24] Sera D, Spataru S, Mathe L, Kerekes T, Teodorescu R. Sensorless PV array diagnostic method for residential PV systems. Proceedings of the 26th Eur. PV Sol. Energy Conf. & Exhib., Hamburg, Germany, 2011; 5–9 Sept:3776–3782.
[25] Silvestre S, Boronat A, Chouder A. Study of bypass diodes configuration on PV modules. Appl. Energy. 2009;86:1632–1640 [26] Mäki A, Valkealahti S. Power Losses in Long String and
Parallel-Connected Short Strings of Series-Parallel-Connected Silicon-Based Photovoltaic Modules Due to Partial Shading Conditions. IEEE Trans. Energy Conv. 2012;27:173–183.