Burkina Faso
Frieda Vandeninden, Rebekka Grun, and Amina Semlali
Social Protection and Jobs
Africa Region
Executive Directors of The World Bank or the governments they represent. The World Bank does not guarantee the accuracy of the data included in this work. The boundaries, colors, denominations, and other information shown on any map in this work do not imply any judgment on the part of The World Bank concerning the legal status of any territory or the endorsement or acceptance of such boundaries. Rights and Permissions
The material in this publication is copyrighted. Copying and/or transmitting portions or all of this work without permission may be a violation of applicable law. The International Bank for Reconstruction and Development/The World Bank encourages dissemination of its work and will normally grant permission to reproduce portions of the work promptly.
For permission to photocopy or reprint any part of this work, please send a request with complete information to the Copyright Clearance Center, Inc., 222 Rosewood Drive, Danvers, MA 01923, USA, telephone 978-750-8400, fax 978-750-4470, http://www.copyright.com/. All other queries on rights and licenses, including subsidiary rights, should be addressed to the Office of the Publisher, The World Bank, 1818 H Street NW, Washington, DC 20433, USA, fax 202-522-2422, e-mail [email protected]. Design/layout and editing. Nita Congress
Photo credits. Cover: Kelley Lynch/GPE; chapter 2: Dominic Chavez/The Global Financing Facility; all others: Ollivier Girard/CIFOR. Creative Commons CREATIVE-COMMONS license: https://creativecommons.org/licenses/ by-nc-nd/2.0/legalcode
v
acknowledgments vi
foreword viii
abbreviations x
executive summary
xii
chapter 1: introduction xxiv
Background 2
Purpose and structure 5 Conceptual framework 6
chapter 2: social protection needs: analysis of risks and vulnerabilities 10
Poverty and vulnerability trends 12
Trends in nonmonetary welfare indicators 18 Poverty along the life cycle 20
chapter 3: institutional framework and spending review
30
An emerging social protection strategy 32
Institutional and coordination arrangements 36 Social spending trends 41
Focus on social safety net spending: a multitude of small programs 50
chapter 4: social safety nets assessment: do the programs meet the needs? 54
Coverage, gaps, and overlaps 56
Targeting accuracy and cost-effectiveness 68 Sustainability 76
Monitoring and evaluation 79
chapter 5: recommendations and concluding remarks 80
Recommendations 82 Concluding remarks 92
appendix A: Burkina Faso’s main social safety net programs 93
appendix B: HEA in Burkina Faso
115
appendix C: PMT in Burkina Faso
117
appendix D: social safety net coverage by region and share of poor
119
appendix E: glossary of social protection terms 120
references 122
vi
T
he team offers particular thanks to the government of Burkina Faso, especially the offi-cials working on social protection programs, as well as the partners and stakeholders supporting the strengthening of the nation’s social protection system.The report was produced under the overall leadership and guidance of Rebekka Grun, Team Leader and Senior Economist. The main authors of this report are Frieda Vandeninden, Econ-omist; Amina Semlali, Senior Human Development Specialist; and Rebekka Grun.
Invaluable team members include Inés Rodriguez Caillava, Operations Analyst, who assisted with numerous aspects of the report; and Chantal Lewis, Consultant, who coordinated the field data collection. Lydie Anne Billey, Program Assistant, provided administrative sup-port; Bruno Bonansea, Cartographer, produced the report maps. Bram Vandermeulen, then a student at Maastricht University, helped develop different simulation scenarios on gas subsidy reform. The authors also acknowledge the valuable contributions by editor and graphic designer Nita Congress. The authors would particularly like to thank the local Social Protection team in Burkina Faso: Ayaba Gilberte Kêdoté, Social Protection Specialist, Cath-erine Marie Z. Compaore, Team Assistant, and Roland Berenger Béréhoudougou, Program Coordinator, Sahel Adaptive Social Protection. The team is very grateful for the help Karime Ganemtoré, Permanent Secretary at the National Council for Social Protection, and his team provided.
The authors give special thanks to Aminiata Nana Tou, Director of Budget Planning, Ministry of Finance; Tamboura Nadine, Director of NGO Cooperation, Ministry of Finance; Stella Somé, Director, Ministry of Public Affairs; Soumaila Sakandé, Coordinator, High Intensity Labor and Public Works Project; Abdoulaye Sawadogo, Department of Scholarships, FONER; Sylvain Nkenkeu, Senior Social Inclusion Program Officer, UNICEF; Francis Oubda, Social Policy Spe-cialist, UNICEF; and Fanta Sedogo, Health and Social Protection Program Manager, European Union.
The report benefited greatly from comments and input by peer reviewers Emma Mercedes Monsalve Montiel, Economist; and Inés Rodriguez Caillava, Operations Analyst; as well as from comments and input by Ruslan G. Yemtsov, Lead Economist; Roland Berenger Béréhoudougou, Program Coordinator; Mame Fatou Diagne, Senior Economist; Prospere R.
Weber, Senior Economist. Moreover, preparation of this report was significantly aided by the guidance, advice, and support of many managers and colleagues within the World Bank, including Jehan Arulpragasam, Practice Manager; and Cheick Kanté, World Bank Country Manager, Burkina Faso.
Finally, the report greatly benefited from the foundational work in the field of social safety nets in Burkina Faso, notably the 2011 social safety nets review authored by Cécile Cherrier, Carlo del Ninno, and Setareh Razmara.
The authors are grateful for the assistance and support received, and apologize for any omis-sions.
viii
S
ocial safety nets—predictable cash transfers to poor households, often in exchange for children going to school or for regular health checkups—have become one of the most effective poverty reduction strategies, helping the poor and vulnerable cope with crises and shocks. Each year, social safety net programs in developing countries lift an estimated 69 million people out of absolute poverty and some 97 million people from the bottom 20 per-cent—a substantial contribution in the global fight against poverty. Almost every developing country now has a set of social assistance programs and other social protection measures— conditional and unconditional cash transfers, school feeding programs, public works, and some form of health insurance and pension coverage for the elderly—interventions that, in principle, help poor households manage risks and invest in their livelihoods.For a long period, the majority of countries in Africa implemented social safety nets and social protection programs only on an ad hoc basis. However, in the wake of the global economic, food, and fuel price crises starting in 2008, policy makers in Africa increasingly viewed social safety nets as core instruments for reducing poverty and helping vulnerable households man-age risk. Life in today’s globalized world is indeed fraught with a complex mix of risks, and rapid climate change is among the most pressing. We are now seeing how social safety net programs can play a huge role in disaster preparedness and response after a crisis. When the Southern Africa region was hit by the worst drought in 35 years, cash transfers were the primary response to support the recovery for some 32 million people who were food insecure due to the drought.
In less than a decade, social safety nets in Sub-Saharan Africa have become a core part of development strategies. Throughout the continent, social safety nets have changed the lives of millions of vulnerable people for the better. What is more, Africa has indeed become a great innovator in social safety nets, pushing the frontiers in many areas.
But the countries also face many challenges in their attempts to bring their social safety nets to scale and ensuring their sustainability. To support governments in their quest to improve the efficiency and effectiveness of safety nets in their countries, the World Bank’s Africa Region undertook social safety net or social protection assessments in a number of coun-tries in Sub-Saharan Africa, including Burkina Faso. These assessments analyze the status
African safety net systems and social protection programs to protect and promote poor and vulnerable people. They were all carried out with the explicit aim of informing governments’ social protection policies and programs.
The government of Burkina Faso has shown a strong interest in learning how to strengthen its social safety net provision to better support the country’s poorest and most vulnerable households. This book was produced in response to a request by its Ministry of Economy and Finance.
I am particularly excited to share the main takeaway from this book: With a few focused courageous policy decisions, several of the issues of the Burkinabe social protection system can be converted into opportunities. Most importantly, with improved targeting, Burkina Faso could technically eradicate poverty! The size of the actual poverty gap equals 2.26 percent of gross domestic product, which is close to the actual spending on social safety nets. This would be achievable by targeting existing social safety net expenditures better. Reallocating regressive subsidies and programs that mainly benefit the rich would open up the needed fis-cal space.
Finally, it is worth noting that this book is relevant beyond Burkina Faso. It offers important lessons from which a global audience can benefit. I hope you enjoy reading it as much as I have.
Michal Rutkowski Senior Director and Head of Global Practice Social Protection and Jobs World Bank Group
x
CARFO Independent Pension Fund for Civil Servants (Caisse autonome de retraite des fonctionnaires)
CIOSPB National Center for Information, Educational and Vocational Guidance and Scholarships (Centre national de l’information, de l’orientation scolaire et professionnelle, et des bourses)
CNSS National Social Security Fund (Caisse nationale de sécurité sociale)
CNPS National Council for Social Protection (Conseil National de Protection Social) CRS Catholic Relief Services
ECD early childhood development
EMC Continuous Multisectoral Survey (Enquete Multisectorielle Continue)
FONER National Fund for Education and Research (Fonds National pour l’Éducation et la Recherche)
GDP gross domestic product HEA household economy approach M&E monitoring and evaluation NGO nongovernmental organization
PEJDC Youth Employment and Skills Development Project (Projet d’emploi des jeunes et de développement des compétences)
PMT proxy means testing
PTR-HIMO Labor-Intensive Roadwork Project (Projet Travaux Routiers à haute intensité de main d’œuvre)
SAP Early Warning System (Système d’Alerte Précoce)
SONAGESS National Society for the Management of Food Security (Société nationale de gestion des stocks de sécurité)
WFP World Food Programme WHO World Health Organization
All dollar amounts are U.S. dollars unless otherwise indicated. For currency conversions, the average 2018 exchange rate is used: $1 = CFAF 565.71.
xii
Introduction and purpose
The government of Burkina Faso has a strong interest in strengthening its social safety nets provision to better support the country’s poorest and most vulnerable households. It has demonstrated this commitment through past investments in social pro-tection.Against a backdrop of limited public finances and budgetary constraints, it is critical to ensure that the resources allocated for social protection—and in particular for social safety nets— are cost-effective. This report responds to a request by the Burkinabe Ministry of Finance to
Enhance knowledge about the current state of social safety nets and assess their effectiveness in meeting the needs of the poor;
Inform a debate on feasible reform and policy options to make social safety nets in Burkina Faso more effective and of greater impact and able to contribute to a con-solidation of expenditure.
Main challenges demanding
renewed social safety nets
Poverty, risk, and vulnerabilities
The country’s sustained economic growth has not benefited the majority of Burkinabes. An annual gross domestic product (GDP) growth rate exceeding 6 percent, on average, from the early 2000s to 2014 did not translate into comparable per capita gains, which only increased 2.6 percent from 2006 to 2013.
A high demographic growth rate is an obstacle for future poverty reduction. With 5.4 children per woman, Burkina Faso has one of the highest fertility rates in the world, offset-ting GDP growth and hampering rapid reductions in poverty. The population is projected to increase from an estimated 19.2 million in 2017 to 29 million in 2030.
more vulnerable in case of adverse events. As of 2014, 40.1 percent of Burkinabes were poor and lived on less than $1.90 a day. Using the international poverty line standard of $3.10 a day, Burkina Faso’s poverty rate increases to 75 percent.
Burkina Faso increasingly faces adverse natural conditions and is highly vulner-able to exogenous shocks and regional insecurities. This high level of exposure to shock exacerbates the vulnerability of the poor in particular; it also increases the risk of the nonpoor falling into transitional poverty.
Households hit by shock are often forced to adopt negative coping strategies, such as selling assets, which can lead to chronic poverty. Only 2.4 percent of all households affected by shock receive support from either the government or nongovernmental organizations, although several food programs have been implemented to mitigate the impact of shocks.
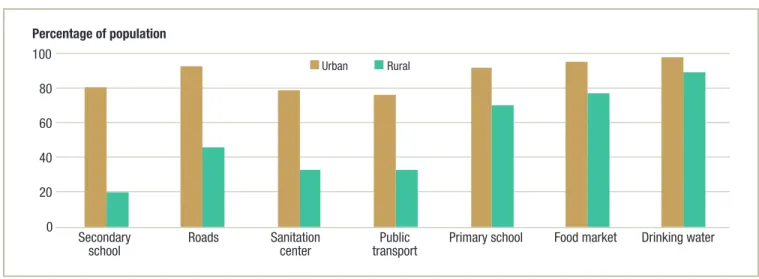
Ninety percent of the poor live in rural areas. Expo-sure to, and the impact of, shocks is greater in rural areas (figure ES.1). Reasons for this include the fact that such areas tend not to be reached by services; and the population is dependent on climate-sensitive agriculture. The increased vul-nerability of the rural population in turn exacerbates poverty.
Disparities in access to public facilities remain high in rural areas. Examples are provided in figure ES.2.
FIGURE ES.1
Population exposure to shock and
poverty rates
0 20 40 60 80 Exposure to ≥ 1shock per year Poverty rate Transient povertyrate Urban Rural All
Percentage of population
SOURCE: Authors’ calculations based on EMC 2014.
FIGURE ES.2
Urban and rural population access to public facilities
0 20 40 60 80 100 Secondary
school Roads Sanitationcenter transportPublic Primary school Food market Drinking water Urban Rural
Percentage of population
SOURCE: Authors’ calculations based on EMC 2014. NOTE: Access means within a 30-minute walk.
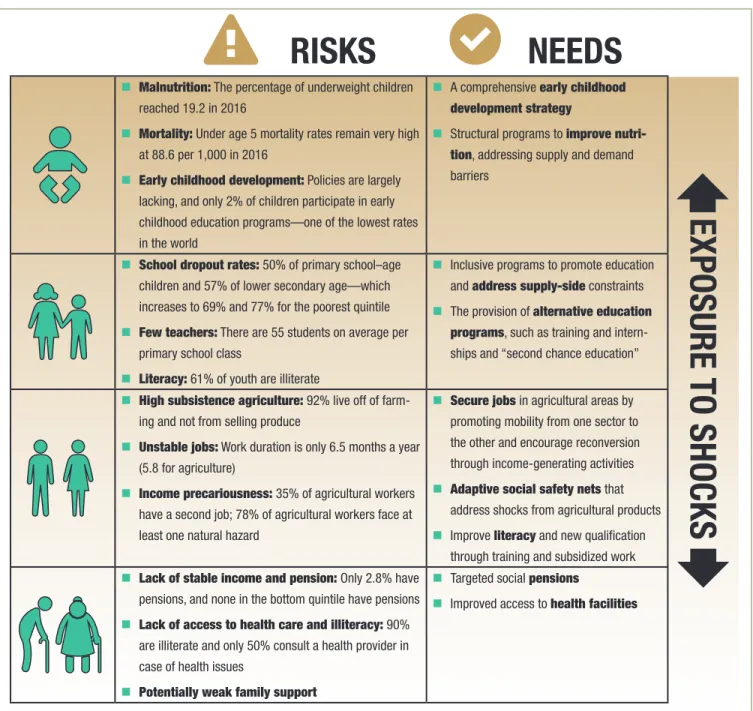
Looking at poverty headcounts by age groups and risks along the life cycle offers important insights on where public interventions should focus. Risks are not homogeneously distributed and are typically higher in earlier stages of life, with important long-term—and sometimes irreversible—consequences in later stages of life (figure ES.3).
FIGURE ES.3
Key risks, the life cycle, and social protection in Burkina Faso
Malnutrition: The percentage of underweight children
reached 19.2 in 2016
Mortality: under age 5 mortality rates remain very high
at 88.6 per 1,000 in 2016
Early childhood development: Policies are largely
lacking, and only 2% of children participate in early childhood education programs—one of the lowest rates in the world
A comprehensive early childhood development strategy
Structural programs to improve nutri-tion, addressing supply and demand
barriers
School dropout rates: 50% of primary school–age
children and 57% of lower secondary age—which increases to 69% and 77% for the poorest quintile
Few teachers: There are 55 students on average per
primary school class
Literacy: 61% of youth are illiterate
Inclusive programs to promote education
and address supply-side constraints
The provision of alternative education programs, such as training and
intern-ships and “second chance education”
High subsistence agriculture: 92% live off of
farm-ing and not from sellfarm-ing produce
Unstable jobs: work duration is only 6.5 months a year
(5.8 for agriculture)
Income precariousness: 35% of agricultural workers
have a second job; 78% of agricultural workers face at least one natural hazard
Secure jobs in agricultural areas by
promoting mobility from one sector to the other and encourage reconversion through income-generating activities
Adaptive social safety nets that
address shocks from agricultural products Improve literacy and new qualification
through training and subsidized work
Lack of stable income and pension: only 2.8% have
pensions, and none in the bottom quintile have pensions
Lack of access to health care and illiteracy: 90%
are illiterate and only 50% consult a health provider in case of health issues
Potentially weak family support
Targeted social pensions
Improved access to health facilities
RISKS
NEEDS
FIGURE ES.4
Social protection expenditures by
category: 2015
0 0.5 1.0 1.5 2.0 2.5 3.0 3.5 4.0 4.5 Socialsafety nets subsidiesGeneral insuranceSocial Labor mktprograms Total socialprotection
Billion CFAF
SOURCES: Estimates based on CNPS 2015b, 2016b; SE-CNSA 2015, 2016.
Overall, social protection expenditure has increased at a steady pace over the past decade. However, spending trends have varied by
category of social protection (figure ES.4).
Expenditures for energy subsidies have experi-enced a downward trend. Electricity subsidies, for example, weighed down the national budget during the last decade; in 2016, the government took major steps to address this.
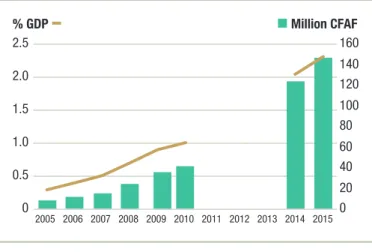
Expenditures for social safety nets increased over the 2005–15 decade. These expenditures accounted for 0.3 percent of GDP in 2005 and rose to 2.3 percent in 2015, indicating an increasing appetite for finding new methods of protecting the poor (figure ES.5). On average, Burkina Faso outspends other Sub-Saharan countries on social safety nets relative to GDP.
Composition of social safety
net expenditures
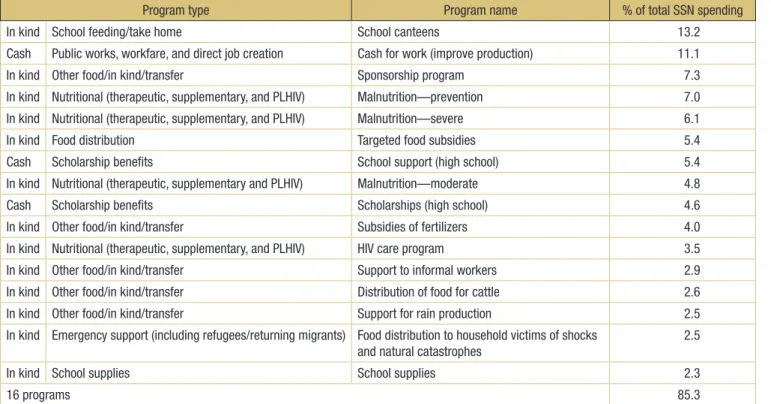
Burkina Faso’s social safety net programs are frag-mented. The country offers are more than 100 small social safety net programs, 80 of which account for less than 1 percent of total social safety net expenditure.
The Ministry of Social Action has the largest share of pro-grams (45), but the smallest share of total expenditure (3.4 percent). The Ministry of Economy and Finance has the largest expenditure share (28 percent) and the smallest program share (five).
Social safety net expenditures mainly go toward in-kind programs. Only 36 percent of expenditures are provided in cash (table ES.1).
Social safety net coverage
Social safety net coverage is not in line with pov-erty: only 2.6 percent of the entire population
benefits from safety net programs. For example, the fourth richest quintile (Q4) benefits more from all safety nets than does the absolute poorest quintile (Q1); scholarships benefit next to no poor (figure ES.6).
FIGURE ES.5
Social safety net expenditure total and as
a percentage of GDP, 2000–15
0 20 40 60 80 100 120 140 160 0 0.5 1.0 1.5 2.0 2.5 2005 2006 2007 2008 2009 2010 2011 2012 2013 2014 2015 Million CFAF % GDPSOURCES: World Bank 2012 for 2005–10; estimates for 2014–15 are based on CNPS 2015b and 2016b, and SE-CNSA 2015 and 2016.
NOTE: No social safety net estimates were produced for 2011–13 given the scar-city of data. The first CNPS annual report was produced in 2013, but the effort to track program expenditures was only at its beginning, and data were incom-plete and not comparable with previous estimates.
Program type Program name % of total SSn spending
In kind School feeding/take home School canteens 13.2
Cash Public works, workfare, and direct job creation Cash for work (improve production) 11.1
In kind other food/in kind/transfer Sponsorship program 7.3
In kind nutritional (therapeutic, supplementary, and PlHIv) Malnutrition—prevention 7.0 In kind nutritional (therapeutic, supplementary, and PlHIv) Malnutrition—severe 6.1
In kind Food distribution Targeted food subsidies 5.4
Cash Scholarship benefits School support (high school) 5.4
In kind nutritional (therapeutic, supplementary and PlHIv) Malnutrition—moderate 4.8
Cash Scholarship benefits Scholarships (high school) 4.6
In kind other food/in kind/transfer Subsidies of fertilizers 4.0
In kind nutritional (therapeutic, supplementary, and PlHIv) HIv care program 3.5
In kind other food/in kind/transfer Support to informal workers 2.9
In kind other food/in kind/transfer distribution of food for cattle 2.6
In kind other food/in kind/transfer Support for rain production 2.5
In kind emergency support (including refugees/returning migrants) Food distribution to household victims of shocks and natural catastrophes
2.5
In kind School supplies School supplies 2.3
16 programs 85.3
NOTE: PLHIV = people living with HIV; SSN = social safety net.
FIGURE ES.6
Social safety net coverage by program and quintile
0 1 2 3 4 All social
assistance Scholarships Government support(in case of shocks) Other transfers Support fromNGOs Food distribution
Total Q1 Q2 Q3 Q4 Q5
Percent
SOURCE: Authors’ calculations based on EMC 2014. NOTE: NGO = nongovernmental organization.
poorest and most vulnerable members of the population, yet only six of Burkina Faso’s main programs focus on the 0–5 age group. Furthermore, only 2 percent of the country’s children benefit from crucial early childhood development programs; this rate of coverage is the second lowest in the world after Afghanistan (figure ES.7).
Social safety net coverage is not aligned with pov-erty across the country’s regions. This is illustrated in figure ES.8.
Targeting
Targeting is not well aligned with poverty. Programs mainly target beneficiaries on a geographical basis. Data show that the largest concentration of beneficiaries of cash transfers (34.7 percent) is in the Central region, with only 8 percent from the North region, 6 percent from the East, and 3 percent from Boucle du Mouhoun—which are the three poorest regions.
Expenditures on “other transfers” are mainly directed toward the richest quin-tile (62 percent), with one-quarter accrued by the second poorest quinquin-tile. There is a distinct pattern in the distribution of beneficiaries: even though many beneficiaries are in the second poorest quintile, their transfers are small; while the large transfers are mainly col-lected by a few rich households (figure ES.9).
0 15 30 45
age 0–5 age 6–17 age 18–34 age 35–59 age 60+
Social safety net coverage Poverty rate
Percent
SOURCE: Authors’ calculations based on EMC 2014.
FIGURE ES.8
Social safety net coverage and poverty headcount ratio, by region
a. Social safety net coverage b. Poverty headcount ratio
CENTRAL NORTH PLATEAU CENTRAL NORTH SOUTH WEST MALI NIGER BENIN GHANA CÔTE D'IVOIRE CENTRAL WEST SAHEL BOUCIE DU MOUHOUN HAUTS-BASSINS CASCADES EAST CENTRAL EAST CENTRAL SOUTH CENTRAL TOGO
4°E 2°E 0° 2°E
4°E 2°E 0° 2°E 14°N 12°N 12°N 10°N 14°N 02040 60 80 0 20 40 60 80 Miles 100 Kilometers BURKINA FASO SOCIAL SAFETY NET COVERAGE
IBRD 44748 | JANUARY 2019
This map was produced by the Cartography Unit of the World Bank Group. The boundaries, colors, denominations and any other information shown on this map do not imply, on the part of the World Bank Group, any judgment on the legal status of any territory, or any endorsement or acceptance of such boundaries.
0.28 6.62 CENTRAL EAST SOUTH WEST SAHEL NORD BOUCIE DU MOUHOUN HAUTS-BASSINS CASCADES CENTRAL NORTH EAST CENTRAL SOUTH CENTRAL WEST
CENTRAL PLATEAU CENTRAL
MALI NIGER BENIN GHANA CÔTE D'IVOIRE TOGO
4°E 2°E 0° 2°E
4°E 2°E 0° 2°E 14°N 12°N 12°N 10°N 14°N 02040 60 80 0 20 40 60 80 Miles 100 Kilometers IBRD 44745 | JANUARY 2019
This map was produced by the Cartography Unit of the World Bank Group. The boundaries, colors, denominations and any other information shown on this map do not imply, on the part of the World Bank Group, any judgment on the legal status of any territory, or any endorsement or acceptance of such boundaries.
9.68 70.3
BURKINA FASO POVERTY HEADCOUNT RATIO
Sustainability
There are financing sustainability concerns with regard to Burkina Faso’s social safety nets. Only 50 percent of safety net programs are entirely financed by the govern-ment, which may undermine continued program predictability.
Low execution rates are also a cause for concern. Sustainability is further challenged by expenditure delays, resulting in low execution rates (59 percent of the allocated social safety net budget, excluding education and health programs). These expenditure delays raise questions about governance.
Subsidies
By redirecting energy subsidy expenditures (from the rich) toward social safety nets (to the poor), poverty and inequality would be improved. One of the fundamen-tal problems with energy and fuel subsidies is that they are disproportionately concentrated in the hands of the richer segments of the population. But there is an increasing awareness that there are less expensive yet more effective methods of protecting the poor.
The elimination of energy subsidies would not affect the poor, as the poorest barely consume any energy products (figure ES.10). Given the notable budget allo-cated to the sector (1.05 percent of GDP in 2015), savings from phasing out subsidies could enable a substantial increase in the social safety net budget. Simulations conducted for this review show that removing the gas subsidy alone would enable savings equivalent to 2.31 percent of GDP without affecting the poverty rate and the poverty gap.
0 20 40 60 80 100 a. Distribution of benefits Q1 Q2 Q3 Q4 Q5 0 20 40 60 80 100 Scholarships Government support (in case of
shocks)
Other
transfers Support fromNGOs distributionFood
b. Distribution of beneficiaries
Scholarships Other transfers
SOURCE: Authors’ calculations based on EMC 2014. NOTE: NGO = nongovernmental organization.
Institutional arrangements
Institutional arrangements and interministerial coordination mechanisms are the prerequisite for an effective social protection system to avoid overlap and duplication and to ensure a more coherent approach.
A single beneficiary registry minimizes inclusion and exclusion errors, while facilitating transparency and providing governments and partners with a cen-tral mechanism to identify potential program beneficiaries. The initiation of a much-needed such registry in Burkina Faso to identify, accurately target, and keep track of beneficiaries began in 2015 with the launch of the World Bank–supported unconditional cash transfer program Burkin-Naong-Sa Ya.
Notable efforts have been made to create a conducive institutional environment, such as the creation of new coordinating institutions since 2013 for improved cross-sectoral cooperation; and the weaving together of the many sectoral strategies into a single National Social Protection Strategy.
Despite these efforts, Burkina Faso’s social protection system and approach remains highly fragmented and weak. Most programs continue to operate in silos, with little communication between sectors and few attempts to explore synergies. Moreover, despite the adoption of the National Social Protection Strategy, numerous additional strate-gies have been endorsed.
The way forward
Recommendation 1: Strengthen the governance of the social safety net system.
Despite progress in reducing poverty and vulnerability in the past decade, Burkina Faso’s
Decile (poorest to richest)
0 20 40 60 80 1 2 3 4 5 6 7 8 9 10 a. Gas 0 20 40 60 80 1 2 3 4 5 6 7 8 9 10 b. Electricity 0 20 40 60 80 1 2 3 4 5 6 7 8 9 10 c. Fuel
Decile (poorest to richest) Decile (poorest to richest)
Percent Percent Percent
ernance needs to be strengthened. In this context, the following actions should be prioritized.
Action 1.1: Create a framework for multisectoral coordination.
Identify ministerial comparative advantages and clearly establish key actors’ respon-sibilities.
Review the institutional set-up under the stewardship of the central government. Use one overarching national social protection strategy.
Improve information and data collection systems and develop ministerial reporting mechanisms.
The National Council for Social Protection should assign internal groups with time-bound and specific output and outcome goals to ensure prioritization.
Action 1.2: Monitor and evaluate program effectiveness and impact—and address accordingly.
Establish a robust system of monitoring and evaluation to facilitate informed decision making.
Evaluate the impact of the various small safety net programs.
Action 1.3: Strengthen public expenditure management.
Strengthen budget formulation and improve management, execution, and auditing.
Action 1.4: Include citizens in oversight of execution and delivery.
Increase the transparency of public spending to ensure the benefits of public spend-ing reach the poor.
Recommendation 2: Improve program targeting of the poor and vulnerable and move away from regressive spending. More resources need to be allocated to programs that target the poorest and most vulnerable. To this end, either (1) some funding should be shifted from programs benefiting the richest populations to programs targeting the poor, or (2) the overall program budget should be increased. Because Burkina Faso’s revenue sources are unlikely to create further substantial fiscal space, it is more realistic to reallocate expendi-tures from less efficient programs before considering a budget increase. The following actions should be prioritized.
Action 2.1: Disseminate the use of a proven targeting system.
Use an integrated approach for the assessment of socioeconomic needs and condi-tions when possible to effectively reach the poorest.
Ensure interventions are aligned with areas that suffer from high poverty rates and low coverage.
Action 2.2: Shift spending from universal subsidy programs toward programs tar-geting the poor.
Continue with already initiated energy subsidy reform initiatives—that is, reduce spending allocated to broad-based consumer subsidy programs.
Protect the poorest consumers by expanding well-targeted social safety nets. Design specific measures to mitigate the potentially adverse impact of reform on the
poor while gradually phasing out subsidies.
Communicate and engage with diverse stakeholders to avoid misperceptions and information asymmetry.
Recommendation 3: Improve the coordination of social programs by building a social registry. As the social safety nets system in Burkina Faso involves many sectors and comprises a large set of programs, further investments in a social registry containing socioeconomic information on the intended population would provide a common gateway for multiple programs. Further, it would improve coordination across sectors, agencies, and programs while reducing program duplication and overlap. The following actions should be prioritized.
Action 3.1: Adopt a harmonized questionnaire.
Identify opportunities for integration of intake and registration processes. Integration across different programs is an efficient way to reduce costs.
Develop a common harmonized intake and registration questionnaire that captures all variables used by the different programs. This could help to rapidly expand the national social registry.
Action 3.2: Build a social registry as a common gateway for multiple social pro-grams.
Further develop Burkina Faso’s nascent social registry, as it would improve the effec-tiveness of the overall social safety net system.
Use the social registry as a tool for coordination on the assessment of needs and conditions to determine potential beneficiary eligibility for multiple programs.
Recommendation 4: Use social protection expenditure to build human capital where it matters most, such as for early childhood development and literacy.
Early childhood development is not now addressed by Burkina Faso’s social protection system. At the same time, the country’s human capital needs in terms of nutrition, early stim-ulation, and learning are staggering. Literacy—both during the critical school ages as well as
actions should be prioritized.
Action 4.1: Link social assistance programs to human capital building along the life cycle.
Enable parental investment in children’s human capital through cash and in-kind transfers and accompanying measures such as training on appropriate health behav-ior and early education of children (“soft condition”).
Through conditional cash transfers, parents can be requested to demonstrate spe-cific behaviors in order to receive the transfer, such as school attendance. These so-called “hard conditions” are often more effective, although both soft and hard condition approaches are valuable.
Scale up flexible service infrastructure. For example, all public works/Labor-Intensive Youth Public Works Program (THIMO) activities should be supplemented with mobile child care as in the Youth Employment and Skills Development Project; this easy-to-scale structure is supported by the Ministry of National Education and Literacy and the Ministry of Youth, Training and Vocational Integration.
Action 4.2: Promote basic skills training for adults and youth.
The essential basic literacy program of Burkina Faso’s National Fund for Literacy and Non-formal Education (FONAENF) requires at least 400 hours of training. In leading up to such substantial investments, smaller steps could be taken:
Identify and make use of every occasion to train social protection beneficiaries in basic skills. For example, beneficiaries of public works/THIMO programs could enroll in some literacy training alongside public works.
Various modalities of delivering basic skills should be tested and subjected to rigor-ous impact evaluation.
Recommendation 5: Improve the capacity of social safety net programs to respond to shocks (before, during, and after) through adaptive social protection.
Given the degree to which Burkina Faso is subject to adverse natural events and the lack of or irregularity of rainfall with corresponding food insecurity issues, it is crucial for the country’s safety net system to include flexible elements that can be scaled up quickly. This requires improving the existing early warning system for food insecurity and other issues. The follow-ing actions should be given priority.
Action 5.1: Develop and test shock-responsive benefits.
Shock-responsive benefits need to be rolled out rapidly in shock-affected areas and meet the needs of vulnerable beneficiaries within a few weeks of crises.
Develop an efficient targeting system that can quickly identify the most vulnerable/ poorest households within the affected area (a standard proxy means test process would take too long).
Action 5.2: Strengthen the early warning system.
Strengthen the existing Burkinabe early warning system to identify likely food-insecure prov-inces.
Shorter-term harvest forecasts are needed so as to be able to predict triggers in suf-ficient time (10 months before the end of the next rainy season).
Hydro-meteorological data should be defined for a smaller geographic grid and be combined with population data to predict impact.
Seamless cooperation between regional and national authorities is critical in using and diffusing data for maximum benefit.
Concluding remarks
With a few focused, courageous policy decisions, several issues related to the Burkinabe social protection system can be converted into opportunities.
Fiscal space is currently lost through governance issues such as missing coordi-nation, resulting in an overlap of programs and insufficient budget execution. That space can be regained.
Fiscal space is similarly lost through spending on regressive programs such as sub-sidies and scholarships rather than efficiently targeting social expenditures to the poor. This fiscal space can also be regained.
By regaining the fiscal space as described in the above recommendations, the gov-ernment could cover the country’s poor with an effective, efficient safety net—and more.
This end is achievable simply by realigning and better targeting existing safety net expenditures. Reallocating regressive subsidies and scholarships would open fiscal space beyond that. Existing social expenditures can achieve greater impact by linking payments to the utilization of human capital building services such as education and health.
Besides offering long-term strategies to alleviate poverty and build human capital, social safety nets can channel a short-term response to shocks against food security. Burkina Faso possesses the requisite building blocks to provide shock-response safety nets. With some improvements, these can be used to help the country face acute climate-induced hardships on a regular basis, providing a transition from humanitarian assistance to national systems.
This chapter presents the background, purpose, and
conceptual framework for this study; clarifies the basic
definitions for social expenditure that are used in this
report; and briefly describes the report’s structure.
Background
Burkina Faso—the “land of honest men,” as the Republic of Upper Volta was renamed in 1984—is a landlocked country in West Africa, surrounded by Mali to the north, Niger to the east, Benin to the southeast, Togo and Ghana to the south, and Côte d’Ivoire to the south-west. With a land mass of about 274,200 square kilometers, Burkina Faso’s population was estimated at 19.2 million in 2017. It was colonized by France and gained its independence in 1960; French remains the official language for government and business. The country’s capital is Ouagadougou, which is the administrative, communications, cultural, and economic center of the nation. It is also Burkina Faso’s largest city, with a population of about 1.5 million as of 2006.
Burkina Faso has experienced sustained economic growth over the past decade, primarily due to its main export commodities of cotton and gold, but this growth has not translated into comparable per capita gains. After a long period of eco-nomic stagnation, the nation recorded an annual gross domestic product (GDP) growth rate exceeding 6 percent on average during the early 2000s and up to 2014. Growth rebounded in 2016–17 after a slowdown caused by a decline in global commodity prices and the political crisis of 2014–15. Burkina Faso remains dependent on a narrow base of natural resources for economic growth. Despite its relatively high growth rate, the economy has not created suffi-cient jobs for the rapidly growing workforce, 80 percent of which is employed in agriculture and earns an annual income of less than $350; non-agricultural informal jobs consist of pre-carious or low-earning occupations (World Bank 2017).
The GDP growth rate is offset by a high demographic growth rate. With 5.4 chil-dren per woman, Burkina Faso has one of the highest fertility rates in the world, according to the World Bank’s World Development Indicators database. As a result, Burkina Faso’s average annual per capita gross national income increased by only 2.6 percent between 2006 and 2013—this is lower than the global and African average rates for the same period. At this rate, it would take approximately 25 years for the country to double its average per capita income, which is clearly insufficient to achieve rapid reductions in poverty. By comparison, at current rates, it will only take 7 years for Ethiopia to double its per capita income and 12 years for Rwanda (World Bank 2017). Moreover, Burkina Faso’s rapid population growth puts pressure on delivery of basic services. Growing at an annual rate of 3.1 percent, the population is pro-jected to increase from an estimated 19.2 million in 2017 to 29.0 million in 2030.
The country’s prosperity has not benefited the majority of Burkinabes. Food insecurity remains high, and extreme poverty is rampant and largely a rural phenomenon. According to the World Bank’s Human Capital Index—which measures the amount of human capital a child can expect to attain by age 18, given the risks of poor health and poor edu-cation that prevail in its country—the nation is one of the least developed in the world, with a rank of 144 out of 157 countries (World Bank 2018b). Sixty-one percent of its youth are illiterate, as are 90 percent of its elderly. Overall, almost half the population lives in poverty; in some regions, poverty rates can exceed 70 percent, particularly in rural areas and the regions at the border with Mali. Approximately 90 percent of the poor live in rural areas. Even though
As a nation, Burkina Faso
has seen great progress
in recent years in terms
of structural reform,
sound economic policies,
steady investment, and
the establishment of a
stable macroeconomic
environment.
a large part of the population lacks access to basic services.1 For example, the under-five
mortality rate was 81.6 per 1,000 live births, compared to an average of 76.5 in Sub-Saharan Africa. The net school enrollment of children age 6–11 was 66 percent, compared to 79 per-cent in Sub-Saharan Africa. Acute malnutrition among children was 7.6 per79 per-cent, and the incidence of stunting was 27.3 percent in 2016. Access to basic infrastructure is also limited.
The nation is increasingly facing adverse natural conditions and is highly vul-nerable to exogenous shocks. Burkina Faso regularly suffers from natural hazards, and the frequency of shocks affects the stock of both human and physical assets. Two-thirds of households report that they suffer from shocks each year, mostly related to natural hazards (UNDP 2016). Besides natural hazards such as droughts, floods, locusts, wildfires, and wind, households face risks due to food insecurity and regional instability; the latter exacerbates the poor’s vulnerability to shortfalls in consumption and results in seasonal hikes in the incidence of poverty. Regional insecurities pose an additional threat to the country’s development.
The human development challenges facing Burkina Faso call for social safety nets that promote poverty reduction, reduce vulnerability, and accelerate human capital accumulation. International evidence points to multiple benefits from investing in effective and efficient social protection (box 1.1). Social protection policies and programs— especially noncontributory social safety nets, when correctly developed and appropriately funded—can directly address extreme poverty and help households manage shocks and invest in their children and their assets. International experience also suggests that such investments can be affordable, where they are well designed and targeted. There is thus a critical need to strengthen social safety nets and build a coordinated system to manage the country’s human development challenges.
The government of Burkina Faso has adopted a comprehensive National Social Protection Strategy. The strategy’s overall aim is to fight poverty and exclusion, protect against exogenous shocks, and increase the resilience of the most vulnerable by establishing a minimum social protection floor for all. The 10-year strategy, which was adopted at the end of 2012 and is implemented through three-year action plans, has six objectives:
Improve social safety nets for the poorest and most vulnerable Increase access to social services
Promote employment and access to minimum income opportunities Extend social insurance coverage, including to informal workers Improve governance
Reinforce capacities
Burkina Faso uses several instruments to achieve these objectives, including public works, food and nutrition programs, cash transfers, fee waivers for health and education (scholar-ships), social care services, and government price subsidies.
1 Burkina Faso ranked 185 out of 188 countries on the 2016 Human Development Index (UNDP 2016).
The likelihood of lifting poor
Burkinabes out of poverty is
limited, and a large portion
of the population is highly
vulnerable to falling into the
poverty trap.
BOX 1.1
Reasons to invest in social protection
1
Social protection is a powerful way to fight poverty and reduce inequality. evidence shows that social protection directly reduces chronic poverty and vulnerability by enabling poor households to meet their basic consump-tion needs; protect their assets; and achieve better health, nutriconsump-tion, and educaconsump-tion outcomes. Social protecconsump-tion programs also build households’ productive assets and expand their income-earning opportunities by improving their labor market skills and enabling them to engage in higher-risk, higher-return activities. Moreover, by supporting participation in productive activities and redistributing income to poor households, social protection can significantly contribute to reductions in inequality.
2
Social protection contributes to economic growth. opment by improving labor market functioning, stimulating local markets through cash transfers, and developing community Social protection contributes to local economic devel-infrastructure. By boosting aggregate demand and facilitating difficult economic reforms, social protection also contributes to broad economic growth.3
Social protection can reduce social tension and promote stability. Countries emerging from social tension and conflict situations have used social protection to foster peace and to rebuild social capital. during periods of crises and difficult economic reforms, social protection can help safeguard social stability.4
Safety nets are a critical part of a government’s capacity to respond to shocks. The triple crises of 2008 and recurrent natural disasters have demonstrated the pivotal role safety nets play in mitigating the impact of shocks on poor and vulnerable households. Across the world, countries with well-established safety nets were able to scale up these initiatives swiftly to provide assistance to a large number of vulnerable households. governments can and need to put in place coherent safety net programs and establish the prerequisites for scaling them up seamlessly, such as robust early warn-ing systems and contwarn-ingency plans, and ensure that these programs are coordinated with a well-functionwarn-ing emergency system.
5
Countries can benefit significantly by creating an integrated social protection system.
Adopting a systems approach to social protection will reduce inefficiencies and ensure more equitable delivery of benefits from safety nets, pensions, insurance, labor programs, and targeted service delivery. A systems approach draws attention to opportunities to harmonize and expand existing programs in a way that reduces fragmentation and duplication, while promoting linkages across programs to capitalize on synergies. Adopting basic administrative tools such as social registries can help pro-grams harness possible economies of scale.
6
Social protection is affordable—and the costs of not having it are high. It would cost a country only 1–2 percent of its gdP to scale up its social protection programs to ensure national coverage of the poor. Although this is only a portion of the financing required to operate a full-fledged social protection system, it highlights what low-income countries can achieve in the short term. Social protection is a precondition for sustainable growth and social inclusion, and the costs of not protecting poor families are very high—and are borne disproportionately by women and children, undermining the productivity of future generations. Social protection spending can be made more efficient by reallocating financing from inefficient subsidies and ad hoc emergency food aid to predictable safety nets.
of beneficiaries—and monitoring and evaluation instruments.
New institutions have emerged since 2012, with the objective of reinforcing intersectoral cooperation and strengthening partnerships. The social protection system itself, however, is fragmented, consisting of programs with limited coverage, effi-ciency, and coherence. Burkina Faso has more than 100 small social safety net programs, 80 of which account for less than 1 percent of total social safety net expenditures. Although social protection expenditures have increased in the last decade, these expenditures have not always been effective. The government is working to find ways to improve the effectiveness and efficiency of its social protection programs and expenditures. To this end, discussions are ongoing on potential expansion of the nascent unified social registry of beneficiaries and on establishing a dedicated cross-sectoral budget fund for social protection activities.
Purpose and structure
Government commitment to social protection has been demonstrated by an increase in social protection expenditure and a surge of new programs. In a con-text of decreasing public finance and budget constraints, however, resources allocated need to be cost-effective in reducing poverty and vulnerability. Social safety net programs should be designed so they cover the various vulnerable groups and the risks they face to ensure that no one is left out. Targeting and other mechanisms that minimize the leakage of expen-ditures to those not in need—and hence mitigate the impact of social protection policies on public finance—should be included in program design.
To date, no comprehensive and systematic review of all ongoing social safety net activities in Burkina Faso has been undertaken. While the National Council for Social Protection (CNPS) monitors and has reported on selected programs (e.g., CNPS 2015b, 2016b, 2017b), no comprehensive assessment has been launched. This report responds to the Burkinabe Ministry of Economy and Finance’s request to take stock of the country’s social safety net programs, evaluate their suitability and fitness, and identify options to streamline and reform them for better effectiveness—all of which is directly in line with the government’s commitment to improve overall social safety net provision in Burkina Faso. The purpose of this report is twofold:
Identify social safety net gaps by determining whether the availability of social safety nets is commensurate with the needs
Assess overall social safety net performance and help consolidate expenditure
The report is divided into five chapters:
Chapter 1 presents the background, context, purpose, and overall approach of the report.
sitory poverty. It highlights household vulnerability to shocks and risks, as well as the determinants/correlates of poverty and vulnerability in Burkina Faso. The objective of the chapter is to understand poverty—including risks and vulnerabilities—across the life cycle. It draws on the World Bank’s poverty and vulnerability analysis and sys-tematic country diagnostic (World Bank 2016a, 2017), complemented by calculations using data from the 2014 Continuous Multisectoral Survey. The chapter concludes with a summary of the needs for social protection over the life cycle.
Chapter 3 investigates Burkina Faso’s institutional framework and reviews the his-tory of its social protection strategy, based on national documents and legislation and the recent World Bank Africa-wide social safety net report (World Bank 2012). Administrative data were collected to evaluate how much the Burkinabe government, and its partners, invest in social protection. Expenditures are presented over time, by social protection category, with a focus on social safety nets. The chapter looks at the supply of social protection from different angles: institutional—how are social safety net activities organized?, financial—how much does the country spend?, and
functional—what are the main types of programs and how do they work?
Chapter 4 provides an assessment of the supply of social protection with a focus on social safety nets by (1) looking at the population covered by the different pro-grams, (2) assessing the targeting effectiveness and cost-effectiveness of the system, (3) analyzing and discussing its sustainability, and (4) determining current practices in monitoring and evaluation. The chapter highlights coverage gaps with respect to needs along the life cycle, and discusses targeting methods and the geo-graphical adequacy of social safety nets; it draws on administrative data as well as on a series of indicators computed using survey data.
Chapter 5 provides conclusions and recommendations, including suggestions both on how to strengthen the social safety net system and how to consolidate programs.
The appendixes contain supporting analysis and examples of good practices. Most notably, appendix A provides a detailed review of the main social safety net interventions in Burkina Faso, including their level of expenditure, beneficiaries, targeting, and institutional set-up. The aim is to provide an overview of how these programs operate and overlap. Various sources were used to compile this appendix, including national documents, donor reports, interviews, and online information.
Conceptual framework
The technical analysis undertaken for this report drew inspiration from the following concep-tual framework.
There is empirical evidence for poverty traps. Bandiera et al. (2017) note, in connec-tion with a randomized control trial of asset transfers in Bangladesh, that
escape poverty. For individuals close to the poverty threshold the asset transfer is sufficient for them to successfully take on a new and more remunerative occupational activity (livestock rearing) whereas for those further away they fail to do this and fall back into poverty where they remain reliant on itinerant wage labor. (Bandiera et al. 2017)
Transferring an asset—a chunk of capital—to poor people can lift them over the poverty trap. In fact, reducing the cost of capital in any way—whether through lower interest rates, lower rental costs, lower depreciation, or lower insurance costs—could reduce or even eliminate the poverty trap.
Subsidizing capital building, by way of regular cash transfers, can also lift peo-ple over the poverty trap. Human capital, as in health and skills, needs income to be built and maintained.
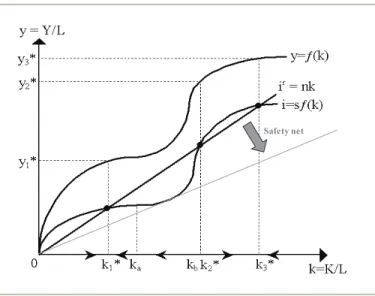
The following scenario and accompanying figures illustrate.
Illustrating the poverty trap: Mariam’s story
Mariam is a poor woman in the rural Central East region of Burkina Faso. She spends most of her day tending her small flock of goats and sheep. When she is not in the field, she prepares meals for her family and looks after her children. Pastoralism and agriculture, combined with climate-induced food insecurity, make for a risky business. Variation in income is costly to Mariam, who struggles to make ends meet for her children. There is no credit market to bridge harvest uncertainties with loans. Her family does not usually eat three meals a day. While they receive enough calories to survive nutritionally, their food intake is not sufficient for them to build up long-term strength. Mariam would normally not eat enough to be very productive, but with sufficient food, she would be. Figure 1.1 illustrates how income today (proportional to food today) translates into income tomorrow via personal productivity. Up and until a basic threshold of food today, productivity does not rise. After that threshold, it rises substantially.
The 45-degree line in figure 1.1 shows how the house-hold progresses over time. Any income/food level today between A and B would mean a lower income tomorrow than today. The household would always gradually fall back to A. This is called a poverty trap. Between A and B, the household always falls back. Once the house-hold exceeds income level B today, it will have a higher income tomorrow than today. Productivity pays off, income rises. Only above B will the household escape the poverty trap.
Income today depends on and builds capital: human, physical, financial, and other capital. With good skills and strength, a person can earn an adequate income
“…the word ‘trap’…
suggests that there is a way
out. Indeed, there is—but
like many traps, escape
from poverty often requires
some help from the outside.”
(Smith 2006)
FIGURE 1.1
Income dynamics and the poverty trap
Income today Income tomorrow Translation of, e.g., nutrition into productivity A B
machines or other work improvements and contribute to a higher harvest tomorrow. Investing capital today gen-erates income tomorrow.
Figure 1.2 illustrates these relationships by making fig-ure 1.1 a bit more complex. The horizontal axis shows the amount of capital k per head; that is, total capital K as a share of labor L. The vertical axis shows income per head y (total income Y per labor L). The uppermost curve illustrates how k today translates into y tomorrow, with y as a function f(k). This is not a linear or monoto-nous relationship, but somewhat S-shaped. A share s of y, sf(k) can be saved and reinvested as i. This is the second curve in the figure. As it is a straight share of f(k), the overall S-shape is the same.
The straight line illustrates the cost of capital, which is linear. It would comprise interest on loans, depreciation on physical assets, as well as any risks, expressed through the equivalent cost of insurance. In reality, Mariam does not have insurance but bears the risks directly herself.
When the saved/invested amount of income sf(k) exceeds the cost of capital, the overall capi-tal stock grows. This is the case for k below k1* and y below y1*: capital will grow until reaching k1*. It is also the case for k above k2* and y above y2, where capital will grow until it reaches
k3*. It is not the case for any capital stock between k1* and k2*, and an income between the
corresponding y1* and y2*. Households with a capital stock of this amount are in a poverty
trap. They will always gradually fall back to k1*.
Escaping the poverty trap
One way for Mariam to escape the poverty trap is to insure her income insecurity; that is, to insure her against poverty and give her and her family enough security to escape the poverty trap. If Mariam’s family’s per capita consumption falls below the poverty line, she could receive a regular cash transfer. If of a sufficient size, the regular cash transfer—which she would receive irrespective of weather, harvest, or other risks—can give Mariam’s family enough security to escape the poverty trap.
A safety net works like that. It is extreme poverty insurance. If a person falls below a certain poverty line, he or she is eligible to receive a regular cash transfer every few months. This is the concept of a social safety net, the net people should fall into when they fall into poverty. The Burkinabe program Burkin-Naong-Sa Ya, implemented by the Ministry of Women, National Solidarity and the Family, works in this way. It pays CFAF 30,000 every three months for two years, to poor women with children under the age of 15. In May 2018, Mariam
A safety net is extreme
poverty insurance: if you fall
below a certain poverty line,
you are eligible. This is the
concept of a social safety
net, the net you should
fall into when you fall into
poverty.
Safety net
SOURCE: Based on Solow-Swan growth model as shown in https://cruel.org/
nants to improve the livelihood of her household.
Cash for work programs have a similar objective. They provide poor families with a basic benefit to escape poverty and to ensure regular basic consumption of all household members. Generally, cash transfers to vulnerable beneficiaries that are financed out of the government budget and do not depend on a contribution by the beneficiary are called social safety nets, or social assistance.
Social assistance is often accompanied by programs to improve beneficiary pro-ductivity. Beneficiaries or potential beneficiaries are provided with skills training or helped to find a new or better job—or any employment at all. The idea behind these programs is to improve the welfare of beneficiaries by increasing their human capital and their access to information about opportunities. In figure 1.2, this would be illustrated by the two upper curves lifting up and tilting a bit toward the left. These programs can also improve prospects to escape the poverty trap.
There are also social programs that prevent families from falling into a poverty trap in the first place. These are social insurance programs. Health insurance protects households against catastrophic health expenditures that could push them into poverty. Pen-sions prevent the decline of productivity that all humans may face in old age by doing the same. Both of these programs normally depend on a prior contribution by the beneficiary.
There is an economic rationale for governments to engage in financing social programs, especially safety nets. The private credit market fails for households in poverty traps: there are no products available and payable for poor families to smooth the uncertainties of their income through loans or insurance. So market failure is one motivation. Another important motivation is to work toward the equality of all citizens, as is often man-dated by a country’s constitution. Government, representing its voters, who care about equity and equality with their fellow citizens, has a strong social motivation to engage in financing social assistance, social insurance, and productivity-improving measures.
Government has a strong
social motivation to finance
social assistance, social
insurance, and
productivity-improving measures.
needs: analysis
of risks and
vulnerabilities
This chapter identifies the major sources of
vulnerability for households in Burkina Faso; the most
vulnerable groups, which are the potential targets
of social protection programs; and the main risks
these groups face throughout the life cycle—which,
if not addressed, can perpetuate intergenerational
transmission of poverty.
Poverty and vulnerability trends
Over the last decade, Burkina Faso has enjoyed sustained economic growth.1
However, due to demographic pressures, this has not translated into similar per capita gains. Burkina Faso has recorded strong macroeconomic indicators over the last decades, with an annual gross domestic product (GDP) growth of 6 percent between 2005 and 2013 (World Bank 2017). However, rapid population growth—led by one of the highest fertility rates in the world at 5.4 children per woman—has placed the country under pressure. Economic growth does not directly benefit the population, as demographic trends further increase the burden on limited social services and on the narrow formal labor market. Even though GDP growth has been consistently above the regional average, the growth per capita between 2006 to 2013 has been much lower. In fact, Burkina Faso has one of the lowest gross national incomes in Sub-Saharan Africa (figure 2.1) and across the world.
The poverty headcount ratio has been declining over time, while the absolute number of poor people has increased. The most recent poverty data show that 40.1 percent of Burkinabes are
1 This chapter draws on findings from the World Bank’s poverty and vulnerability analysis and systematic country diagnostic (World Bank 2016a, 2017), complemented by author calculations using EMC 2014.
FIGURE 2.1
Gross national income per capita in Sub-Saharan Africa, 2015
0 1,000 2,000 3,000 4,000 5,000 6,000 7,000 Burundi
Central African Republic
Malawi Liberia Niger
Congo, Dem. Rep.
Madagascar
Togo
Ethiopia
Mozambique Sierra Leone Burkina Faso Rwanda Uganda Mali South Sudan Benin Zimbabwe Chad Tanzania LDCs Senegal Cameroon Kenya Côte d’Ivoire Ghana Zambia Sub-Saharan Africa Sudan Bhutan Congo, Rep. Nigeria
Cabo Verde Swaziland
Angola
Low & middle income
Namibia
South Africa Botswana Current dollars
SOURCE: World Bank, World Development Indicators database, http://datatopics.worldbank.org/world-development-indicators/.
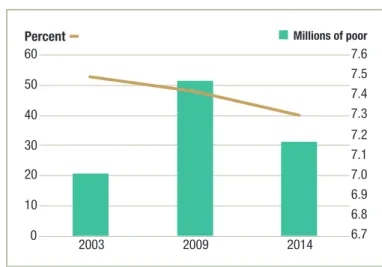
on less than CFAF 421 a day in 2014 (the national poverty line) actually increased, from 7 million in 2009 to 7.2 million in 2014 (figure 2.2). The decline of poverty has not been able to keep up with the rapid population growth—led by high fertility rates coupled with decreasing mortality and an increase in life expectancy.
Most of the population lives close to the poverty line, making the headcount ratio sensitive to a small increase in the poverty line (figure 2.3). There is a high concentration of individuals around the national poverty line, making them more vulnerable in case of adverse events. If the poverty line is increased to $3.10 a day (CFAF 663), as per the international standard, Burkina Faso’s poverty rate increases to accounting for almost 75 percent of the population. Additionally, if the actual
poverty line increased by only 10 percent (from CFAF 421 to CFAF 463), 1.4 additional million Burkinabes would be classified as poor—the latter being therefore considered at the margin
2 Poverty headcount ratio is computed using a consumption aggregate and national poverty line based on the Living Standards Measurement Study 2014. Burkina Faso’s national poverty line in 2014 was CFAF 153,530 per capita per year or CFAF 421 per capita per day. This poverty line is very close to the international poverty line, which is $1.90 per day in 2011 purchasing power parity (PPP) dollars. Indeed, using the 2011 PPP and inflation between 2011 and 2014, the international poverty line corresponds to CFAF 426.8 per capita per day in Burkina Faso; and the $3.10 per day per capita poverty line corresponds to CFAF 626.3 in Burkina Faso in 2014 (World Bank 2017).
6.7 6.8 6.9 7.0 7.1 7.2 7.3 7.4 7.5 7.6 0 10 20 30 40 50 60 2003 2009 2014 Millions of poor Percent
SOURCE: World Bank 2016a, figure 2.1.
FIGURE 2.3
Poverty headcount using different poverty line per capita/consumption distribution
SOURCES: Authors’ calculations based on EMC 2014 and World Bank 2017. NOTE: LCU = local currency unit.
national poverty line Internat’l poverty line $1.90/day national poverty line + 10% Internat’l poverty line $3.10/day Poverty headcount 40.1 43.7 47.9 74.6 Poverty gap 9.7 11.0 12.4 22.2 Poverty gap 3.3 3.9 4.6 1.9 Poverty line (annual lCu) 155,530 160,471 168,883 261,821 no. of poor 7,071,806 7,712,990 8,455,057 13,174,412 0 20 40 60 80 100 400 800 1,000 1,400 1,800 2,000 2,400 Poverty headcount (%)
Per capita daily consumption (in CFAF)
696.3 426.8