HAL Id: hal-01007969
https://hal.archives-ouvertes.fr/hal-01007969
Submitted on 21 Oct 2018
HAL is a multi-disciplinary open access
archive for the deposit and dissemination of
sci-entific research documents, whether they are
pub-lished or not. The documents may come from
teaching and research institutions in France or
abroad, or from public or private research centers.
L’archive ouverte pluridisciplinaire HAL, est
destinée au dépôt et à la diffusion de documents
scientifiques de niveau recherche, publiés ou non,
émanant des établissements d’enseignement et de
recherche français ou étrangers, des laboratoires
publics ou privés.
Centrifuge modelling of an internal erosion mechanism
van Duong Le, Didier Marot, Luc Thorel, Josselin Garnier, Philippe Audrain
To cite this version:
van Duong Le, Didier Marot, Luc Thorel, Josselin Garnier, Philippe Audrain. Centrifuge modelling
of an internal erosion mechanism. 5th International Conference on Scour and Erosion (ISCE-5), Nov
2010, San Francisco, United States. �hal-01007969�
Le, V. D.; Marot, Didier; Thorel, L.; Garnier, J.; Audrain, P.
Centrifuge Modelling of an Internal Erosion Mechanism
Fifth International Conference on Scour and Erosion. 07.-10. November 2010 in San
Francisco, Califonia, USA
Verfügbar unter/Available at: https://hdl.handle.net/20.500.11970/100283
Vorgeschlagene Zitierweise/Suggested citation:
Le, V. D.; Marot, Didier; Thorel, L.; Garnier, J.; Audrain, P. (2010): Centrifuge Modelling of an
Internal Erosion Mechanism. In: Burns, Susan E.; Bhatia, Shobha K.; Avila, Catherine M. C.;
Hunt, Beatrice E. (Hg.): Proceedings 5th International Conference on Scour and Erosion
(ICSE-5), November 7-10, 2010, San Francisco, USA. Reston, Va.: American Society of Civil
Engineers. S. 629-638.
Standardnutzungsbedingungen/Terms of Use:
Die Dokumente in HENRY stehen unter der Creative Commons Lizenz CC BY 4.0, sofern keine abweichenden Nutzungsbedingungen getroffen wurden. Damit ist sowohl die kommerzielle Nutzung als auch das Teilen, die Weiterbearbeitung und Speicherung erlaubt. Das Verwenden und das Bearbeiten stehen unter der Bedingung der Namensnennung. Im Einzelfall kann eine restriktivere Lizenz gelten; dann gelten abweichend von den obigen Nutzungsbedingungen die in der dort genannten Lizenz gewährten Nutzungsrechte.
Documents in HENRY are made available under the Creative Commons License CC BY 4.0, if no other license is applicable. Under CC BY 4.0 commercial use and sharing, remixing, transforming, and building upon the material of the work is permitted. In some cases a different, more restrictive license may apply; if applicable the terms of the restrictive license will be binding.
Centrifuge Modelling of an Internal Erosion Mechanism
I Universite Nantes Angers Le Mans, Laboratoire Central des Ponts et Chaussees,
Centre de Nantes, Departement Geotechnique Eau Risques, Route de Bouaye, BP 19,
44340 Bouguenais, France; email: van-duong.le@lcpc .fr. luc.thorel@lcpc .fr.
jacques.garnier@lcpc.fr, philippe.audrain@lcpc.fr
2 University of Nantes, Institut GeM, BP 420 44606 Saint-Nazaire Cedex, France;
email: didier.marot@univ-nantes.fr
ABSTRACT
Suffusion is an internal erosion mechanism, which means the transport of fine particles within the soil due to hydraulic interflows. With the objective to characterize this mechanism and to study a scale effect presented in literature, a specific centrifuge bench is designed.
Test specimens of mixture of sand and kaolinite are compacted in rigid walled cells. The specimen height is selected according to the applied gravity and the chosen effective stress. After saturation, specimens are subjected to centrifugal acceleration and to a vertical downward flow under a constant hydraulic head.
The effect of the applied hydraulic gradient is examined and the study underlines that the increase of specimen height induces the decrease of critical hydraulic gradient and the increase of erosion rate . A new energy analysis of tests is developed, linking the expended power to the erosion rate. This method permits to avoid the effect of specimen height.
INTRODUCTION
Under the action of water flow , grains constituting the soil of embankment of dams or dikes can be detached and transported. This process is named internal erosion and can induce the failure of hydraulic earth structures. The two main phenomena of internal erosion in uncracked soils are backward erosion and suffusion. This paper deals with suffusion which concerns only finer fraction of soil. The fine particles are detached and transported through a skeleton constituted by coarser grains.
With a hydraulic approach, several authors have developed expressions that relate initiation of internal erosion to the critical hydraulic gradient. Sellmeijer (1988) proposed an expression of hydraulic gradient that is inversely proportional to the length of seepage path. Moreover Li (2008) performed tests with a large and a small permeameter. For a same type of tested specimen and identical mean vertical
effective stress, Li (2008) observed that the critical hydraulic gradient can be seven times higher with the small permeameter than with the large one.
A program of centrifuge tests was performed on clayey sand to characterize suffusion process and to examine the scale effect on initiation and development of suffusion. The use of the centrifuge allows to vary the height of the soil sample keeping constant the hydraulic gradient and the distribution of effective stresses.
CENTRIFUGE TEST DEVICE
The device comprises a rigid wall cylinder cell, a hydraulic control system and an effluent sampling system. The device is placed in the basket platform of the LCPC centrifuge in order to reproduce stress states upon full scale (see Figure I).
Figure 1. General view of the centrifuge bench.
A downward seepage flow is applied to the specimen under a constant hydraulic gradient. The fluid circulates into the top of the specimen using a layer of glass beads to diffuse the fluid on the specimen contact interface uniformly. At the bottom of the specimen, the funnel-shaped draining system is specially designed to allow the transport of eroded parti cles.
The cell outlet is connected with an effluent sampling system by a drainage pipe and a needle valve. This type of gate is chosen to enable the opening even under a high gravity. The draining system is equipped with a controlled vent which avoids the generation of a depression in the specimen induced by the outlet valve opening. The opening of downstream valve is realized in flight when the selected centrifugal acceleration is reached.
To perform a sampling of the effluent during the test duration, a rotating system is developed (see Figure 2) and thanks to a camera it is controlled remotely from the centrifuge operator's room.
SCOUR AND EROSION 631
Figure 2. View of rotating effluent sampling system.
EXPERIMENTAL PROCEDURE
Tested materialsThe tested material is a mixture composed of 90% of Fontainebleau sand and 10% of clay. The washed Fontainebleau sand has grain unit weight of 26.5 kN/m3
and a grain size distribution within the range 0.1 mm to 0.4 mm. The clay is kaolinite
Speswhite (grain unit weight: 26.5 kN/m3
), without deflocculation its grain size
distribution is measured between 0.5 J.!m and 0. 125 mm. Figure 3 shows the grain size distribution of tested materials.
セ@ 70 ] 60 g 50 C セ@ 40 20 0.' om 0,001 0,000 1 Grain slza (mm)
Figure 3. Grain size distribution of tested materials.
Specimen reconstitution and test principle
The sand is first mixed with a water content of 8 %. While mixing continues,
plastic bag in order to improve the moisture homogeneity. Specimens are realized by compaction in 73 mm diameter cells. The reduced scale model height is within a
range from 60 mm to 120 mm. For 60 mm height, the compaction is made in six
layers of 25 blows with a mini Proctor rammer. The saturation phase begin s by an injection of carbon dioxide at the specimen bottom. Saturation is completed in upward direction by using demineralized and deaerated water.
The saturated specimens are then subjected to centrifuge acceleration with a g-level N between 10 and 60. During the centrifugation, a constant hydraulic head Hw (origin = bottom of specimen) is applied at the top of specimens by using demineralized and deaerated water. Hydraulic gradient is determined by:
where
. Hw N 1=
-Hm
R v:
water height applied on the specimen top, N: centrifugal acceleration factor,Hm: reduced scale model height.
(I)
With the objective to take into account the influence of the test duration, the average rate of erosion is expressed by:
m m crodcdclay
Sd (2)
where mcroded clay: cumulative dry mass of eroded clay, S: specimen cross section; d = test duration.
TESTS RESULTS AND DISCUSSION
Influence of hydraulic gradient
Twenty tests were performed. The average erosion rate versus the hydraulic gradient shows a great variation of erosion rate for an identical value of hydraulic gradient (see Figure 4).
SCOUR AND EROSION 633 0,35
•
"'
E 0,3 "'", Cl 0,25•
.§. Q) 0,2 "§"
0 'iii 0,15•
0 Q; Q) 0,1 Cl..
Q; > 0,05 <{•
I
•
°
20.
40•
60•
•
80.
100 120 140 160 Hydraulic gradient (m/m)Figure 4. Influence of hydraulic gradient on average rate of erosion.
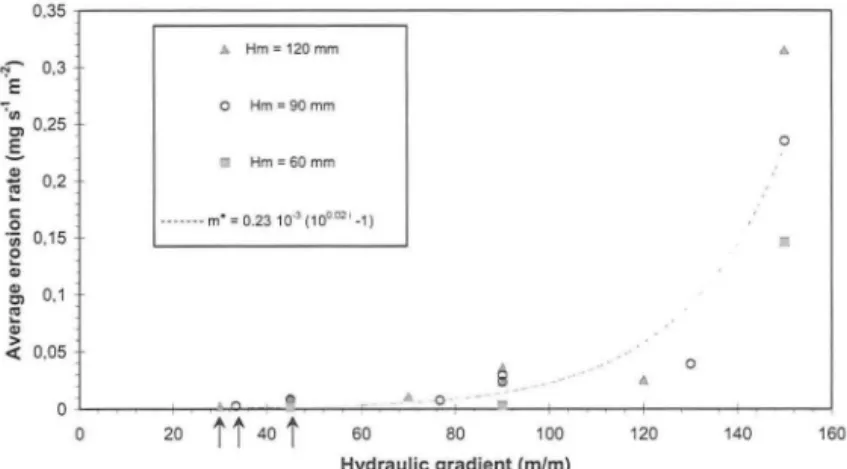
Scale effect
According to Li (2008)'s conclusions, the value of critical hydraulic gradient decreases with the specimen height. To verify this influence, the reduced scale model height is distinguished in Figure 5.
For reduced scale model height of90 mm, the average erosion rate (expressed in mg S·1 m,2) seems to be related to hydraulic gradient by a power law which is:
(3) This relation confirms the power law proposed by Bendahmane et al. (2008) for the maximum value of erosion rate in the case of clay suffusion:
(4)
where is the maximum value of erosion rate.
mmax
The factor 12 is higher than the factor in equation (3). This difference of magnitude may be due to three different reasons. Bendahmane et al. (2008) performed tests on different c1ayed sand. The type of sand and also the clay were different than materials tested in this study. Equation (4) was defined for the maximum value of erosion which was measured instantaneously by an optical sensor (Bendahmane et aI., 2008). Unfortunately this optical sensor can not stand high gravity . Thus the sensor could not be used for this test program and the sampling device leads to an average value of erosion rate for each step of the sampling. The
third reason is related to the greater filter pore opening size (4mm) for Bendahmane et al. (2008) tests. The filter opening size is an important parameter to quantify erosion rate and with a 0.08 mm filter opening, the critical gradient can be six to seven times smaller than with a 4 mm filter opening (Marot et aI., 2009).
0.35 ェ Mセ]]]]] ]][MMMMMMMMMMM M i@ LLセ@ 0.3 E NLセ@ 0.25
g
セ@ 0,2 co.*
0.15e
Q) セ@ 0.1 セ@ Q) セ@ 0.05 A. Hm=120mm o Hm =90 mm • Hm=60mm..
o•
o 60 80 100 120 140 160 Hydraulic gradient (m/m)Figure 5. Influence of hydraulic gradient and reduced scale model height on average erosion rate.
In Figure 5 it can be noted that the critical hydraulic gradient to initiate suffusion (indicated by arrows in Fig. 5) decreases with the reduced scale model height: icr= 45 mlm for Hm = 60 rum, icr= 33 mlm for Hm = 90 mm and icr= 30 mlm
for Hm = 120 rum.
These values of critical hydraulic gradient confirm Li (2008) conclusions : the magnitude of critical hydraulic gradient decreases with tested specimen height.
In order to study the scale effect on development of suffusion, Figure 6 plots the average erosion rate versus the reduced scale model height for identical value of hydraulic gradient and effective stress.
SCOUR AND EROSION 635
0,35 - r - - - ,
I
.... i = 150 mlm. effective stress = 42.5 kPa
N- 0,3
セe@ . • i = 90 m/m. effective stress = 28.3 kPa :;, 0,25 - I 0 i = 45 m/m , effective stress = 14 .2 kPa
.s
.l!l 0,2 セ@ I: 0 'iii 0,15e
'"
'"
0,1 Cl セ@'"
>«
0,05_______ L---·
°
40 50 60 70 80 90 100 110 120Reduced scale model height (mm)
130
Figure 6. Influence of reduced scale model height on average rate of erosion.
Rate of erosion appears as a function of reduced scale model height so the scale effect seems to influence both initiation and development of suffusion.
Energy analysis
The new analysis proposed here is based on a fluid energy dissipation model and this energy is assumed to be transformed into erosion.
The energy equation is applied between the upstream section A and the downstream section B of the specimen (White, 1999). A volume V of fluid, with a mass M and a density p, is assumed with a surface S in contact with environment. The external surface of the vo lume is oriented by its normal vector
n
from fluid to environment. The energy equation for the fluid through the specimen can be written by the following equation (Regazzoni, 2009):and
dE = dETher + dW
dt dt dt
(5)
(6)
with : ETher : energy exchange between the system and the environment;
W: mechanical work between the sections A and B; ein': internal energy of the fluid; U: velocity of the fluid, components (u, v, w); g: gravity; z: coordinates
Three assumptions can be used to simplify the equation. The temperature (isothermal in time), so the internal energy (eint) are assumed constant on the volume. The system can be considered as adiabatic, only mechanical work (W) takes place between sections A and B, that can be expressed by:
dETher = 0
dt (7)
The assumption of a steady state (locally in time) allows neglecting the unsteady term of the kinetic energy. Finally equation (5) becomes:
dW
=#(u
2
KァコjーHuセI、s@
dt s 2 (8)
The total energy dissipation is the sum of energy dissipation by pressure, by shear stress at the interface fluid-solid and by viscosity and turbulence in the fluid phase. The shear stress is assumed to cause erosion, so the dissipation of total energy in the system can be written as:
dW d W press ion + d W intra fluid + d Werosion
dt dt dt dt
The temporal derivative of work done by pressure is defined by:
dWpression
dt - #P(U n)ds
Equations (8) to (10) lead to:
d W intra fluid + d Werosion
dt dt
i
u 2pJ (--)
- + gz
+ - pUn dS S 2 p (9) (10) (11 ) The flow conservation with a same specimen section on the whole length leads to assume the same average velocity in the sections A and B. Equation (II) becomes:d Wi:afluid
+
dwセセッ ウゥッ ョ@ セ@
g
z
Kセ I@
p(u
セI、s@
= Qセp@
+
P gセコ@
Q (12)It is assumed that the dissipation of energy is mainly transformed into erosion and the dissipation intra fluid is neglected. In consequence, the temporal derivative of mechanical work through erosion can be expressed by:
d Werosion
dt qセpK@ pg セコq@ (13)
For convenience, the temporal derivative mechanical work by erosion is named erosion power. The energy dissipation is the temporal integration of the instantaneous erosion power for the test duration.
With the objective to verify the energy analysis ability to avoid scale effect as previously described, Figure 7 presents the average rate of erosion versus the erosion power.
SCOUR AND EROSION 0,35 イ[]]]]]]]]]]]]]]]]]セMMMMMMMMMMi@ N - 0,3 -'E B[Bセ@ 0,25
-.s
セ@ 0,2"
o -Vi 0 ,15 o Q; セ@ 0.1 セ@..
> « 0,05 • experimenta l data _ m [mg s·, mo'l = 0. 0489 Plw[ (R2 = 0.96 )•
••
•
4 Erosion power (W)•
Figure 7. Average erosion rate versus erosion power.
637
The linear increase of the average erosion rate (expressed in mg s-' m-2)
according to the erosion power P (expressed in W) can be estimated by:
• = 0.0489 P
m (correlation coefficient R2 = 0_96) (14)
For each test, the eroded clay mass and total energy dissipation can be determined by integration over the test duration. Figure 8 shows that the eroded clay mass (in mg) can be related to the total energy dissipation (E, in J) by a linear law as:
meroded clay = 0.0017 (E -60) (R2 = 0_95) (15)
'"
. , - -- - - -- -- - - , 1,2E1
'" '"E
0,8 ;; U -g 0,6 · '0e
w 0,4 0.2 • experimenta l data _ m ero<lod<loy [mgl = 0.0017 (E [J] -60) Hr セ@= 0.95)•
•
..
•
.. -
.
100 200 300•
400 Total energy dissipation (J)500 600 700
So the analysis based on energy dissipation offers the potential for a consistent interpretation of suffusion tests, without significant influence of specimen height.
CONCLUSION
A centrifuge bench is developed in order to characterize the sensitivity of a clayey sand to suffusion process and to study scale effect. The realized study examines the influence of hydraulic gradient on initiation and development of suffusion. Using the hydraulic gradient concept, the characterization of suffusion depends on the tested specimen height. The difference in the results is in the magnitude of critical hydraulic gradient and of erosion rate .
An energy analysis of interstitial fluid is made. By integrating over the time, the eroded clay mass is linearly correlated to the energy dissipation. Using the energy analysis, the suffusion characterization does not depend on specimen height.
ACKNOWLEDGEMENT
The authors wish to acknowledge the support of the Region Pays de la Loire (project R2GC) for this research.
REFERENCES
Bendahmane F., Marot D., Alexis A. (2008). "Parametric study of suffusion and
backward erosion." J. of Geotechnical and Geoenvironmental Engineering
(ASCE), 134 (1): 57-67.
Li M. (2008). Seepage induced instability in widely graded soils, PhD thesis,
University of British Columbia, Vancouver, 300 p .
Marot D., Bendahmane F ., Rosquoet F. Alexis A. (2009). "Internal flow effects on isotropic confined sand-clay mixtures." Soil & Sediment Contamination, an Int. J. 18 (3) : 557-567.
Regazzoni P.-L (2009). Confrontation et analyse d'erodimetres et caracterisation de la sensibilite
a
I'erosion d' interface. PhD thesis, Universite de Nantes, 155 p.Sellmeijer J.B. (\988). On the mechanism of piping under impervious structures,
PhD thesis, Delft University of Technology, 56 p.