TITLE: Improving the measurement of neighbourhood characteristics through systematic
observation: Inequalities in smoking as a case study
AUTHORS : Martine Shareck, M.Sc.a,b,c, Clément Dassa, Ph.D.a,c, Katherine L. Frohlich, Ph.D.a,c
Accepted for publication in Health and Place
a Département de médecine sociale et préventive, Université de Montréal, 1420 Boul.
Mont-Royal, C.P. 6128, Succ. Centre-Ville, Montréal, Canada.
b Centre de recherche du centre hospitalier de l’Université de Montréal, Hôtel-Dieu, Pavillon
Masson, 3850 St-Urbain, H2W 1T7, Montréal, Canada.
c Institut de recherche en santé publique de l’Université de Montréal, 1420, boul. Mont-Royal, C.P.
6128, Succ. Centre-Ville, Montréal, Canada.
AUTHOR INFORMATION:
Martine Shareck, M.Sc. a,b,c: Corresponding author Address : Université de Montréal 1420 Boul. Mont-Royal C.P 6128 (Centre-Ville) Montréal (Québec) Canada Phone : 1-514-927-9510 Fax : 1-514-343-5645 Email: martine.shareck@umontreal.ca
HIGHLIGHTS
- We develop a theory-based observation tool to study inequalities in smoking - We use generalizability analyses to estimate the observation tool’s reliability - 75% of indicators are reliable, but reliability varies across neighbourhood domains - Results inform measurement precision and potential validity of theoretical anchors
Abstract
Systematic observation is increasingly used as a method to measure neighbourhood characteristics thought to influence health inequalities. This article reports on the theory-driven development of a new observation tool composed of reflective indicators of neighbourhood characteristics believed to influence inequalities in smoking. We also report the results of generalizability analyses conducted to estimate the reliability (inter-rater reliability and temporal stability) of the observation tool. We use the reliability results to reflect on the quality of the measures and on the theoretical anchors of the tool. We conclude by making recommendations to improve measures collected through systematic observation.
Keywords
1. Introduction
Neighbourhood and health inequalities research has been gaining increasing momentum over the last decade (MacIntyre and Ellaway, 2000, Kawachi and Berkman, 2003, Riva et al., 2007, Yen et al., 2009). Moving beyond an individual-based approach to health to one focused on settings where people live, work and play, researchers are attempting to identify neighbourhood characteristics as intervention targets for reducing health inequalities. Exposure to neighbourhood physical and social environments has been linked to health behaviours such as smoking (Frohlich et al., 2002, Chow et al., 2009, Ellaway and Macintyre, 2009), diet (Chow et al., 2009) and physical activity (Chow et al., 2009), and health outcomes including self-rated health (Pickett and Pearl, 2001, Riva et al., 2007), cardio-vascular diseases (Riva et al., 2007, Chaix, 2009, Chow et al., 2009), obesity (French et al., 2001) and mental health (Egan et al., 2008, Cohen et al., 2003, Kim, 2008).
1.1 Measuring neighbourhood characteristics
Various data sources can be used to measure neighbourhood characteristics including population surveys, administrative databases, and systematic observation. Population surveys assess residents’ perceptions of their neighbourhood (Baum et al., 2009, Ellaway and Macintyre, 2009, Schaefer-McDaniel et al., 2009) and can yield relevant measures of their subjective experience (Caughy et al., 2001, Schaefer-McDaniel et al., 2009). Perceived measures of neighbourhood characteristics do not, however, always correlate significantly with objective ones (Kirtland et al., 2003, Frohlich et al., 2007a, Macintyre et al., 2008). Perceptions can also be plagued by same source bias if exposure and outcome data are obtained from the same study participants (MacIntyre and Ellaway, 2003).
systematic observation (Schaefer-McDaniel et al., 2009). Combined with geographical information systems, these respectively provide secondary and primary data on neighbourhood characteristics. Of these data sources the most commonly used are administrative databases such as national census surveys which characterize neighbourhoods in terms of the aggregate socio-demographic characteristics of their residents. Other secondary data sources provide information on land use, crime or the presence of services and commercial establishments (Cummins et al., 2005, Stafford et al., 2007, Kestens et al., 2010). Administrative data are increasingly accessible and help draw a comprehensive picture of neighbourhoods in terms of their socio-economic, demographic and physical characteristics (Cummins et al., 2005).
Administrative data do, however, present some limitations. First, they are seldom collected to answer specific research questions concerning neighbourhoods’ effects on health. Consequently, they may provide data that are inadequate for addressing the theoretical links between neighbourhood exposures and health inequalities (Frohlich et al., 2007b). Second, census data are usually collected once every few years (Laraia et al., 2006, Statistics Canada, 2011), while service-related data may not always be up to date (Cummins and Macintyre, 2009). Administrative data may thus misrepresent participants’ contextual exposure at the time of study. Finally, administrative databases do not provide information on some features of interest in health inequalities research such as the quality of neighbourhood features and resources, for example the cleanliness of streets or condition of housing (Brownson et al., 2009).
Systematic observation data can help address some of the limitations of resident perceptions and administrative data, and complement measures derived from these sources. Systematic observation involves trained raters going to neighbourhoods (Brownson et al., 2009) or conducting virtual
audits with online images (Clarke et al., 2010, Rundle et al., 2011) to rate neighbourhoods on observable features. It helps describe neighbourhoods in terms of the presence, quantity and quality-related characteristics of resources (Brownson et al., 2009). Unlike readily available administrative databases, systematic observation tools can be developed prior to initiating a study. They can thus be anchored in pre-specified theories and adapted to one’s research questions. This allows for the collection of information on neighbourhood features that are theoretically linked to the health issue(s) of interest within a timeframe and a geographical space that is compatible with the research question (Schaefer-McDaniel et al., 2010). Systematic observation can also provide primary data not included in administrative databases or help nuance the data found in these. For example, land use data might indicate the presence of a vacant lot in a neighbourhood, while direct observation might suggest the lot is actually used as an informal gathering space by residents.
Systematic observation shows great potential for providing primary data on neighbourhood characteristics. However, more discussion about the development and reliability properties of observation tools is warranted in order to address three important issues: 1) the scarcity of observation tools rooted in theories of neighbourhoods and health inequalities; 2) the need for tools that are context-specific and tailored to studying inequalities in health behaviours, in this case smoking; and 3) the lack of observation tools which are evaluated for their reliability prior to being used in large scale studies (Schaefer-McDaniel et al., 2009, Schaefer-McDaniel et al., 2010). As a means to respond to these issues we developed a theoretically-anchored observation tool to be used in the Interdisciplinary Study on Inequalities in Smoking (ISIS), which aims to understand how neighbourhoods influence social inequalities in smoking in Montreal, Canada. We then conducted a generalizability study to evaluate the reliability of the ISIS observation tool and used the results to discuss the observation method and the potential validity of the tool’s theoretical underpinnings.
We report the process and results below, after describing the main limitations which existing observation tools present.
1.2 Limitations of existing observation tools
Few tools are explicitly theoretically based, and even fewer tools are anchored in theories concerning what neighbourhoods consist of and how neighbourhood characteristics are linked to health and health inequalities (Schaefer-McDaniel et al., 2010). A recent literature review showed that the majority of observation tools used in health research were in fact rooted in theories from the sociology of crime field, mainly the “broken window theory” (Schaefer-McDaniel et al., 2009) which initially linked neighbourhood disorder to crime (Sampson and Raudenbush, 1999). This is problematic since theoretical explanations as to how elements of this theory, such as signs of vandalism, are linked to health inequalities are often left unarticulated (Parsons et al., 2010). Relying on inappropriate theories for health inequalities research may thus deflect attention from relevant health-influencing exposures.
Basing the development of observation tools on a-theoretical processes, or on theories that are inappropriate for neighbourhood and health research, is also problematic since it overlooks the importance of theory in every phase of the research process. Indeed, theory helps frame the alleged causal links between neighbourhoods and health, guide the choice of concepts and indicators to measure, and help with their operationalization (Frohlich et al., 2007b). Theory also helps frame what we believe we can “see” and aim to measure (Krieger, 2001), improve measurement validity, and it gives insights into where and how to intervene in the neighbourhood-health relationship (Krieger, 2001, Frohlich et al., 2004, Frohlich et al., 2007b). For example, theorizing that neighbourhood physical disorder, which has been linked to inequalities in smoking (Miles, 2006,
Ellaway and Macintyre, 2009), results from economic disinvestment in structural features would lead to different recommendations for action than if one theorized that physical disorder was due to low collective efficacy among residents.
Second, when developing an observation tool its specificity to the context of study and health issue of interest is primordial (Zenk et al., 2007, Paquet et al., 2010). Many observation tools inspired by the broken window theory were developed for use in socially segregated American cities and may be inappropriate for measuring neighbourhood attributes of less segregated cities (Parsons et al., 2010). For example, in the case of Montreal, Canada, a study has shown that some indicators composing the broken window index, such as broken windows or drug paraphernalia (Sampson and Raudenbush, 1999), were not widely encountered (Paquet et al., 2010). These indicators may thus fall short of explaining neighbourhood differences in health.
As well, many observation tools have been developed to measure a wide range of neighbourhood attributes thereby characterizing them generally in terms of potentially health-influencing features (Weich et al., 2001, Schaefer-McDaniel et al., 2009, Paquet et al., 2010). Although it might seem efficient to collect an extensive amount of data at once, further use of observation data may be limited if information is missing on specific features theoretically linked to particular health issues. While some tools are designed to measure a more limited number of neighbourhood features thought to influence physical activity (Pikora et al., 2002, Brownson et al., 2009), active living (Gauvin et al., 2005) or healthy eating (Farley et al., 2009, Ohri-Vachaspati and Leviton, 2010), no observation tool has been specifically developed to study inequalities in smoking. This is critical since neighbourhood features associated with walking, for example street connectivity, may not influence smoking.
Finally, the validity and reliability properties of observational measures, which respectively indicate whether measures actually reflect the intended underlying latent variable and whether they are precise (Cook and Beckman, 2006), are seldom reported (Schaefer-McDaniel et al., 2009). In cases where temporal stability or inter-rater reliability estimates have been reported, high variability across studies has been observed (Schaefer-McDaniel et al., 2009). More importantly, few tools are validated prior to being applied to large etiologic studies (Weich et al., 2001, Pikora et al., 2002, Gauvin et al., 2005, Zenk et al., 2007, Millington et al., 2009, Fuller and Muhajarine, 2010, McDonell and Waters, 2010, Paquet et al., 2010) although validation studies should be performed as formative steps to substantiate theoretical underpinnings of measurement and improve the measures themselves before being formally used in etiologic studies. As well, reliability is a necessary but insufficient component of validity: valid associations and interpretations cannot be derived from unreliable measures (Cook and Beckman, 2006). Reliability studies can therefore be used to refine theoretical frameworks on neighbourhoods and health, develop more reliable measures of neighbourhood characteristics and potentially improve the validity of their association with health inequalities (Schaefer-McDaniel et al., 2010).
2. Developing the ISIS observation tool: a deductive process
The development and reliability study of the ISIS observation tool was one of many phases of a larger project leading to the Interdisciplinary Study of Inequalities in Smoking. Previous steps included the elaboration of a theoretical framework on neighbourhoods and health inequalities (Bernard et al., 2007) and the testing of this framework using material from a scoping review of the literature and focus groups. This last step confirmed that our theoretical framework was useful in classifying neighbourhood characteristics influencing smoking.
2.1 Theoretical foundations
To develop the ISIS observation tool we followed a deductive process, starting from a substantive theoretical conception of the nature of neighbourhoods and their contribution to inequalities in health. According to this framework, neighbourhoods make available resources with a positive or negative valence for producing, in this case, social inequalities in smoking. Availability of, and access to, these resources are regulated by four rules: proximity, price, rights and informal reciprocity. These rules further give rise to five inter-related domains through which residents may acquire resources influencing smoking: the physical, economic, institutional, local sociability and community organization domains (Bernard et al., 2007). The variable configurations of these domains in neighbourhoods lead to the local production of inequalities in smoking.
The physical domain includes features of the natural and built environments such as the presence of buildings and open spaces as well as their condition and cleanliness. Access and exposure to these resources is ruled by proximity. The economic domain, ruled by price mechanisms, includes resources that can be obtained given that people pay for them, such as cigarettes sold in tobacco-selling outlets. Resources made available through the institutional domain are accessed through rights mechanisms and include publicly funded smoking cessation services. The local sociability domain involves resources which can be mobilized through informal networks formed by the social links that people share and includes smoking-related norms. Finally, the community organization domain includes resources provided through formally organized collective entities such as charity groups. Access to resources from these last two domains is controlled by rules of informal reciprocity which involve non-contractual exchanges of resources outside of markets and State interventions. Such resources are given freely by groups or individuals to other individuals such as when community organizations organize support groups for residents wanting to quit smoking
(Bernard et al., 2007).
This conceptualization of neighbourhoods is different from many pre-existing conceptual frameworks given that most researchers have tended to focus, often exclusively, on the physical environment (Weich et al., 2001, Pikora et al., 2002) or on physical and social environments (Narayan and Pebley, 2004, Zenk et al., 2007, Furr-Holden et al., 2008, Paquet et al., 2010) at the expense of other neighbourhood dimensions. Furthermore our framework, differently from others, begins to explore mechanisms leading to inequalities in smoking through the rules of access.
2.2 Developing reflective indicators
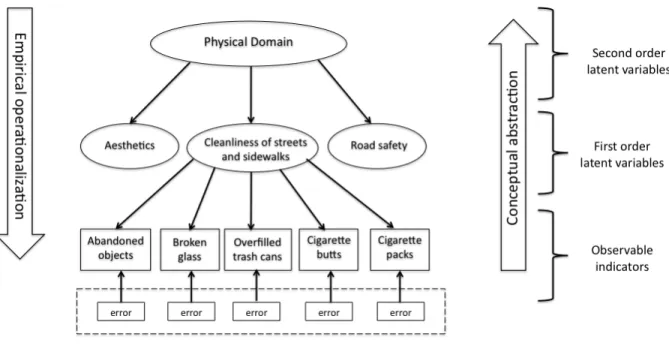
Our theoretical framework served as a guide for the development of reflective indicators operationalizing the domains. Figure 1 illustrates this by using the latent variable “cleanliness of streets and sidewalks” from the physical domain. Central to developing reflective indicators is the idea that meaning flows from latent variables to indicators, as opposed to being derived from the measures, as seen with formative (or causal) indicators (MacCallum and Browne, 1993, MacKenzie et al., 2005). Latent variables are theory-based and unobservable, and can be structured according to a hierarchy similar to that of higher order factor analysis (Bollen, 1989). The development of reflective indicators allows for multiple orders of latent variables or levels of abstraction. In our case, domains represented the highest level of abstraction (second order latent variables) and were operationalized with a series of lower first order latent variables. Each of these was measured with multiple indicators or “observable translations of a latent variable used in a specific measurement context” (Frohlich et al., 2007b p.303). Indicators were themselves measured with some degree of error (MacCallum and Browne, 1993, MacKenzie et al., 2005). Various measurement conditions can influence error terms and this influence can be quantified using
generalizability analyses (among other methods), and subsequently controlled. Figure 1 further depicts the development of reflective indicators as involving two streams: 1) the empirical operationalization of latent variables using indicators, and 2) the conceptual abstraction of indicators as their underlying latent variable.
Figure 1. Development of reflective indicators using the example of “cleanliness of streets and sidewalks”, a first order latent variable pertaining to the physical domain.
The choice of first order latent variables was anchored in each domain’s theoretical definition and based on several data sources. We identified existing variables, or created new ones, using findings from a scoping review of the literature on neighbourhoods and smoking as well as material from focus groups conducted with residents of differentially deprived neighbourhoods in Montreal. We also relied upon discussions among our research team composed of sociology, public health and geography experts.
We then developed indicators to operationalize the first order latent variables again using the scoping review, focus group material and expert opinion. We identified and adapted indicators from existing observation tools, mainly the MoNAT (Paquet et al., 2010) and the L.A FANS tool (Narayan and Pebley, 2004), and also created indicators specific to smoking and the Montreal context. For example, we measured “cleanliness of streets and sidewalks” with 10 indicators including smoking-specific ones such as “cigarette butts” and “cigarette packs” (fig. 1).
The final version of the ISIS observation tool included 97 indicators pertaining to four of the five domains. A complete list of first order latent variables and indicators is available in Appendix A. No indicators were developed to operationalize the community organization domain. In fact, the latent variables reflecting this domain’s theoretical definition, such as availability of smoking-cessation support resources, had limited operationalizability using directly observable indicators. Alternative data sources should thus be sought to measure characteristics pertaining to this domain. Standardized operational definitions of indicators and rating categories were established based on previous studies (Narayan and Pebley, 2004, Paquet et al., 2010), results of pilot neighbourhood observations, focus group material, and expert opinion.
3. Estimating the observation tool’s reliability: a generalizability study
To estimate the reliability of the ISIS observation tool we relied upon generalizability theory. A major advantage of generalizability theory over classical test theory is its consideration, in a single analysis, of multiple sources of measurement error specified by the researcher (Crocker and Algina, 2006a). Generalizability analyses allow researchers to quantify the relative contribution of specific sources of error on total measurement error. This is important since identifying which sources of
error most influence a tool’s reliability can pinpoint where adjustments should be made to improve measurement (Brennan, 2001). Here two measurement conditions, or “facets”, as they are called in generalizability theory, were considered as potential sources of error: raters and rating occasions.
3.1 Data Collection
Three raters (one undergraduate and two doctoral students) completed a five-day training consisting in an in-depth review of the theoretical framework, observation method and tool, and operational definition for each indicator. This was followed by two site visits. Data was then collected in four Montreal neighbourhoods operationalized as census tracts, administrative units often used as surrogates for neighbourhoods in health research (Cummins et al., 2005, Riva et al., 2007). In Canada, census tracts cover small geographical areas of 2,500 to 8,000 inhabitants and are relatively homogenous in terms of their residents’ socio-economic characteristics (Statistics Canada, 2009). Four census tracts were randomly chosen from those previously sampled for a study on eating behaviour and obesity. They had been sampled specifically for their variability in social and environmental characteristics (Daniel and Kestens, 2004) and were contrasted in terms of socio-economic status (based on residents’ income and educational level) and language spoken at home by the majority of residents (French or English/other). In each neighbourhood, 15 street sections (a portion of a street between two intersections) were randomly chosen from those more than 60 meters in length, for a total of 60 street sections. All raters walked along both sides of each street section at the same time but filled in the audit independently from one another. The process of observing and filling out the observation grid for each street section took on average 15 minutes to complete. Each street section was rated twice, at a two to three week interval. Observations took place between 8:30 AM and 1:00 PM on days not scheduled for garbage or recycling pick ups, that were not public holidays and when no rain was forecast. These criteria were selected to ensure
similar rating conditions in each neighbourhood and to limit variability in measurements due to these conditions. Data collection was completed in May and June 2009.
3.2 Data Analysis
Since the data had been collected using a crossed design where all units of analysis (street sections (S)) were rated by all raters (R) on both occasions (O), we were able to conduct analyses (G studies) to disentangle and quantify the relative influence of these two measurement conditions or facets, as well as their interaction, on reliability. Two sets of generalizability analyses were performed for each indicator: analyses based on a one-facet G study design for the first rating occasion (3R/1O), where only raters were considered as a potential source of measurement error, and analyses based on a two-facet G study design (3R/2O) where both raters and rating occasions were considered as potentially contributing to measurement error. We also performed decision studies (D studies) based on each G study design to estimate reliability coefficients for different combinations of raters and occasions. Results from D studies can help in optimizing a design and choosing that which maximizes reliability while minimizing time-cost.
In all analyses measurement conditions were treated as random sources of error allowing for the generalizability of results to larger pools of raters and occasions than those involved in the study. When facets are treated as random the uncertainties about generalizability conditions increase and generalizability coefficients decrease: they are thus conservative estimates of reliability (Brennan, 2001). Furthermore, generalizability analyses allow the estimation of absolute and relative reliability coefficients. Absolute coefficients “evaluate the ability of a procedure to locate individuals or objects reliably on a scale in absolute terms”, while relative coefficients focus on comparisons between units of analysis (Cardinet et al., 2010). Absolute coefficients will usually be
lower in value than relative ones. In this paper we report only the more conservative absolute coefficients. Generalizability coefficients can be interpreted as standard reliability coefficients with values of 0.70 or higher considered as indicating acceptable to excellent reliability (Nunnally, 1978). Data preparation and description were performed with SPSS v.16.0 (SPSS Inc), while generalizability analyses were conducted with EduG v.3.04 (Groupe de travail de la Société Suisse pour la Recherche en Éducation and Educan Inc., 2006).
3.3 Results
Thirty-five and 37 of the 97 indicators showed very low or null variability in ratings for the one- and two-facet G studies respectively, an indication of high inter-rater reliability. This did, however, hamper our ability to estimate these indicators’ reliability (Crocker and Algina, 2006b). Of these indicators, 10 were observed on none of the street sections, 20 were observed with very low prevalence on one or both occasions and one characterized all street sections equally. Seven indicators measuring the availability of tobacco products in retail stores were rated in a non-independent fashion. This occurred to minimize the burden placed on tobacco retailers, as having multiple raters enter the same tobacco selling outlet to collect effectively the same information was deemed unnecessary (Appendix A). Generalizability coefficients were estimated for the remaining 62 and 60 indicators for the one and two-facet designs respectively. A full synthesis of G study results is available in Appendix A. Selected results are presented below for discussion purposes.
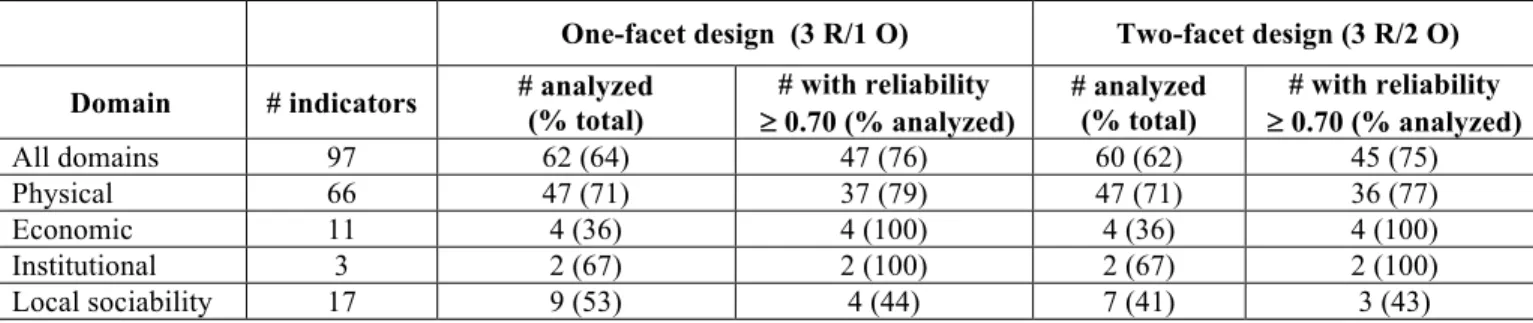
Overall, generalizability coefficients did not differ greatly when considering raters only (one-facet design, 3R/1O) or both raters and occasions (two-facet design, 3R/2O) as sources of measurement error. Most generalizability coefficients remained above or close to the 0.70 benchmark for acceptable reliability in both sets of analyses. As shown in Table 1, 76% and 75% of the analyzed
indicators showed acceptable to excellent reliability in the one- and two-facet G studies respectively. When stratifying by domain, however, 100% of indicators pertaining to the economic and institutional domains had coefficients equal to or above 0.70, while ratings for 78-79% and 43-44% of indicators from the physical and the local sociability domains respectively reached this level of reliability (Table 1).
Table 1: Descriptive statistics: Percentage indicators analyzed and with acceptable reliability, for the one- and two-facet G study designs
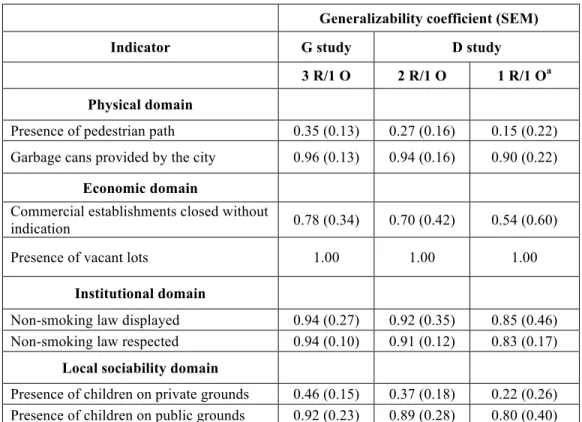
Table 2 presents absolute generalizability coefficients for G and D studies for the one-facet design (3R/1O). For each domain, results for the indicators measured with the lowest and highest reliability in the G study are presented as an indication of the range in reliability estimates. In the one-facet design, only raters were considered as a potential source of measurement error. Coefficients are thus indicative of inter-rater reliability. In the G study, the lower boundaries for the range in generalizability coefficients for indicators from the economic and institutional domains were greater than 0.70, confirming that indicators from these domains were measured with at least acceptable reliability. A different picture emerged for the physical and local sociability domains: the range in reliability coefficients suggested that inter-rater agreement was unacceptable for some indicators (Table 2).
One-facet design (3 R/1 O) Two-facet design (3 R/2 O) Domain # indicators # analyzed (% total) # with reliability
³ 0.70 (% analyzed) # analyzed (% total) # with reliability ³ 0.70 (% analyzed) All domains 97 62 (64) 47 (76) 60 (62) 45 (75) Physical 66 47 (71) 37 (79) 47 (71) 36 (77) Economic 11 4 (36) 4 (100) 4 (36) 4 (100) Institutional 3 2 (67) 2 (100) 2 (67) 2 (100) Local sociability 17 9 (53) 4 (44) 7 (41) 3 (43)
Table 2 also presents results from decision (D) studies based on the one-facet design. According to D study results, the scenario where one rater would rate neighbourhoods on one occasion (1R/1O) could provide reliable scores for all indicators of the institutional domain. Selected indicators from the economic and physical domains, such as garbage cans provided by the city (Table 2) or the presence of large trees and other indicators of “aesthetics” (data not shown), could also be rated with acceptable reliability by one rater on one occasion. This same scenario did not yield reliable measures for other indicators of the physical domain such as some measuring “cleanliness” and for most indicators from the local sociability domain, especially those measuring “general” and “smoking-related” local sociability (data not shown).
Table 2: Absolute Generalizability Coefficients and Standard Errors of Measurement for Indicators with the Lowest and Highest Reliability for One-Facet G and Selected D Studies on
First Rating Occasion (3 Raters, 60 Street Sections)
Generalizability coefficient (SEM)
Indicator G study D study
3 R/1 O 2 R/1 O 1 R/1 Oa
Physical domain
Presence of pedestrian path 0.35 (0.13) 0.27 (0.16) 0.15 (0.22) Garbage cans provided by the city 0.96 (0.13) 0.94 (0.16) 0.90 (0.22)
Economic domain
Commercial establishments closed without
indication 0.78 (0.34) 0.70 (0.42) 0.54 (0.60)
Presence of vacant lots 1.00 1.00 1.00
Institutional domain
Non-smoking law displayed 0.94 (0.27) 0.92 (0.35) 0.85 (0.46) Non-smoking law respected 0.94 (0.10) 0.91 (0.12) 0.83 (0.17)
Local sociability domain
Presence of children on private grounds 0.46 (0.15) 0.37 (0.18) 0.22 (0.26) Presence of children on public grounds 0.92 (0.23) 0.89 (0.28) 0.80 (0.40) O, occasion; R, raters; SEM, standard error of measurement.
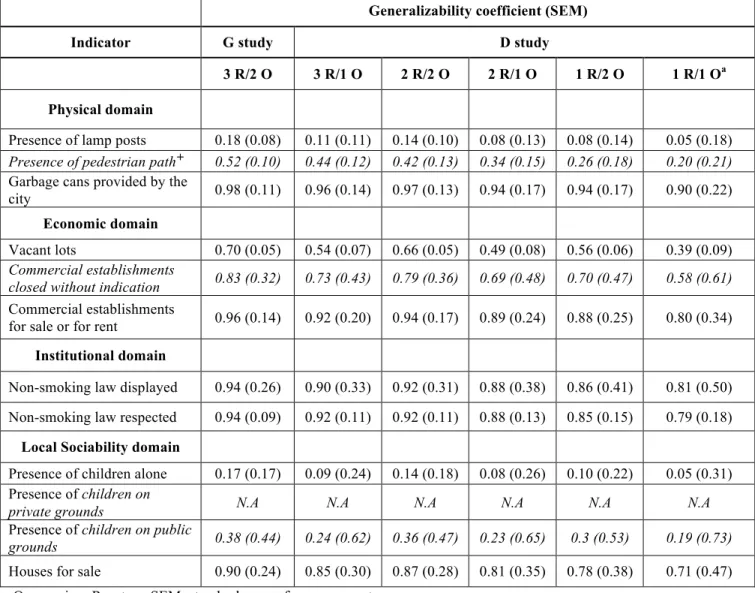
Absolute generalizability coefficients for the two-facet G study design (3R/2O) and selected D studies are presented in Table 3. In this design, coefficients combine dimensions of inter-rater agreement, temporal stability and the influence of the interaction between raters and occasions on reliability estimates. Indicators measured with the lowest and highest reliability in the G study are presented, along with the indicators presented in Table 2. This allows us to track if and how reliability estimates changed when moving from a one-facet (Table 2) to a two-facet (Table 3) design in which “rating occasion” was considered as a potential source of measurement error in addition to “raters”.
G study results suggest that all indicators pertaining to the economic and institutional domains were again measured with at least acceptable reliability while some indicators pertaining to the physical and local sociability domains were measured with less than acceptable reliability. Extremely low values were found for “lamp posts” (0.18 (SEM 0.08)) in the physical domain and for “children alone” (0.17 (SEM 0.17)) in the local sociability domain (Table 3). Similarly low generalizability coefficients were found for other indicators assessing the presence or behaviour of people (Appendix A).
Tracking the change in generalizability coefficients between the one- and two-facet designs shows that some indicators were less reliably measured on two occasions. For example, the reliability estimates for measuring “children on public grounds” decreased from 0.92 (SEM 0.23) (Table 2) to 0.38 (SEM 0.44) (Table 3) when occasion was considered as a source of error. This is understandable in light of results concerning the proportion of error variance attributable to each facet or their interaction. In the case of “children on public grounds”, the interaction between street section and occasion was responsible for the highest proportion of error variance (78.4%)
(Appendix A), highlighting the importance of time in measuring this indicator. A similar pattern was observed for other indicators of “general” and “smoking-related” local sociability (Appendix A).
Results from selected D studies based on the two-facet design are also found in Table 3. Overall, these suggest that having one rater rate each street section once (1R/1O) would yield much lower generalizability coefficients than for the G study (3R/2O). However, for indicators measuring the institutional domain, D coefficients for this scenario were generally still indicative of acceptable reliability. The scenario involving one rater and two occasions (1R/2O) yielded slightly more precise measures for indicators of the economic domain, while having two raters rate each street section on a same occasion (2R/1O) would generally yield the most precise measures for indicators of the physical domain. For the local sociability domain, results from decision studies suggested that indicators measuring the latent variable “neighbourhood stability” would be measured with acceptable reliability by one rater rating each street section once, while indicators measuring “general” and “smoking-related” local sociability, would not (data not shown).
Table 3: Absolute Generalizability Coefficients and Standard Errors of Measurement for Selected Indicators, Including Indicators with the Lowest and Highest Reliability for Two-Facet G and
Selected D Studies (3 Raters, 2 Occasions, 60 Street Sections)
Generalizability coefficient (SEM)
Indicator G study D study
3 R/2 O 3 R/1 O 2 R/2 O 2 R/1 O 1 R/2 O 1 R/1 Oa
Physical domain
Presence of lamp posts 0.18 (0.08) 0.11 (0.11) 0.14 (0.10) 0.08 (0.13) 0.08 (0.14) 0.05 (0.18)
Presence of pedestrian pathÈ 0.52 (0.10) 0.44 (0.12) 0.42 (0.13) 0.34 (0.15) 0.26 (0.18) 0.20 (0.21)
Garbage cans provided by the
city 0.98 (0.11) 0.96 (0.14) 0.97 (0.13) 0.94 (0.17) 0.94 (0.17) 0.90 (0.22) Economic domain
Vacant lots 0.70 (0.05) 0.54 (0.07) 0.66 (0.05) 0.49 (0.08) 0.56 (0.06) 0.39 (0.09)
Commercial establishments
closed without indication 0.83 (0.32) 0.73 (0.43) 0.79 (0.36) 0.69 (0.48) 0.70 (0.47) 0.58 (0.61)
Commercial establishments
for sale or for rent 0.96 (0.14) 0.92 (0.20) 0.94 (0.17) 0.89 (0.24) 0.88 (0.25) 0.80 (0.34) Institutional domain
Non-smoking law displayed 0.94 (0.26) 0.90 (0.33) 0.92 (0.31) 0.88 (0.38) 0.86 (0.41) 0.81 (0.50) Non-smoking law respected 0.94 (0.09) 0.92 (0.11) 0.92 (0.11) 0.88 (0.13) 0.85 (0.15) 0.79 (0.18)
Local Sociability domain
Presence of children alone 0.17 (0.17) 0.09 (0.24) 0.14 (0.18) 0.08 (0.26) 0.10 (0.22) 0.05 (0.31) Presence of children on
private grounds N.A N.A N.A N.A N.A N.A
Presence of children on public
grounds 0.38 (0.44) 0.24 (0.62) 0.36 (0.47) 0.23 (0.65) 0.3 (0.53) 0.19 (0.73)
Houses for sale 0.90 (0.24) 0.85 (0.30) 0.87 (0.28) 0.81 (0.35) 0.78 (0.38) 0.71 (0.47) O, occasion; R, raters; SEM, standard error of measurement.
a most time and cost-effective scenario.
È In italics: results for the two-facet design for a given indicator (taken from Table 2).
4. Discussion
In this paper, we presented theoretical, methodological and empirical material upon which to reflect in order to begin addressing three issues affecting systematic observation in neighbourhood and
health research: 1) the paucity of observation tools anchored in theories of neighbourhoods and health inequalities; 2) the need to develop observation tools specific to studying inequalities in smoking in a given context; and 3) the limited availability of reliable measures of directly observable neighbourhood characteristics.
Briefly, we anchored the development of the ISIS observation tool in a theoretical framework on neighbourhoods and health inequalities (Bernard et al., 2007) and developed reflective indicators using material from various sources, including accounts of the experience of smokers participating in one of 18 focus groups we had conducted among residents of socially-contrasted neighbourhoods. We then applied generalizability theory to data collected in a pilot study to estimate the reliability of the observation tool and assess the influence of pre-specified facets, or potential sources of measurement error (raters, rating occasions and their interaction), on reliability.
To our knowledge, our study is the first to have applied generalizability theory to evaluate the inter-rater reliability and temporal stability of neighbourhood observational measures. This is an improvement over other studies which have tended to estimate either inter-rater reliability only (Dunstan et al., 2005, Furr-Holden et al., 2010, Fuller and Muhajarine, 2010, Gauvin et al., 2005, McDonell and Waters, 2010, Weich et al., 2001) or inter-rater reliability and temporal stability separately (Millington et al., 2009, Paquet et al., 2010, Zenk et al., 2007, Pikora et al., 2002). Indeed, neighbourhoods are complex and dynamic places, and the measurement of their characteristics may be influenced by multiple interacting conditions. In order to control these potential sources of error, their individual and joint influence on measurement error must first be quantified. Using generalizability analyses allowed us to do so. Results from these analyses thus provided practical insights into our observational method, the quality of our measures and have
prompted us to revise or clarify some of the latent variables derived from our theoretical framework.
In our study, 76% and 75% of indicators were measured with acceptable to excellent reliability in the one and two-facet G studies respectively. This compares favourably to other studies in which between 40% to 50% (Weich et al., 2001, Brownson et al., 2004, Zenk et al., 2007) and 70% or more (Pikora et al., 2002, Gauvin et al., 2005, Fuller and Muhajarine, 2010, Paquet et al., 2010) of indicators reached this level of reliability. Stratifying generalizability coefficients by neighbourhood domain, however, demonstrated that between 43% and 100% of indicators were measured with precision. All indicators operationalizing latent variables from the economic and institutional domains and selected indicators from the physical domain were measured with high reliability. These results suggest that: 1) the indicators’ definitions and rater training were adequate, and 2) the first and/or second order latent variables they are meant to reflect may be well defined. As mentioned earlier, reliability is a necessary but insufficient component of validity (Cook and Beckman, 2006). Thus, if all indicators measuring a same latent variable are reliable, it is one indication that their shared underlying latent variable may be clearly defined. Nonetheless, some indicators from the physical domain and the majority of indicators from the local sociability domain were measured with low reliability.
To remedy the lack of reliability found for these indicators, a number of options are available. As pictured in Figure 1, developing reflective indicators begins with the operationalization of theoretically-defined latent variables with empirically observable indicators, which can be conceptually abstracted back to their underlying latent variables. These two interlinked streams inform different types of modifications to be brought to an observation tool and/or to its underlying
theoretical framework. For example, one might decide to modify the observation tool or method, clarify the operational definition of indicators or improve rater training, i.e modify the “empirical operationalization” stream. Otherwise, one might seek to clarify or review the meaning and description of underlying latent variables, i.e modify the “conceptual abstraction” arm of the process. We review some options below, based on the results of our generalizability study.
First, some indicators were measured with low reliability in the one-facet design but with slightly higher reliability in the two-facet design. This is suggestive of low inter-rater reliability and was observed for the presence of static neighbourhood characteristics such as those operationalizing “road safety” in the physical domain. Measurement of these indicators could be improved by reviewing operational definitions and rating criteria, and by conducting more thorough rater training prior to data collection.
Second, other indicators were measured with high reliability in the one-facet design but low reliability in the two-facet design when rating occasion was considered as a source of measurement error. This was mainly characteristic of indicators reflecting the local sociability domain, such as “children alone on public grounds”, which may be unstable over time. In this case, relying on two rating occasions rather than one may yield more reliable measures. Otherwise, one could develop new indicators that are more temporally stable operationalizations of the corresponding latent variable, or rely on alternative data collection methods. In the case of measuring the presence of children, one could turn to residents’ perceptions about this or to administrative data describing neighbourhood age structure.
Finally, some indicators were measured with low reliability in both one and two-facet designs, indicating that they could not be measured with precision. As such, these indicators could not provide meaning with regard to their underlying latent variable. Here again, this informs us that these indicators’ operational definition, or their rating criteria, may be inappropriate, that we may be unable to measure them reliably with our observation tool, or that the latent variables’ definition may be unclear. This situation would call for making modifications along the “empirical operationalization” stream of the process by developing new indicators, identifying better operationalizations of the same latent variable, or turning to alternative data sources. If all these options fail to yield reliable measures, a revision of the underlying latent variables altogether may be required, calling for modifications to the “conceptual abstraction” stream of the process. Given that as many as 57% of indicators pertaining to the local sociability domain fell in this category, a revision will be made to this second order latent variable and its reflective first order latent variables.
Results from decision studies varied considerably when taking into account both raters and occasions as sources of error. It is thus difficult to conclude that one unique rating scenario would be most appropriate to reliably measure all indicators included in our observation tool. In light of this, we recommend that researchers planning on conducting neighbourhood observation data collections rely on generalizability and decision studies to estimate the reliability of their measures. This would help ensure the quality of the measures acquired in larger etiologic studies and the appropriateness of the underlying theoretical framework as well as save time and money.
We note a few limitations to our study and findings which deserve future refinement. First, as this was a pilot study, only four neighbourhoods were rated, hampering our ability to evaluate our tool’s predictive or convergent validity, i.e whether measures correlated with inequalities in smoking. Second, the limited number of street sections observed might also have led to some indicators being rated with low reliability because of their low prevalence rather than because of our tool. Third, a number of indicators were observed with low prevalence or variability, rendering it impossible to estimate reliability coefficients. Inclusion of these indicators in future versions of the tool will be revised on a case-by-case basis. For example, “children smoking” will be removed from the tool since this phenomenon is not highly prevalent (University of Waterloo, 2009) and may be difficult to observe directly. Otherwise, rating categories may be modified to better discriminate between street sections. Fourth, observations were conducted by highly educated raters who did not live in the observed neighbourhoods, which might have introduced an “outsider’s” bias in ratings (Schaefer-McDaniel et al., 2010). We however feel that this bias was reduced since we relied on residents’ insights into their neighbourhood to identify relevant indicators and attempted to develop their definition and rating criteria in a way that paid “attention to the cultural norms, values, and behaviors of residents and neighborhoods of interest” (Schaefer-McDaniel et al., 2010). A standardized observation protocol including photographs of indicators was also created allowing other research teams and raters, highly educated or not, to replicate the observation procedure. Finally, some smoking-specific indicators such as the “presence of smokers” displayed poor reliability. However, we believe this does not preclude our observation tool from providing reliable measures of neighbourhood features influencing inequalities in smoking. Indeed, all indicators were developed because of their theoretical link to inequalities in smoking, and some directly involving smoking were in fact rated with acceptable reliability.
6. Conclusion
This work highlighted the importance of using reliability estimates as a starting point to reflect upon methodological and theoretical improvements that could move systematic observation forward as a data collection method in neighbourhood and health research. The development and evaluation process we followed is innovative and could well be replicated by researchers who study other health issues in different contexts.
Funding: This work is the result of a pilot study performed with funding from the Canadian
Tobacco Control Research Initiative (#19820). Martine Shareck is a recipient of a Doctoral Research Award from the Canadian Institutes of Health Research (CIHR), conjointly with the Public Health Agency of Canada. Katherine L. Frohlich is a CIHR New Investigator.
Acknowledgements: We thank Marie-Claude Tremblay for her work as a neighbourhood rater and Maxime Pedneault for his involvement in rating neighbourhoods and entering data.
References
Baum, F. E., Ziersch, A. M., Zhang, G. & Osborne, K. 2009. Do perceived neighbourhood cohesion and safety contribute to neighbourhood differences in health? Health Place, 15, 925-34. Bernard, P., Charafeddine, R., Frohlich, K. L., Daniel, M., Kestens, Y. & Potvin, L. 2007. Health
inequalities and place: a theoretical conception of neighbourhood. Soc Sci Med, 65, 1839-52.
Bollen, K. A. 1989. Structural equations with latent variables, New York, Wiley. Brennan, R. L. 2001. Generalizability theory, New York, Springer.
Brownson, R. C., Hoehner, C. M., Brennan, L. K., Cook, R. A., Elliott, M. B. & Mcmullen, K. M. 2004. Reliability of Two Instrumentsfor Auditing the Environmentfor Physical Activity. Journal of Physical Activity and Health,, 1, 189-207.
Brownson, R. C., Hoehner, C. M., Day, K., Forsyth, A. & Sallis, J. F. 2009. Measuring the Built Environment for Physical Activity: State of the Science. American Journal of Preventive Medicine, 36, S99-S123.e12.
Cardinet, J., Johnson, S. & Pini, G. 2010. Applying generalizability theory using EduG, New York, Routledge.
Caughy, M. O., O'campo, P. J. & Patterson, J. 2001. A brief observational measure for urban neighborhoods. Health Place, 7, 225-36.
Chaix, B. 2009. Geographic life environments and coronary heart disease: a literature review, theoretical contributions, methodological updates, and a research agenda. Annu Rev Public Health, 30, 81-105.
Chow, C. K., Lock, K., Teo, K., Subramanian, S. V., Mckee, M. & Yusuf, S. 2009. Environmental and societal influences acting on cardiovascular risk factors and disease at a population level: a review. Int J Epidemiol, 38, 1580-94.
Clarke, P., Ailshire, J., Melendez, R., Bader, M. & Morenoff, J. 2010. Using Google Earth to conduct a neighborhood audit: Reliability of a virtual audit instrument. Health & Place, 16, 1224-1229.
Cohen, B., Evers, S., Manske, S., Bercovitz, K. & Edward, H. G. 2003. Smoking, physical activity and breakfast consumption among secondary school students in a southwestern Ontario community. Can J Public Health, 94, 41-4.
Cook, D. A. & Beckman, T. J. 2006. Current concepts in validity and reliability for psychometric instruments: theory and application. Am J Med, 119, 166 e7-16.
Crocker, L. & Algina, J. 2006a. Introduction to generalizability theory. In: Baird, M., Staudt, M. & Stranz, M. (eds.) Introduction to classical and modern test theory. New York: Holt, Rinehart, and Winston.
Crocker, L. & Algina, J. 2006b. Procedures for estimating reliability. In: Baird, M., Staudt, M. & Stranz, M. (eds.) Introduction to classical and modern test theory. New York: Holt, Rinehart, and Winston.
Cummins, S. & Macintyre, S. 2009. Are secondary data sources on the neighbourhood food environment accurate? Case-study in Glasgow, UK. Preventive Medicine, 49, 527-528. Cummins, S., Macintyre, S., Davidson, S. & Ellaway, A. 2005. Measuring neighbourhood social
and material context: generation and interpretation of ecological data from routine and non-routine sources. Health Place, 11, 249-60.
Daniel, M. & Kestens, Y. 2004. Portion sizes: Selection of Census Tracts in Toronto and Montreal for a pilot study. (Unpublished work).
Dunstan, F., Weaver, N., Araya, R., Bell, T., Lannon, S., Lewis, G., Patterson, J., Thomas, H., Jones, P. & Palmer, S. 2005. An observation tool to assist with the assessment of urban residential environments. Journal of Environmental Psychology, 25, 293-305.
Egan, M., Tannahill, C., Petticrew, M. & Thomas, S. 2008. Psychosocial risk factors in home and community settings and their associations with population health and health inequalities: A systematic meta-review. BMC Public Health, 8, 239.
Ellaway, A. & Macintyre, S. 2009. Are perceived neighbourhood problems associated with the likelihood of smoking? J Epidemiol Community Health, 63, 78-80.
Farley, T., Rice, J., Bodor, J., Cohen, D., Bluthenthal, R. & Rose, D. 2009. Measuring the Food Environment: Shelf Space of Fruits, Vegetables, and Snack Foods in Stores. Journal of Urban Health, 86, 672-682.
French, S. A., Story, M. & Jeffery, R. W. 2001. Environmental influences on eating and physical activity. Annu Rev Public Health, 22, 309-35.
Frohlich, K. L., Bodnarchuk, J. L., Chateau, D., Roos, L. & Forsyth, S. 2007a. What you see is what you get? Questioning the relationship between objective and subjective appraisals of neighbourhood resources in relation to health. Can J Public Health, 98, 292-6.
Frohlich, K. L., Dunn, J. R., Mclaren, L., Shiell, A., Potvin, L., Hawe, P., Dassa, C. & Thurston, W. E. 2007b. Understanding place and health: a heuristic for using administrative data. Health Place, 13, 299-309.
Frohlich, K. L., Mykhalovskiy, E., Miller, F. & Daniel, M. 2004. Advancing the population health agenda: encouraging the integration of social theory into population health research and practice. Can J Public Health, 95, 392-5.
Frohlich, K. L., Potvin, L., Gauvin, L. & Chabot, P. 2002. Youth smoking initiation: disentangling context from composition. Health Place, 8, 155-66.
Fuller, D. L. & Muhajarine, N. 2010. Replication of the Neighborhood Active Living Potential Measure in Saskatoon, Canada. American Journal of Preventive Medicine, 39, 364-367.
Furr-Holden, C., Smart, M., Pokorni, J., Ialongo, N., Leaf, P., Holder, H. & Anthony, J. 2008. The NIfETy Method for Environmental Assessment of Neighborhood-level Indicators of Violence, Alcohol, and Other Drug Exposure. Prevention Science, 9, 245-255.
Furr-Holden, C. D. M., Campbell, K. D. M., Milam, A. J., Smart, M. J., Ialongo, N. A. & Leaf, P. J. 2010. Metric Properties of the Neighborhood Inventory for Environmental Typology (NIfETy): An Environmental Assessment Tool for Measuring Indicators of Violence, Alcohol, Tobacco, and Other Drug Exposures. Evaluation Review, 34, 159-184.
Gauvin, L., Richard, L., Craig, C. L., Spivock, M., Riva, M., Forster, M., Laforest, S., Laberge, S., Fournel, M. C., Gagnon, H., Gagne, S. & Potvin, L. 2005. From walkability to active living potential: an "ecometric" validation study. Am J Prev Med, 28, 126-33.
Groupe De Travail De La Société Suisse Pour La Recherche En Éducation & Educan Inc. 2006. EduG. Neuchatel, Suisse.
Kawachi, I. O. & Berkman, L. F. (eds.) 2003. Neighborhoods and health, New York, N.Y.: Oxford University Press.
Kestens, Y., Lebel, A., Daniel, M., Thèriault, M. & Pampalon, R. 2010. Using experienced activity spaces to measure foodscape exposure. Health & Place, 16, 1094-1103.
Kim, D. 2008. Blues from the Neighborhood? Neighborhood Characteristics and Depression. Epidemiol Rev, 30, 101-117.
Kirtland, K. A., Porter, D. E., Addy, C. L., Neet, M. J., Williams, J. E., Sharpe, P. A., Neff, L. J., Kimsey, C. D. & Ainsworth, B. E. 2003. Environmental measures of physical activity supports: Perception versus reality. American Journal of Preventive Medicine, 24, 323-331. Krieger, N. 2001. Theories for social epidemiology in the 21st century: an ecosocial perspective.
Laraia, B. A., Messer, L., Kaufman, J. S., Dole, N., Caughy, M., O'campo, P. & Savitz, D. A. 2006. Direct observation of neighborhood attributes in an urban area of the US south: characterizing the social context of pregnancy. Int J Health Geogr, 5, 11.
Maccallum, R. C. & Browne, M. W. 1993. The use of causal indicators in covariance structure models: Some practical issues. Psychological Bulletin, 114, 533-541.
Macintyre, S. & Ellaway, A. 2000. Ecological Approaches: Rediscovering the Role of the Physical and Social Environment. In: Berkman, L. F. & Kawachi, I. (eds.) Social epidemiology. Oxford ; New York: Oxford University Press.
Macintyre, S. & Ellaway, A. 2003. Neighborhoods and Health: An Overview. In: Kawachi, I. O. & Berkman, L. F. (eds.) Neighborhoods and health. New York, N.Y.: Oxford University Press.
Macintyre, S., Macdonald, L. & Ellaway, A. 2008. Lack of agreement between measured and self-reported distance from public green parks in Glasgow, Scotland. International Journal of Behavioral Nutrition and Physical Activity, 5, 26.
Mackenzie, S. B., Podsakoff, P. M. & Jarvis, C. B. 2005. The Problem of Measurement Model Misspecification in Behavioral and Organizational Research and Some Recommended Solutions. Journal of Applied Psychology, 90, 710-730.
Mcdonell, J. & Waters, T. 2010. Construction and Validation of an Observational Scale of Neighborhood Characteristics. Social Indicators Research, 1-19.
Miles, R. 2006. Neighborhood disorder and smoking: findings of a European urban survey. Soc Sci Med, 63, 2464-75.
Millington, C., Ward Thompson, C., Rowe, D., Aspinall, P., Fitzsimons, C., Nelson, N. & Mutrie, N. 2009. Development of the Scottish Walkability Assessment Tool (SWAT). Health & Place, 15, 474-481.
Narayan, S. & Pebley, A. 2004. The Los Angeles Family and Neighborhood Survey: Neighborhood Observation Forms and Interviewer Manual. In: Labor and Population Program (ed.) Report DRU-2400/6-1-LAFANS. Santa Monica, CA: RAND Corporation, .
Nunnally, J. C. 1978. Psychometric theory, New York, McGraw-Hill.
Ohri-Vachaspati, P. & Leviton, L. C. 2010. Measuring Food Environments: A Guide to Available Instruments. American Journal of Health Promotion, 24, 410-426.
Paquet, C., Cargo, M., Kestens, Y. & Daniel, M. 2010. Reliability of an instrument for direct observation of urban neighbourhoods. Landscape and Urban Planning, 97, 194-201. Parsons, J., Singh, G., Scott, A., Nisenbaum, R., Balasubramaniam, P., Jabbar, A., Zaidi, Q.,
Sheppard, A., Ramsay, J., O'campo, P. & Dunn, J. 2010. Standardized observation of neighbourhood disorder: does it work in Canada? International Journal of Health Geographics, 9, 6.
Pickett, K. E. & Pearl, M. 2001. Multilevel analyses of neighbourhood socioeconomic context and health outcomes: a critical review. J Epidemiol Community Health, 55, 111-22.
Pikora, T. J., Bull, F. C., Jamrozik, K., Knuiman, M., Giles-Corti, B. & Donovan, R. J. 2002. Developing a reliable audit instrument to measure the physical environment for physical activity. Am J Prev Med, 23, 187-94.
Riva, M., Gauvin, L. & Barnett, T. A. 2007. Toward the next generation of research into small area effects on health: a synthesis of multilevel investigations published since July 1998. J Epidemiol Community Health, 61, 853-61.
Rundle, A. G., Bader, M. D. M., Richards, C. A., Neckerman, K. M. & Teitler, J. O. 2011. Using Google Street View to Audit Neighborhood Environments. American Journal of Preventive Medicine, 40, 94-100.
Sampson, R. J. & Raudenbush, S. W. 1999. Systematic social observation of public spaces: A new look at disorder in urban neighborhoods. American Journal of Sociology, 105, 603-651. Schaefer-Mcdaniel, N., Dunn, J. R., Minian, N. & Katz, D. 2010. Rethinking measurement of
neighborhood in the context of health research. Social Science & Medicine, 71, 651-656. Schaefer-Mcdaniel, N., O'brien Caughy, M., O'campo, P. & Gearey, W. 2009. Examining
methodological details of neighbourhood observations and the relationship to health: A literature review. Soc Sci Med.
Spss Inc 16.0 ed.: Chicago, IL USA.
Stafford, M., Cummins, S., Ellaway, A., Sacker, A., Wiggins, R. D. & Macintyre, S. 2007. Pathways to obesity: identifying local, modifiable determinants of physical activity and diet. Soc Sci Med, 65, 1882-97.
Statistics Canada. 2009. More information on census tract (CT) [Online]. Available:
http://www.census2006.com/census-recensement/2006/ref/dict/geo013a-eng.cfm
[Accessed 12-18 2009].
Statistics Canada. 2011. Census [Online]. Available: http://www12.statcan.gc.ca/census-recensement/index-eng.cfm [Accessed].
University of Waterloo 2009. Youth Smoking Survey:Smoking Profiles for Canada 2008-2009. Waterloo: University of Waterloo.
Weich, S., Burton, E., Blanchard, M., Prince, M., Sproston, K. & Erens, B. 2001. Measuring the built environment: validity of a site survey instrument for use in urban settings. Health & Place, 7, 283-292.
Yen, I. H., Michael, Y. L. & Perdue, L. 2009. Neighborhood Environment in Studies of Health of Older Adults: A Systematic Review. American Journal of Preventive Medicine, 37, 455-463.
Zenk, S. N., Schulz, A. J., Mentz, G., House, J. S., Gravlee, C. C., Miranda, P. Y., Miller, P. & Kannan, S. 2007. Inter-rater and test-retest reliability: Methods and results for the neighborhood observational checklist. Health & Place, 13, 452-465.
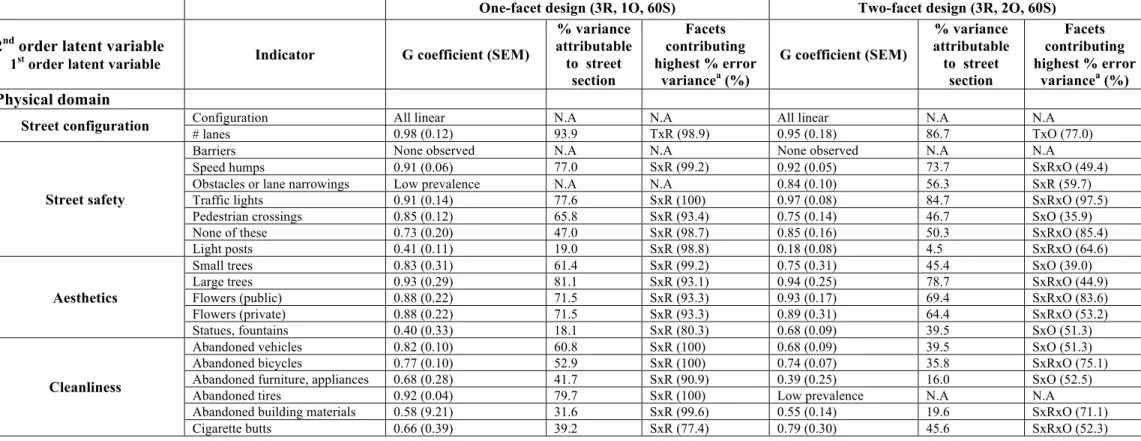
A complete list of first-order latent variables and reflective indicators are shown in Table A1. For each indicator, absolute generalizability coefficients and their standard error of measurement are given for the one-facet (3 raters, 1 occasion, 60 street
sections) and two-facet (3 raters, 2 occasions, 60 street sections) G study designs. Percentage variance in ratings which is attributable to the street section is also presented, along with the facets contributing the highest percentage in error variance for the measurement design.
Table A1: Absolute Generalizability Coefficients, Variance Components in Percentage of the Total Variance and Facets Contributing the Highest Percentage in Error Variance for All Indicators for the One- and Two-Facet G Studies (Raters (R), Occasions (O), Street
Sections (S))
One-facet design (3R, 1O, 60S) Two-facet design (3R, 2O, 60S) 2nd order latent variable
1st order latent variable Indicator G coefficient (SEM)
% variance attributable to street section Facets contributing highest % error variancea (%) G coefficient (SEM) % variance attributable to street section Facets contributing highest % error variancea (%) Physical domain
Street configuration Configuration # lanes All linear 0.98 (0.12) N.A 93.9 N.A TxR (98.9) All linear 0.95 (0.18) N.A 86.7 N.A TxO (77.0)
Street safety
Barriers None observed N.A N.A None observed N.A N.A
Speed humps 0.91 (0.06) 77.0 SxR (99.2) 0.92 (0.05) 73.7 SxRxO (49.4)
Obstacles or lane narrowings Low prevalence N.A N.A 0.84 (0.10) 56.3 SxR (59.7)
Traffic lights 0.91 (0.14) 77.6 SxR (100) 0.97 (0.08) 84.7 SxRxO (97.5)
Pedestrian crossings 0.85 (0.12) 65.8 SxR (93.4) 0.75 (0.14) 46.7 SxO (35.9)
None of these 0.73 (0.20) 47.0 SxR (98.7) 0.85 (0.16) 50.3 SxRxO (85.4)
Light posts 0.41 (0.11) 19.0 SxR (98.8) 0.18 (0.08) 4.5 SxRxO (64.6)
Aesthetics
Small trees 0.83 (0.31) 61.4 SxR (99.2) 0.75 (0.31) 45.4 SxO (39.0)
Large trees 0.93 (0.29) 81.1 SxR (93.1) 0.94 (0.25) 78.7 SxRxO (44.9)
Flowers (public) 0.88 (0.22) 71.5 SxR (93.3) 0.93 (0.17) 69.4 SxRxO (83.6)
Flowers (private) 0.88 (0.22) 71.5 SxR (93.3) 0.89 (0.31) 64.4 SxRxO (53.2)
Statues, fountains 0.40 (0.33) 18.1 SxR (80.3) 0.68 (0.09) 39.5 SxO (51.3)
Cleanliness
Abandoned vehicles 0.82 (0.10) 60.8 SxR (100) 0.68 (0.09) 39.5 SxO (51.3)
Abandoned bicycles 0.77 (0.10) 52.9 SxR (100) 0.74 (0.07) 35.8 SxRxO (75.1)
Abandoned furniture, appliances 0.68 (0.28) 41.7 SxR (90.9) 0.39 (0.25) 16.0 SxO (52.5)
Abandoned tires 0.92 (0.04) 79.7 SxR (100) Low prevalence N.A N.A
Abandoned building materials 0.58 (9.21) 31.6 SxR (99.6) 0.55 (0.14) 19.6 SxRxO (71.1)
Cigarette packs/packaging 0.74 (0.32) 49.0 SxR (74.8) 0.57 (0.35) 30.0 SxO (56.5)
Litter/broken glass 0.73 (0.36) 46.8 SxR (76.0) 0.81 (0.30) 50.1 SxRxO (47.9)
Condoms/drug paraphernalia Low prevalence N.A N.A Low prevalence N.A N.A
Dog faeces 0.53 (0.11) 27.5 SxR (94.2) 0.70 (0.09) 30.6 SxRxO (78.2)
Garbage cans (city/institutions) 0.96 (0.13) 89.6 SxR (100) 0.98 (0.11) 90.1 SxRxO (57.4)
Garbage cans (commercial) 0.49 (0.14) 24.6 SxR (96.0) 0.82 (0.10) 44.7 SxRxO (94.0)
Garbage cans (residents) 0.88 (0.06) 70.5 SxR (100) 0.64 (0.08) 31.1 SxRxO (49.6)
Garbage cans (overflowing) 0.79 (0.19) 56.0 SxR (98.4) 0.66 (0.20) 40.1 SxO (48.2)
Physical disorder Graffiti/tags Signs of vandalism 0.83 (0.25) 0.81 (0.06) 61.9 59.1 SxR (94.6) SxR (100) 0.87 (0.22) 0.84 (0.20) 58.2 39.3 SxRxO (56.6) SxO (60.2) Revitalisation
Murals 0.84 (0.14) 64.0 SxR (96.9) 0.81 (0.12) 51.4 SxR (51.2)
Commercial establishments being
renovated 0.96 (0.12) 90.1 SxR (98.9) 0.77 (0.27) 55.8 SxO (82.3)
Houses being renovated 0.92 (0.16) 80.3 SxR (100) 0.87 (0.19) 67.5 SxO (54.5)
Quality of the physical environment
Global condition of commercial
establishments 0.96 (0.27) 88.1 SxR (95.9) 0.95 (0.27) 78.1 SxRxO (78.2)
Global condition houses 0.85 (0.30) 64.9 SxR (97.2) 0.84 (0.29) 56.5 SxR (52.9)
Global condition of institutional
establishments 0.96 (0.22) 88.9 SxR (100) 0.94 (0.24) 78.2 SxRxO (47.4)
Global condition of community
organizations 0.88 (0.28)
71.3 SxR (100)
0.95 (0.20)
75.8 SxRxO (83.8)
Public green space (presence) 0.90 (0.11) 72.3 SxR (95.3) 0.87 (0.11) 62.5 SxR (60.2)
Public green space (condition) Low prevalence N.A N.A Low prevalence N.A N.A
Pedestrian path (presence) 0.35 (0.13) 15.3 SxR (92.5) 0.52 (0.10) 20.5 SxR (57.9)
Pedestrian path (condition) Low prevalence N.A N.A Low prevalence N.A N.A
Soccer field (presence) 0.92 (0.04) 79.7 SxR (100) 0.92 (0.04) 79.7 SxR (100)
Soccer field (condition) Low prevalence N.A N.A Low prevalence N.A N.A
Basketball field (presence) 0.60 (0.06) 33.0 SxR (100) 0.54 (0.07) 24.4 SxR (77.3)
Basketball field (condition) Low prevalence N.A N.A Low prevalence N.A N.A
Baseball field (presence) None observed N.A N.A None observed N.A N.A
Baseball field (condition) None observed N.A N.A None observed N.A N.A
Tennis field (presence) 0.92 (0.04) 79.7 SxR (100) 0.92 (0.04) 79.7 SxR (100)
Tennis field (condition) Low prevalence N.A N.A Low prevalence N.A N.A
Public pool (presence) 0.79 (0.07) 56.1 SxR (97.7) 0.84 (0.06) 60.7 SxR (87.0)
Public pool (condition) Low prevalence N.A N.A Low prevalence N.A N.A
Play area, table, grill (presence) 0.93 (0.07) 80.6 SxR (100) 0.83 (0.10) 59.1 SxO (55.3)
Play area, table, grill (condition) Low prevalence N.A N.A Low prevalence N.A N.A
Benches in a park (presence) 0.86 (0.11) 66.5 SxR (100) 0.88 (0.10) 59.0 SxRxO (75.7)
Benches in a park (condition) Low prevalence N.A N.A Low prevalence N.A N.A
Benches on sidewalk (presence) 0.82 (0.13) 60.8 SxR (100) 0.89 (0.10) 66.5 SxRxO (45.1)
Benches on sidewalk (condition) Low prevalence N.A N.A Low prevalence N.A N.A
Water body (presence) None observed N.A N.A None observed N.A N.A