HAL Id: hal-00932125
https://hal.archives-ouvertes.fr/hal-00932125
Submitted on 16 Jan 2014
HAL is a multi-disciplinary open access
archive for the deposit and dissemination of
sci-entific research documents, whether they are
pub-lished or not. The documents may come from
teaching and research institutions in France or
abroad, or from public or private research centers.
L’archive ouverte pluridisciplinaire HAL, est
destinée au dépôt et à la diffusion de documents
scientifiques de niveau recherche, publiés ou non,
émanant des établissements d’enseignement et de
recherche français ou étrangers, des laboratoires
publics ou privés.
Saliency detection for stereoscopic images
Yuming Fang, Junle Wang, Manish Narwaria, Patrick Le Callet, Weisi Lin
To cite this version:
Yuming Fang, Junle Wang, Manish Narwaria, Patrick Le Callet, Weisi Lin. Saliency detection for
stereoscopic images. Visual Communications and Image Processing (VCIP), 2013, Nov 2013, kuching,
Malaysia. pp.1–6, �10.1109/VCIP.2013.6706346�. �hal-00932125�
SALIENCY DETECTION FOR STEREOSCOPIC IMAGES
Yuming Fang
1, Junle Wang
2, Manish Narwaria
2, Patrick Le Callet
2, Weisi Lin
31
School of Information Technology, Jiangxi University of Finance and Economics, Nanchang, China
2LUNAM Universit, Universit de Nantes, IRRCCyN UMR CNRS, Polytech Nantes, Nantes, France
3
School of Computer Engineering, Nanyang Technological University, Singapore
[email protected]; [email protected]; [email protected];
[email protected]; [email protected]
ABSTRACT
Saliency detection techniques have been widely used in var-ious 2D multimedia processing applications. Currently, the emerging applications of stereoscopic display require new saliency detection models for stereoscopic images. Different from saliency detection for 2D images, depth features have to be taken into account in saliency detection for stereoscopic images. In this paper, we propose a new stereoscopic salien-cy detection framework based on the feature contrast of color, intensity, texture, and depth. Four types of features including color, luminance, texture, and depth are extracted from DC-T coefficients to represent the energy for image patches. A Gaussian model of the spatial distance between image patch-es is adopted for the consideration of local and global contrast calculation. A new fusion method is designed to combine the feature maps for computing the final saliency map for stereo-scopic images. Experimental results on a recent eye track-ing database show the superior performance of the proposed method over other existing ones in saliency estimation for 3D images.
Index Terms— stereoscopic images, 3D Saliency
Detec-tion, stereoscopic saliency detecDetec-tion, visual attention 1. INTRODUCTION
Visual attention is an important characteristic in the Human Visual System (HVS) for visual information processing. With large amount of visual information, visual attention would se-lectively process the important visual information by filtering out others to reduce the complexity for scene analysis. These important visual information is also termed as salient regions or Regions of Interest (ROIs) in natural images. There are two different approaches for visual attention mechanism: bottom-up and top-down. Bottom-bottom-up approach, which is data-driven and task-independent, is a perception process for automatic salient region selection for natural scenes [1]-[7], while top-down approach is a task-dependent cognitive processing af-fected by the performed tasks, feature distribution of targets, and so on [8]-[9].
Over the past decades, many studies have tried to propose computational models of visual attention for various multime-dia processing applications, such as visual retargeting [5, 7], visual quality assessment [11], visual coding [12], etc. Ac-cording to the Feature Integration Theory (FIT) [13], the ear-ly selective attention causes some image regions to be salient due to their different features (such as color, intensity, tex-ture, depth, etc.) from their surrounding regions. Based on the FIT, many bottom-up saliency detection models have been proposed for 2D images/videos recently [1]-[6].
Itti et al. proposed one of the earliest computational saliency detection model based on the neuronal architecture of the primates’ early visual system [1]. Bruce et al. de-signed a saliency detection algorithm based on information maximization [2]. Le Meur et al. proposed a computational model of visual attention based on characteristics of the HVS including contrast sensitivity functions, perceptual decompo-sition, visual masking, and center-surround interactions [10]. Hou et al. proposed a saliency detection method by a con-cept of Spectral Residual [3]. The saliency map is comput-ed by the log spectra representation of the image calculat-ed from Fourier Transform. Bascalculat-ed on Hou’s model, Guo et
al. designed a saliency detection algorithm based on phase
spectrum, in which the saliency map is calculated by Inverse Fourier Transform on a constant amplitude spectrum and the original phase spectrum [12]. Recently, many saliency de-tection models have been proposed by patch-based contrast and obtain promising performance for salient region extrac-tion [4, 5, 6]. In [6], a context-based saliency detecextrac-tion model is proposed based on patch-contrast from color and intensity features. Fang et al. introduced a saliency detection model in compressed domain for the application of image retargeting [5].
Recently, there are various emerging applications with the development of stereoscopic display [15, 16, 17]. Compared with saliency detection for 2D images, the depth cue has to to be taken into account in saliency detection for 3D images. Currently, there are several studies exploiting the 3D salien-cy detection [18]-[23]. Zhang et al. designed a
stereoscop-ic visual attention algorithm for 3D video based on multiple perceptual stimuli [18]. Chamaret et al. built one Region of Interest (ROI) extraction method for adaptive 3D rendering [19]. Both studies [18] and [19] adopt depth map to weight the 2D saliency map to calculate the final saliency map for 3D images. Another method of 3D saliency detection model is built by incorporating depth saliency map into the tradi-tional 2D saliency detection methods. In [20], Ouerhani et
al. extended a 2D saliency detection model for 3D saliency
detection by taking depth cues into account. Potapova et al. introduced a 3D saliency detection model for robotics tasks by incorporating the top-down cues into the bottom-up saliency detection [21]. Recently, Wang et al. proposed a computa-tional model of visual attention for 3D images by extending the traditional 2D saliency detection methods [23].
From the above description, the key of the 3D saliency detection model is how to adopt the depth cue besides the tra-ditional 2D low-level features such as color, intensity, orienta-tion, etc. Previous studies from neuroscience indicate that the depth feature would cause human beings’ attention focusing on the salient regions as well as other low-level features such as color, intensity, motion, etc. [13, 14]. Therefore, an accu-rate 3D saliency detection model should take depth contrast into account as well as contrast from other common low-level features.
In this paper, we propose a novel saliency detection framework based on the feature contrast from color, lumi-nance, texture, and depth. The proposed model is basically built on the energy contrast between image patches, which is used to represent the center-surround differences for image patches. It is well accepted that the DCT (Discrete Cosine Transform) is a superior representation for energy compaction and most of the signal information is concentrated on a few low-frequency components of the DCT [24]. Due to its en-ergy compactness property, the DCT have been widely used in various signal processing applications in the past decades. In the proposed algorithm, the input image and depth map are firstly divided into small image patches. Color, luminance and texture features are extracted based on DCT coefficients for each image patch in the original image, while depth feature is extracted based on DCT coefficients for each image patch in the depth map. The feature contrast is calculated based on the center-surround feature differences between image patch-es, weighted by a Gaussian model of spatial distances for the consideration of local and global contrast. Based on the com-pactness property of feature maps, a new fusion method is designed to fuse the feature maps to get the final saliency map for 3D images. Experimental results on the eye-tracking database demonstrate the much better performance of the pro-posed model compared with other existing ones.
The rest of the paper is organized as follows. In Section 2, the proposed model is introduced in detail. Section 3 provides the experimental results between the proposed method with other existing ones. The final section gives the discussion and
conclusion for the study.
2. THE PROPOSED MODEL
In the proposed model, we calculate the saliency map based on the patch-based energy contrast from color, luminance, texture and depth features. In this section, we firstly intro-duce the feature extraction for the proposed model. Then the feature map calculation is described. In the final subsection, we present the new fusion method on how to combine feature maps to calculate the final saliency map for the 3D image.
2.1. Feature Extraction
In this study, the input image is divided into small image patches and then the DCT coefficients are adopted to repre-sent the energy for each image patch. The input RGB image is firstly converted to YCbCr color space due to its percep-tual property. In YCbCr color space, the Y component rep-resents the luminance information, while Cb and Cr are two color components. In the DCT, DC coefficients represent the average energy over all pixels in the image patch, while AC coefficients represent the detailed frequency properties for the image patch. Thus, we use the DC coefficient of Y compo-nent to represent the luminance feature for the image patch as
L = YDC(YDCis the DC coefficient of Y component), while
the DC coefficients of Cb and Cr components are adopted to represent the color feature as C1 = CbDCand C2 = CrDC
(CbDC and CrDC are the DC coefficients from Cb and Cr
components respectively).
Since the Cr and Cb components mainly include the color information, we use the AC coefficients from only Y com-ponent to represent the texture feature for the image patch. The existing study in [25] demonstrate that the first 9 low-frequency AC coefficients in zig-zag scanning can represen-t mosrepresen-t energy for represen-the derepresen-tailed frequency informarepresen-tion in one 8× 8 image patch. Based on the study [25], we use the first 9 low-frequency AC coefficients to represent the texture feature for each image patch as T ={YAC1, YAC2, ..., YAC9}.
For the depth feature, we firstly calculate the perceived depth information based on the disparity. The depth map M for the image pair can be calculated as [23]:
M = V /(1 + d· H
P· W) (1)
where V represents the viewing distance of the observer; d denotes the interocular distance; P is the disparity between pixels; W and H represent the width (in cm) and horizontal resolution of the display screen, respectively.
Similar with feature extraction for color and luminance, we adopt the DC coefficient from image patches in depth map in Eq. (1) as D = MDC(MDCrepresents the DC coefficient
As described above, we can extract five features of color, luminance, texture and depth (L, C1, C2, T, D) for the input
stereoscopic image. We will introduce how to calculate the feature map based on these extracted features in the next sub-section.
2.2. Feature Map Calculation
According to FIT [13], the salient regions in visual scenes will pop out due to their feature contrast from their surrounding regions. Thus, the direct method to extract salient regions in visual scenes is to calculate the feature contrast between im-age patches and their surrounding patches for visual scenes. In this study, we estimate the saliency value for each image patch based on the feature contrast between this image path and all the other patches in the image. It is well accepted that the HVS is highly space-variant due to the different densi-ties of cone photoreceptor cells in the retina [26]. The visual acuity decreases with the increasing eccentricity from the fix-ation region, which means that the HVS is more sensitive to the feature contrast from nearer neighborhood patches com-pared with that from farther neighborhood patches. Thus, we take this property of the HVS into consideration during the saliency estimation. Due to the generality of the Gaussian model, we use a Gaussian model of spatial distance between image patches to weight the feature contrast for feature map calculation. The saliency value Fikof the image patch i in the feature k can be calculated as:
Fik =∑ j̸=i 1 σ√2πe l2ij 2σ2Uijk (2)
where k represents the feature and k∈ {L, C1, C2, T, D}; lij
denotes the spatial distance between image patches i and j;
Uijk represents the feature difference between image patches
i and j from feature k; σ is the parameter for the Gaussian
model and it determines the degree of local and global con-trast for the saliency estimation. From this equation, we can see that the saliency value of each image patch is calculated based on feature contrast from all other image patches. Due to the different weighting values for image patches from d-ifferent spatial distances, the proposed model considers both local and global contrast for saliency estimation.
Since the color, luminance and depth features are repre-sented by DC coefficients, the feature contrast between two image patches i and j can be calculated as the difference be-tween DC coefficients as follows.
Uijm= B m i − Bmj Bm i + Bmj (3)
where Bmrepresents the feature and Bm∈ {L, C
1, C2, D};
The texture feature is represented as 9 low-frequency AC coefficients and we calculate the feature contrast from texture
Uij′ between two image patches i and j as:
Uij′ = √∑ t(B ′t i − B ′t j)2 ∑ t(B ′t i + B ′t j) (4) where t represents the AC coefficients and t ∈ {1, 2, ..., 9};
B′represents the texture feature.
2.3. Feature Map Fusion
After obtaining feature maps indicated in Eq. (2), we fuse these feature maps from color, luminance, texture and depth to calculate the final saliency map. Most existing studies of 3D saliency detection (e.g. [23]) use simple linear combina-tion to fuse the feature maps to obtain the final saliency map. The weighting for the linear combination is set as constant values and is the same for all images. In this study, we pro-pose a new method to assign adaptive weighting for the fusion of feature maps.
Generally, the salient regions in a good saliency map should be small and compact, since the HVS always focus on some specific interesting regions in images. Therefore, a good feature map should detect small and compact regions in the image. During the fusion of different feature maps, we can assign more weighting for those feature maps with smal-l and compact sasmal-lient regions and smal-less weighting for others with more spread salient regions. Here, we define the mea-sure of compactness by the spatial variance of feature maps. The spatial variance υk of feature map Fk can be computed
as follows. υk= ∑ (i,j) √ (i− Ei,k)2+ (j− Ej,k)2· Fk(i, j) ∑ (i,j)Fk(i, j) (5) where (i, j) is the spatial location in the feature map;k rep-resents the feature channel and k ∈ {L, C1, C2, T, D};
(Ei,k, Ej,k) are the spatial expectation location of the salient
regions which are calculated as:
Ei,k = ∑ (i,j)i· Fk(i, j) ∑ (i,j)Fk(i, j) (6) Ej,k= ∑ (i,j)j· Fk(i, j) ∑ (i,j)Fk(i, j) (7) We use the normalized υk values to represent the
com-pactness property for feature maps. With larger spatial vari-ance values, the feature map is supposed to be less compact. We calculate the compactness βk of the feature map Fk as
follows.
βk= 1/(eυk) (8)
where k represents the feature channel and k ∈
Based on spatial variance values of feature maps calculat-ed in Eq. (8), we fuse the feature maps for the final saliency map as follows. S =∑ k βk· Fk+ ∑ p̸=q βp· βq· Fp· Fq (9)
The first term in Eq. (9) represents the linear combina-tion of feature maps weighted by corresponding compactness; while the second term is adopted to enhance the common salient regions which can be detected by any two different feature maps. Different from existing studies using the con-stant weighting values for different images, the proposed fu-sion method assign different weighting values for different images based on their compactness property.
3. EXPERIMENTAL EVALUATION
In this section, we evaluate the performance of the proposed model based on the eye tracking database [28] proposed in the study [23]. To the best of our knowledge, this is the on-ly available eye tracking database for 3D images in the re-search community. The ground-truth maps in this database are represented as fixation density maps generated from the data recorded by a SMI RED 500 remote eye-tracker. This database includes various types of stereoscopic images such as outdoor scenes, indoor scenes, scenes including objects, scenes without any various object, etc. Some samples of the left images and corresponding ground-truth maps are shown in the first and last columns of Fig. 1, respectively.
In this experiment, we use the similar measure method-s amethod-s the method-study [23] to evaluate the performance of the pro-posed method. The performance of the propro-posed model is measured by comparing the ground-truth map and the salien-cy map from the saliensalien-cy detection model. As there are left and right images for any stereoscopic image pair, we use the saliency result of the left image to do the comparison, similar with the study[23]. The PLCC (Pearson Linear Correlation Coefficient), KLD (Kullback-Leibler Divergence), and AUC (Area Under the Receiver Operating Characteristics Curve) are used to evaluate the quantitative performance of the pro-posed stereoscopic saliency detection model. Among these measures, PLCC and KLD are calculated directly from the comparison between the fixation density map and the predict-ed saliency map, while AUC is computpredict-ed from the compari-son between the actual gaze points and the predicted saliency map. With larger PLCC and AUC values, the saliency detec-tion model can predict more accurate salient regions for 3D images. In contrast, the performance of the saliency detec-tion model is better with the smaller KLD value between the fixation map and saliency map.
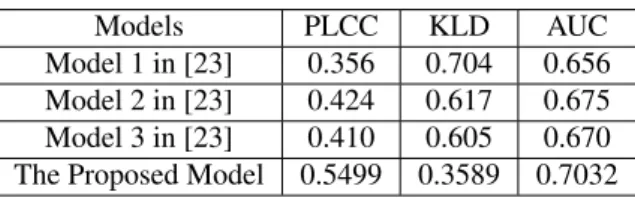
The quantitative comparison results are given in Table 1. In Table 1, Model 1 in [23] represents the fusion method from 2D saliency detection model in [1] and depth model in [23];
Table 1. Comparison results of PLCC, KLD and AUC values from different stereoscopic saliency detection models.
Models PLCC KLD AUC
Model 1 in [23] 0.356 0.704 0.656
Model 2 in [23] 0.424 0.617 0.675
Model 3 in [23] 0.410 0.605 0.670
The Proposed Model 0.5499 0.3589 0.7032
Model 2 in [23] represents the fusion method from 2D salien-cy detection model in [2] and depth model in [23]; Model 3 represents the fusion method from 2D saliency detection model in [3] and depth model in [23]. From this table, we can see that the PLCC and AUC values from the proposed mod-el is larger than those from modmod-els in [23], while KLD value from the proposed model is lower than those from models in [23]. This means that the proposed model can estimate more accurate saliency maps compared with other models in [23].
To better demonstrate the advantages of the proposed model, we provide some visual comparison samples from d-ifferent models in Fig. 1. From the second column of this figure, we can see that the stereoscopic saliency maps from the fusion model by combining Itti’s model [1] and depth saliency [23] mainly detect the contour of salient regions in images. The reason for this is that the 2D saliency detection model in [1] calculates saliency map mainly by local contrast. Similarly, there is the same drawback for the saliency maps from the third column of Fig. 1. For the saliency results from the fusion model by combing 2D saliency model in [2] and depth saliency in [23], some background regions are detected as salient regions in images, as shown in saliency maps from the fourth column of Fig. 1. In contrast, the saliency results from the proposed stereoscopic saliency detection model can estimate much more accurate salient regions with regard to the ground truth map from eye tracking data, as shown in Fig. 1.
4. DISCUSSION AND CONCLUSION
As demonstrated in the experimental part, the proposed model can obtain much better performance than other existing ones in saliency estimation for 3D images. The superior perfor-mance might be caused by top-down cue besides bottom-up mechanism. The ground-truth maps used in this study were collected based on the fixation data during 15 seconds, and they include the fixations resulting from both bottom-up and top-down mechanisms [27]. Since the proposed algorithm is a patch-based saliency detection method and it can detect the ROIs including the complete salient objects in 3D images (as shown in the experimental results), the top-down mechanis-m mechanis-might be included in the proposed mechanis-method. In contrast, the existing models in [23] which incorporate the 2D saliency methods [1, 2, 3] are designed for only bottom-up
mechanis-Fig. 1. Visual comparison of stereoscopic saliency detection models. Column 1: original left images; Columns 2 - 6: saliency maps by Model 1 in [23], Model 2 in [23], Model 3 in [23], the proposed model and the ground truth, respectively.
m. Therefore, the proposed method can obtain much better performance than the ones in [23] for saliency estimation of 3D images.
Overall, we propose a new stereoscopic saliency detec-tion model for 3D images in this study. The features of color, luminance, texture and depth are extracted from DCT coeffi-cients to represent the energy for small image patches. The saliency is estimated based on the energy contrast weight-ed by a Gaussian model of spatial distances between image patches for the consideration of both local and global con-trast. A new fusion method is designed to combine the fea-ture maps for the final saliency map. Experimental results show the promising performance of the proposed saliency de-tection model for stereoscopic images based on a recent eye tracking database.
5. ACKNOWLEDGE
This work has been partly conducted within the scope of the Merlion 2012 project (’REVAMP: Resourceful Exploration of Visual Attention for Media Processing’) and the PERSEE project which is financed by ANR (project reference: ANR-09-BLAN-0170).
6. REFERENCES
[1] L. Itti, C. Koch and E. Niebur. A model of saliency-based visual attention for rapid scene analysis. IEEE
Trans-actions on Pattern Analysis and Machine Intelligence,
20(11), 1254-1259, 1998.
[2] N. D. Bruce and J. K. Tsotsos. Saliency based on informa-tion maximizainforma-tion. Advances in Neural Informainforma-tion
Pro-cessing Systems, 18, 155-162, 2006.
[3] X. Hou and L. Zhang. Saliency Detection: A spec-tral residual approach. IEEE International Conference on
Computer Vision and Pattern Recognition, 2007.
[4] V. Gopalakrishnan, Y. Hu and D. Rajan. Salient Region Detection by Modeling Distributions of Color and Orien-tation. IEEE Transaction on Multimedia, 11(5): 892-905, 2009.
[5] Y. Fang, Z. Chen, W. Lin, C.-W. Lin. Saliency detection in the compressed domain for adaptive image retargeting.
IEEE Transactions on Image Processing, 21(9),
3888-3901, 2012.
[6] S. Goferman, L. Zelnik-Manor, and A. Tal. Context-aware saliency detection. IEEE International Conference
[7] Y. Fang, W. Lin, B.-S. Lee, C. T. Lau, Z. Chen, and C.-W. Lin. Bottom-Up Saliency detection model based on human visual sensitivity and amplitude spectrum. IEEE
Transactions on Multimedia, 14(1): 187-198, 2012.
[8] A. Torralba, A. Oliva, M. S. Castelhano and J. M. Hender-son. Contextual guidance of eye movements and attention in real-world scenes: the role of global features in object search. Psychological Review, 113(4), 766-786, 2006. [9] Y. Fang, W. Lin, C. T. Lau, and B.-S. Lee, A visual
at-tention model combining top-down and bottom-up mech-anisms for salient object detection. IEEE International
Conference on Acoustics, Speech, and Signal Processing
(ICASSP), 1293-1296, 2011.
[10] O. Le Meur, P. Le Callet, and D. Barba, A coherent com-putational Approach to model the bottom-up visual atten-tion, IEEE transactions on Pattern Analysis and Machine
Intelligence (PAMI), Vol.28(5), pp:802-817, 2006.
[11] Weisi Lin, and C.-C. Jay Kuo, Perceptual visual quality metrics: A survey. J. Visual Communication and Image
Representation 22(4): 297-312, 2011.
[12] C. Guo and L. Zhang. A novel multi-resolution spa-tiotemporal saliency detection model and its applications in image and video compression. IEEE Transactions on
Image Processing, 19(1), 185-198, 2010.
[13] A. Treisman and G. Gelade. A feature-integration theory of attention. Cognitive Psychology, 12(1), 97-136, 1980. [14] J. M. Wolfe, and T. S. Horowitz, What attributes guide
the deployment of visual attention and how do they do it?
Nature Review, Neuroscience, vol.5, pp. 495-501, 2004.
[15] F. Shao, G. Jiang, M. Yu, K. Chen, and Y.-S. Ho, Asym-metric coding of multi-view video plus depth based 3D video for view rendering, IEEE Transactions on
Multi-media, 14(1): 157-167, 2012.
[16] F. Shao, W. Lin, S. Gu, and G. Jiang, Thambipillai Srikanthan. Perceptual full-reference quality assessment of stereoscopic images by considering binocular visual characteristics, IEEE Transactions on Image Processing, 22(5): 1940-1953, 2013.
[17] Q. Huynh-Thu, M. Barkowsky, and P. Le Callet, The Importance of Visual Attention in Improving the 3D-TV Viewing Experience: Overview and New Perspec-tives, IEEE Transactions on Broadcasting, 57(2), 421-431, 2011.
[18] Y. Zhang, G. Jiang, M. Yu, and K. Chen, Stereoscopic visual attention model for 3d video, Advances in
Multi-media Modeling, 2010.
[19] C. Chamaret, S. Godeffroy, P. Lopez, and O. Le Meur, Adaptive 3d rendering based on region-of-interest, in
Proceedings of SPIE, vol.7524, 2010.
[20] N. Ouerhani and H. Hugli, Computing visual attention from scene depth, IEEE International Conference on
Pat-tern Recognition, 2000.
[21] E. Potapova, M. Zillich, and M. Vincze, Learning what matters: combining probabilistic models of 2d and 3d saliency cues, Computer Vision Systems, pp. 132-142, 2011.
[22] J. Wang, P. Le Callet, S. Tourancheau, V. Ricordel, and M. Perreira Da Silva, Study of depth bias of observer-s in free viewing of observer-still observer-stereoobserver-scopic observer-synthetic observer-stimuli,
Journal of Eye Movement Research, vol. 5(5):1, pp. 111,
2012.
[23] J. Wang, M. Perreira Da Silva, P. Le Callet, and V. Ri-cordel, Computational Model of Stereoscopic 3D Visual Saliency. IEEE Transactions on Image Processing, 22(6): 2151-2165, 2013.
[24] K. Rao, and P. Yip, Discrete Cosine Transform:
Al-gorithms, Advantages, Applications, Boston: Academic
Press, ISBN 0-12-580203-X, 1990.
[25] C. Theoharatos, V. K. Pothos, N. A. Laskaris, G. E-conomou, and S. Fotopoulos. Multivariate image simi-larity in the compressed domain using statistical graph matching. Pattern Recognition, vol. 39, pp. 1892-1904. 2006.
[26] B. A. Wandell. Foundations of Vision. Sinauer Asso-ciates, 1995.
[27] J. Wang, D. M. Chandler, and P. L. Callet, Quantifying the relationship between visual salience and visual im-portance, SPIE Proceedings, vol. 7527. SPIE, 2010, p. 75270.
[28] J. Wang, M. Perreira Da Silva, P. Le Callet, and V. Ricordel, IRCCyN/IVC 3DGaze database,
http://www.irccyn.ec-nantes.fr/spip.php?article1102 &lang=en, 2011.
![Fig. 1. Visual comparison of stereoscopic saliency detection models. Column 1: original left images; Columns 2 - 6: saliency maps by Model 1 in [23], Model 2 in [23], Model 3 in [23], the proposed model and the ground truth, respectively.](https://thumb-eu.123doks.com/thumbv2/123doknet/7921554.265311/6.892.87.833.106.514/comparison-stereoscopic-saliency-detection-original-columns-saliency-respectively.webp)
