HAL Id: hal-01346010
https://hal.sorbonne-universite.fr/hal-01346010
Submitted on 18 Jul 2016
HAL is a multi-disciplinary open access
archive for the deposit and dissemination of
sci-entific research documents, whether they are
pub-lished or not. The documents may come from
teaching and research institutions in France or
abroad, or from public or private research centers.
L’archive ouverte pluridisciplinaire HAL, est
destinée au dépôt et à la diffusion de documents
scientifiques de niveau recherche, publiés ou non,
émanant des établissements d’enseignement et de
recherche français ou étrangers, des laboratoires
publics ou privés.
Gadolinium oxysulfide nanoprobes with both persistent
luminescent and magnetic properties for multimodal
imaging
C. Rosticher, Bruno Viana, M.-A. Fortin, J. Lagueux, L. Faucher, Corinne
Chanéac
To cite this version:
C. Rosticher, Bruno Viana, M.-A. Fortin, J. Lagueux, L. Faucher, et al.. Gadolinium oxysulfide
nanoprobes with both persistent luminescent and magnetic properties for multimodal imaging . RSC
Advances, Royal Society of Chemistry, 2016, 6 (60), pp.55472-55478. �10.1039/C6RA05030A�.
�hal-01346010�
ARTICLE
J. Name., 2013, 00, 1-3 | 1
a.
Sorbonne Universités, UPMC Univ Paris 06, CNRS, Collège de France, Laboratoire de Chimie de la Matière Condensée de Paris, 11 place Marcelin Berthelot, 75005 Paris, France. * corinne.chaneac@upmc.fr
b.PSL Research University, Chimie ParisTech - CNRS, Institut de Recherche de Chimie
Paris, 11 rue Pierre et Marie Curie, 75005 Paris, France. * bruno.viana@chimie-paristech.fr
c.
Centre de recherche du centre hospitalier universitaire de Québec (CR-CHUQ), axe Médecine régénératrice, Québec QC, G1L 3L5, Canada.
d.Centre de recherche sur les matériaux avancés (CERMA), Université Laval,
Québec QC, G1V 0A6, Canada.
e. Centre de recherche du Centre hospitalier universitaire de Québec (CR-CHUQ), axe
Oncologie, Québec QC, G1L 3L5, Canada.
DOI: 10.1039/x0xx00000x Received 00th January 20xx, Accepted 00th January 20xx DOI: 10.1039/x0xx00000x
www.rsc.org/
Gadolinium oxysulfide nanoprobes with both persistent
luminescent and magnetic properties for multimodal imaging
C. Rostichera, B. Vianab*, M.-A. Fortinc,d,e, J. Lagueuxe and L. Faucherc,d,e , C. Chanéaca*
Persistent luminescence and magnetic properties of Gd2O2S: Eu3+, Ti4+, Mg2+ nanoparticles have been studied to attest the
relevance of such nanoparticles as nanoprobes for multimodal imaging. The development of new imaging tools is required to improve the quality of medical images and then to diagnose some disorders as quickly as possible in order to ensure more effective treatment. Multimodal imaging agents here developed combine the high resolution abilities of Magnetic Resonance Imaging (MRI) with another more sensitive technique, like optical imaging, leading significant possibilities for early detection of diseases and a better understanding of pathologies. Recently, inorganic persistent luminescent nanoparticles (i-PLNPs) have been reported as suitable probes for in vivo imaging that meet the difficulties due to the biological environment. The i-PLNPs are first excited by a UV light for a few minutes outside the animal before injection and emit in the border of the red/NIR window for hours after the injection. In this paper, we explore a new chemical composition of host lattice doped with transition metal and lanthanide ions for persistent luminescence that contains a paramagnetic centre conferring additional magnetic properties for a use in MRI, and that can be obtained at the nanoscale. Thus, advanced Gd2O2S nanoparticles exhibiting both persistent luminescence and paramagnetic properties
have been synthesized and fully characterized. Their luminescent properties were determined as well as their magnetic properties. One compound sample with composition Gd2O2S: Eu3+ (5%), Ti4+ (1%), Mg2+ (8%) presents both optical and
magnetic properties suitable for a bimodal imaging probe. Indeed, it shows an afterglow in the red range at 620 nm and a relaxivity corresponding to r2 / r1 ratio of 1.28.
Introduction
In the field of medical imaging, the development of new imaging tools is a challenging task to obtain more reliable and early diagnosis. There are many categories of in vivo imaging techniques, using different electromagnetic radiations, and each one shows some advantages and limits. Combining imaging techniques gives the opportunity to improve the diagnoses by generating more accurate images 1-6. MRI is a non-invasive and widely used imaging technique that produces excellent soft tissue diagnosis and spatial resolution. However, for an imaging modality to be optimum, a high sensitivity is also needed, and MRI shows poor sensitivity. In contrast, optical imaging presents an exquisite sensitivity but has limited spatial resolution. The most attractive combinations are then
made of a highly resolved modality (MRI) and a complementary highly sensitive one (optical imaging or PET). Therefore, multimodal imaging probes are also required to combine the advantages of several techniques and overcome their limits. The development of such sophisticated imaging agents has greatly increased the ability to diagnose diseases and provide image guided therapy or track efficacy of treatments 7-9.
In literature, MRI contrast agents have been already coupled with fluorescent molecules to create multimodal imaging probes 10-13 but these fluorescent agents are not very stable and the optical imaging by fluorescence of biological tissue is hampered by absorbance of incident and emitted light 14 and tissue’s autofluorescence 15. These two phenomena reduce the detection limits and restrict the depth of photons penetration into tissues 15. Using persistent luminescent probes open the path to enhanced signal-to-noise ratio 16,17 and the possible imaging of deep organs by removing absorption and autofluorescence phenomena 16,17. Indeed new long luminescent nanoparticles that emit in the red-near infrared range inside the biological tissue wavelength therapeutic window (600-1350 nm) were recently proposed for in vivo imaging 16-23 as these i-PLNPs avoid tissue’s absorption and prevent tissue’s autofluorescence since they are excited before the injection or by long wavelengths. Silicates nanoparticles, including doped silicates (CaMgSi2O6 doped
ARTICLE Journal Name
2 | J. Name., 2012, 00, 1-3
Eu2+, Mn2+, Dy3+ or Pr3+), gallates (ZnGa2O4: Cr3+) and others were reported 17-29. In order to obtain a bimodal agent for magnetic resonance and optical imaging, gadolinium oxysulfide nanoparticles, Gd2O2S, doped Eu3+, Ti4+ and Mg2+ were developed within this work. Indeed, gadolinium compounds are well-known to improve the T1-weighted contrast in the same way as T2 Fe2O3 based contrast agents 30-32
. Both gadolinium compounds and iron oxide achieve highly sensitive MRI and can be used selectively as white and black dual label to detect two cell types simultaneously at any tissue depth 33. In addition, gadolinium oxysulfide is also well known to be a good matrix for rare earth (RE) emission. Eu3+ doped Gd2O2S nanoparticles exhibit a strong emission band centred at 624 nm after excitation at 363 nm usual for in vitro fluorescence microscopy, whereas Gd2O2S: Er,Yb compounds are applicable for deep in vivo fluorescence imaging since both excitation (980 nm) and emission (670 nm) are located inside the “transparency window” of biological tissues 34. Persistent luminescence properties require codoping of the matrix. Zhang
et al. proved that Gd2O2S codoping Er3+, Ti4+ in bulk materials also allows to obtain a long luminescence time compared to Er3+ single doping 35. The first long afterglow oxysulfide was produced with the matrix Y2O2S doped Eu3+, Ti4+, Mg2+, whose luminescence time in the red could reach 3 hours 36. At present, no persistent luminescent nanoprobes based on Gd2O2S matrix have been reported in the literature. However, several rare earth (RE = Eu, Sm, Dy, Ho, Er and Tm) cations were proposed in Gd2O2S solid state compounds with Ti4+, Mg2+ as codoping to be relevant to obtain afterglow 37,38. Here the focus will be on the nanoparticles preparation and, as in
vivo imaging application required red/ near infrared persistent
luminescence detected by the silicon detector, we focused our attention on Gd2O2S: Eu3+, Ti4+, Mg2+ compounds, trivalent europium being the recombination center with intensive emission in the red.
Despite these effective MRI contrast enhancements, the use of gadolinium compounds as MRI agent is still controversial and less popular than iron oxides, generally known to be biocompatible, because of their potential toxicity 39. It has been shown that the release of Gd3+ ions inside organs causes toxic effect such as nephrogenic systemic fibrosis (NSF) 40. Nevertheless, several studies have shown that the control of the size of gadolinium oxide nanoparticles can significantly reduce the risk of release of Gd3+ ions 41 as well as the encapsulation of the magnetic core by a biocompatible shell 42. For example, using small size (< 5 nm), the fast excretion of nanoparticles via a renal clearance minimizes its toxicity. Such “safe by design” approach is especially required for the development of gadolinium based probes for imaging. In the case of gadolinium oxysulfide, toxic issue is reduced compared to oxide due to the lower solubility 34 opening new opportunities for such compounds.
In this paper, the development of persistent luminescent and paramagnetic Gd2O2S nanoparticles as multimodal imaging agents used in MRI and optical imaging is described. Imaging
abilities are explored alone and successively. In order to obtain nanoprobes, a hydrothermal synthesis using a chemical sulfurated agent was used, therefore allowing a fast and secure synthesis. Indeed, most of the Gd2O2S nanoparticles syntheses using hydrothermal route require an annealing step under inert (Ar or N2)/CS2/sulfur/carbon atmosphere at high temperature for the sulfuration of oxide matrix 43, 44. Using a sulfured flow to anneal the materials is quite dangerous and difficult to use safely in a laboratory. Therefore, we propose to synthesize Gd2O2S nanoparticles using a three-steps hydrothermal route. In the second step, thioacetamide, a chemical sulfured agent is added to the solution that decomposes during heating following the reaction: (CH3)CS(NH2) + 2 H2O → CH3COO- + NH4+ + H2S. This way, the synthesis is safer and faster. These nanosensors can act as multimodal agents for possible in vivo optical imaging and MRI imaging.
Experimental
Synthesis
In a typical synthesis, 0.9 mM of Gd(NO3)3.6H2O were dissolved in 16 ml of deionized water to form a clear solution with precursors EuCl3.6H2O, Mg(NO3)2.6H2O and TiCl4. The pH of the solution was adjusted to 8 by adding NaOH solution under vigorous stirring. The mixture was stirred and heated at 70°C for 2 hours. A white precipitate is obtained, corresponding mainly to Gd(OH)3 phase. An excess of thioacetamide was added to the mixture and then transferred to a Teflon lined stainless steel autoclave and heated at 200°C for 2 hours. A yellowish precipitate was collected, purified, and dried in air at ambient temperature. At this moment, the sulfuration process is not subsequent and an annealing step is needed. Therefore, in order to convert all the product to the formation of Eu3+, Ti4+, Mg2+ - doped gadolinium oxysulfide, the collected powder is heated at 700°C for 2h under inert (Ar) atmosphere.
In the aim of improving the persistent luminescence, we vary the doping ratio of the samples: Eu3+ (2.5% or 5% ), Ti4+ (1 to 4%) and Mg2+ (2 to 8 %).
Materials and methods
As obtained solids were analyzed by powder X-ray diffraction (PW-XRD) using a Bruker D8 Advance diffractometer using Cu-K radiation ( = 1.5418Å) at 45 kV and 40 mA, 0.0046°2step size and 0.5s step time over a range of 10 to 80° - 2. Fourier-Transform Infra-Red (FT-IR) spectroscopy has been operated on a Perkin Elmer 400 spectrometer using the universal ATR sampling holder. Transmission Electron Microscopy (TEM) images were acquired with a FEI Tecnai 120 Twin microscope operating at 120 kV and equipped with a high resolution Gatan Orius CCD 4 k 64 k numeric camera. Excitation and emission spectra were measured with a Varian Cary Eclipse Fluorescence spectrophotometer at room temperature. Persistent luminescence spectra were recorded after 2 minutes irradiation with UV light (365 nm-6 W) and the resulting signal was collected via an optical fiber by Roper
Journal Name ARTICLE
J. Name., 2013, 00, 1-3 | 3
Scientific Pixis 100 CCD camera cooled at -68°C coupled with an Acton SpectraPro 2150i spectrometer for spectral analysis. Thermoluminescence (TL) measurements were performed with a Ris TL/OSL reader model TL/OSL-DA-15A/B with an EMI 9635QA PM tube. TL glow curves were measured at heating rate of 5°C/s. TL emission spectra were measured using an UV-VIS spectrometer (Avantes, PC2000). For the emission spectra measurements the samples were irradiated with 340 nm UV light for 2 minutes.
The relaxometric properties of the suspensions of magnetic nanoparticles were studied by relaxometric and MRI analysis. For this, the dried particles (30 mg) were dispersed in 10 mL of nanopure water (18.2 MΩ∙cm), followed by vortexing (30 sec) and sonication (30 min). To eliminate agglomerates, all suspensions were centrifuged (3000 g, 15 min). From this suspension, 1.5 mL of sample was extracted for relaxometric experiments (T1 and T2 measurements) and MRI analysis.
Relaxometric analysis: 400 L dilutions (100, 90, 80, 70, 50 % v/v) of the previous suspension in pure water were distributed in 6.0 mm NMR tubes. Longitudinal and transversal relaxation times (T1 and T2) were measured with a dedicated TD-NMR relaxometer (Bruker Minispec 60 MHz, 37°C). The relaxation rates (1/T1 and 1/T2) were then plotted against Gd concentration values, and relaxivities (r1 and r2) were calculated from the slope of the graphs. To quantify the concentration of Gd in each suspension, the 100% and 50 % v/v samples were digested in nitric acid and hydrogen peroxide, and analyzed in ICP-MS.
MRI analysis: Dilutions of the samples were imaged with a 1 T
small-animal MRI system (M2M, Aspect Imaging, Netanya, Israel) using T1-weighted spin-echo sequences (repetition time: 400 ms; echo time: 10.8 ms; dwell time: 16; matrix: 200 × 200; slice thickness: 1.9 mm; interslice: 0.1 mm; field of view: 70 mm; 3 excitations; 25°C). The suspensions were stable in time according to MRI measurements (for a few days), even after centrifugation.
Results and discussion
Structure and morphology of Gd2O2S: Eu3+, Ti4+, Mg2+
nanostructures
Main characterizations reported in this paper correspond to Gd2O2S doped with Eu3+ (5%), Ti4+ (1%), Mg2+ (2%). FTIR spectrum shows an important absorption around 3500 and 1500 cm-1 which corresponds to the presence of hydroxyl groups (Fig. 1a). Gd2O2S: Eu3+, Ti4+, Mg2+ products showed pronouncing features in the range 1700–600cm-1. The intense absorption peak at 600 cm-1 may be attributed to (Gd/Eu–O) and (Gd–S) groups. Absorption bands at 1400 and 1100 cm-1 may indicate the presence of (C–O) and (S–O) modes respectively 43, 44.
The purity and crystallinity of the products were examined using powder XRD. PW-XRD patterns obtained from the Gd2O2S: Eu3+, Ti4+, Mg2+ products are shown in Fig. 1b. All peaks can be indexed as the pure hexagonal Gd2O2S phase and
Fig. 1 (a) FTIR spectrum and (b) XRD pattern of Eu3+, Ti4+, Mg2+ doped Gd2O2S compound after 2h annealing at 700°C under argon.
they are in good agreement with standard Gd2O2S data ([P3m1, 164], JCPDS # 27-1422; lattice constant: a=b= 3.784 Å, c= 6.589 Å). Zhang et al. showed that the insertion of doping elements such as Eu3+, Ti4+ or Er3+, in a gadolinium oxysulfide does not perturb the crystalline structure of the matrix in the long range 35. Particles size and crystalline structure observed by XRD are not modified by the presence of doping elements in the oxysulfide matrix.
The morphology of Gd2O2S: Eu3+, Ti4+, Mg2+ nanoparticles greatly depends on the pH during the hydrothermal synthesis 43,44
. At pH=8, most of the obtained nanoparticles exhibit a facetted shape (Fig. 2a) with smaller spherical nanoparticles (Fig. 2.b) with size below 20 nm. Shaped nanoparticles diameter is between 50 and 100 nm. In good agreement with Ref. 44, such morphologies were favoured by the pH= 8 value
Fig. 2 TEM images of Eu3+, Ti4+, Mg2+ doped Gd
2O2S nanoparticles after 2h annealing at 700°C under argon.Scale bars are 20 nm.
(a)
(b)
4000 3500 3000 2500 2000 1500 1000 500 % Tra n s m it ta n c e Wavenumber (cm-1)(a)
(b)
ARTICLE Journal Name
4 | J. Name., 2012, 00, 1-3
chosen for the synthesis. These morphologies and sizes well below 100 nm are well adapted to in vivo application.
The main synthesis step that influences the size of the nanoparticles is the thermal treatment under argon. In order to study the effect of the annealing treatment on the particle size, the heating time and temperature were varied. Compounds obtained after the second step of hydrothermal synthesis were annealed from 700 to 1100°C for 2 or 4 hours. The main objective was to determine the most efficient thermal treatment in terms of crystallinity, purity, size and luminescence. TEM images of the annealed samples are shown in Fig. 3. The particles size increases with the annealing temperature from 50 nm to 100 nm for temperatures comprised between 700 and 1100°C respectively. The sintering becomes more and more important with the increase of annealing time and temperature. Therefore, for a temperature of 1100°C, bigger nanoparticles and many aggregates are obtained because of the sintering effect (Fig. 3e-j). The aggregates are more abundant for thermal treatments of 4 hours. For in vivo applications, small nanoparticles are needed and aggregates have to be avoided at the most. Therefore the most efficient annealing treatment for gadolinium oxysulfide in terms of size, crystallinity and dispersity is a treatment at 700°C, for 2h under argon. Spherical and facetted nanoparticles with a diameter ranging between 50-80 nm were then obtained as seen in Fig. 3.
Emission
Fig. 4 represents the emission and excitation spectra of Eu3+, Ti4+, Mg2+ doped Gd2O2S nanoparticles (annealed at 700°C under argon for 2h) recorded at room temperature after 100
s delay. The emission spectrum (Fig. 4b) under excitation at 325 nm shows emission bands peaking between 580 nm and 720 nm, attributed to Eu3+ emission. The peaks located at 584 nm, 595 nm, 618 nm, and 715 nm correspond to the well known 5D0 7Fj radiative transitions of Eu3+. Because of the 100us delay, no emission could be observed form the 5D1 or 5
D2 levels.
This reveals that Eu3+ ions are indeed the luminescent centers in the Eu3+, Ti4+, Mg2+ doped Gd2O2S compound. The excitation spectrum (Fig. 4a) for an emission at 618 nm consists of two intensive bands peaking at 330 nm and 227-250 nm corresponding to the charge transfer from S2- to Eu3+ and to the host Gd2O2S absorption respectively 45,46. In addition the peaks at 395 nm are characteristic of the Eu3+ 4f-4f transitions. It can be noticed that the excitation spectrum of gadolinium oxysulfides as observed Fig. 4a is closer to the one of oxides reported in the literature than sulfides. This may be linked to the direct environment of cations in oxysulfides composed of 4 oxygen atoms and 3 sulfur atoms with oxygen much closer to gadolinium than sulfur. Then, the energy levels of trivalent rare earth cations in Gd2O2S energy diagram as reported in Ref 47
is more similar to oxide host rather than sulfide matrix.
Fig. 3 TEM images of Eu3+, Ti4+, Mg2+ doped Gd2O2S nanoparticles depending on annealing treatment under argon: (a) 700°C-2h ; (b) 800°C-2h ; (c) 900°C-2h ; (d) 2h ; (e) 1100°C-2h ; (f) 700°C-4h ; (g) 800°C-4h ; (h) 900°C-4h ; (i) 1000°C-4h ; (j) 1100°C-1000°C-4h. All scale bars are 100 nm.
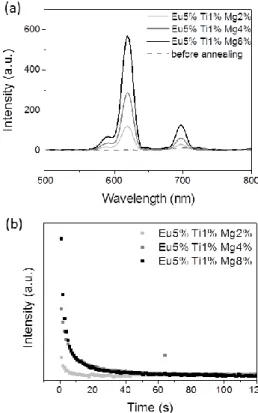
Persistent luminescence properties
Fig. 5 shows the evolution of the persistent luminescence recorded at room temperature depending on Mg2+ doping ratio in Gd2O2S doped Eu3+, Ti4+, Mg2+ after switching off the UV source at room temperature, before and after annealing treatment at 700°C under argon for 2h, and UV excitation (at 340 nm for 2 min). In addition one should indicate that the non-annealed sample shows no persistent luminescence. The sulfuration step which takes place during the annealing treatment at high temperature is therefore compulsory to allow persistent luminescence. During this thermal treatment, anionic vacancies could be created such as S2- vacancies (see after the TSL glow curves), that can explain the necessity of the thermal treatment as these vacancies have a key role in the persistent luminescence mechanism. After annealing, the persistent luminescence spectra of Gd2O2S: Eu3+ (5%), Ti4+ (1%), Mg2+ (x%) exhibit the usual three emission bands at 585 nm, 620 nm and 705 nm which indicate that trivalent europium is the recombination center. These emission bands are attributed to the radiative 5D0 7Fj transitions of Eu3+. The
(A) (B) (C) (D) (E) (F) (G) (H) (I) (J) 50 nm 2h 4h 700°C 800°C 900°C 1000°C 1100°C (a) (b) (c) (f) (g) (h) (d) (i) (j) (e)
Journal Name ARTICLE
J. Name., 2013, 00, 1-3 | 5
most intense centred at 620 nm, corresponds to 5D0 7F2 transition.
Fig. 4 (a) Excitation of the 618 nm emission and (b) emission spectrum under 325 nm excitation of Gd2O2S: Eu5%, Ti1%, Mg8% nanoparticles at room temperature after 100
s time delay.
Increasing Mg2+ doping ratio has an important effect on persistent luminescence in Gd2O2S doped Eu
3+
, Ti4+, Mg2+. Therefore higher is Mg2+ doping ratio, more intense is the persistent luminescence in agreement with the stoichiometry of the compounds, divalent magnesium required charge compensation that can be done by sulfur vacancies and increased the TSL signal presented in the following part of the paper. This indicates the major role of the divalent magnesium in the persistent luminescence mechanism, creating intermediate traps levels in the bandgap of the material. Such traps creation, is an important step to enhance the persistent luminescence.
Decay curves were recorded during 2 minutes few seconds after switching off the UV excitation (Fig. 5b). Their non-exponential profiles show that several types of traps are present within Gd2O2S: Eu3+, Ti4+, Mg2+ compounds. Again decrease of persistent luminescence intensity is noted when Mg2+ doping ratio decreases. The optimal doping ratio for Gd2O2S doped Eu3+, Ti4+, Mg2+ compounds was determined to be Eu3+ (5%), Ti4+ (1%), Mg2+ (8%).
The thermoluminescence curve of Gd2O2S: Eu3+ (5%), Ti4+ (1%), Mg2+ (8%) is displayed in Fig. 6. The sample was heated up to 400°C prior excitation to empty all the charges traps. Then it
was excited under UV light for 2 minutes. The emission spectrum is recorded after switching off the excitation while heating the sample up to 300°C by a 5°C/sec step. This heating step empties the charges traps filled during the excitation step.
Fig. 5 (a) Persistent luminescence spectra of Gd2O2S: Eu5%, Ti1%, Mgx% compounds –
exc = 365 nm – excitation time = 2 min. Spectra recorded few seconds after the end of the excitation. (b) Luminescence decay curves depending on Mg ratio for Gd2O2S: Eu5%, Ti1%, Mgx% compounds – exc = 365 nm – excitation time = 2 min.
One strong peak is observed between 30 and 125°C with a maximum at 55°C.
The trap depth E with respect to the conduction band edge can be roughly estimated by the simple expression E ≈ 0.002TM
48 , where TM is the temperature of the peak maximum. Experimental value of trap depth was found to be 0.65 eV. This value is coherent with literature data 37,38. This indicates that these shallow traps are at the origin of the persistent luminescence and the shape of the glow curve observed in Fig. 6 also indicates that there are no deeper traps in the sample. In oxysulfide matrix, there are possibly three types of traps-defects: isoelectronic traps due to Eu3+, charges traps resulting of the substitution of nonequivalent ions (Mg2+, Ti4+) and anionic vacancies (such as S2-, and possibly also O2-). Trivalent europium is the recombination center and can also act as electron trap in the Gd2O2S matrix (Eu3+ + e- Eu2+*). Titanium (IV) could also be an electron trap (Ti4+ + e- Ti3+*). The role of the divalent magnesium can be to favour the stoichiometry variation as divalent cation replaces a trivalent one with a charge compensation, which in turns favours anionic vacancies. Furthermore Mg2+ doping induces the formation of intermediate energy levels, allowing important
500 550 600 650 700 750 0 200 400 600 800 1000 Int en sity (a. u.) Wavelength (nm) 200 250 300 350 400 0 100 200 300 400 (nm) in tensi té (ua )
(A)
(B)
500 550 600 650 700 750 0 200 400 600 800 1000 Int en sity (a.u. ) (nm) Wavelength(a)
500 550 600 650 700 750 0 200 400 600 800 1000 Int en sity (a. u.) Wavelength (nm) 200 250 300 350 400 0 100 200 300 400 (nm) in tensi té (ua )(A)
(B)
500 550 600 650 700 750 0 200 400 600 800 1000 Int en sity (a.u. ) (nm) Wavelength(b)
ARTICLE Journal Name
6 | J. Name., 2012, 00, 1-3
energy storage inside the matrix and thus longer decay 36. Finally anionic vacancies such as S2-, and possibly also O2- are also well known electron traps 49. Distances between gadolinium cations and sulfur or oxygen anions in the matrix are dGd-S = 2.852 Å and dGd-O = 2.329 Å / 2.399 Å respectively. Thus sulfur vacancies should be easier to form as Gd-S distances are larger in comparison to the Gd-O ones. However, even knowing the role of each ion in the persistent luminescence mechanism, one cannot fully conclude which traps (Eu3+, Ti4+ or anionic vacancies S2- and O2-) are responsible for the peak observed in TSL glow curve (Fig. 6) in the Gd2O2S: Eu3+, Ti4+, Mg2+ compounds.
Fig. 6 TSL glow curve of Gd2O2S: Eu5%, Ti1%, Mg8% nanoparticles. (rise temperature of 5°C/s)
Relaxometry and magnetic properties (MRI)
Longitudinal and transversal relaxation times (T1 and T2) of diluted suspensions of Gd2O2S: Eu3+ (5%), Ti4+ (1%), Mg2+ (8%) were measured with a dedicated TD-NMR relaxometer. Then, these suspensions were imaged with a 1T small-animal MRI system. Fig. 7 shows the longitudinal and transversal relaxation curves of diluted suspensions of Gd2O2S: Eu3+ (5%), Ti4+ (1%), Mg2+ (8%) recorded at 37°C. In vitro results show that doped Gd2O2S nanoparticles present a longitudinal relaxivity of 6.7 mM-1s-1, which is close to the reported values for Gd2O3 nanoparticles of similar size 30-31,50-51. The relaxometric ratio (r2/r1), which indicates the capacity of the contrast agent to provide “positive” contrast in T1-weighted imaging (close to 1), or “negative” contrast, in T2-weighted imaging (typically higher than 2), is 1.28. This clearly indicates the capacity of Gd2O2S: Eu3+ (5%), Ti4+ (1%), Mg2+ (8%) to provide strong “positive” contrast enhancement in T1-w. imaging. The strong T1 effect on signal was confirmed on MRI coronal images (Fig. 7b). The signal from 1H protons in the vicinity of a “positive” contrast agent is usually greatly enhanced using short echo times and spin echo T1-weighted sequences (as in Fig. 7b). Although more refined relaxometric characterization would be necessary, and in particular NMRD (nuclear magnetic relaxation dispersion) profiles, to confirm the exact mechanism of relaxivity, it is clear that a strong exchange occurs between H2O protons and surface paramagnetic ions. As reflected by the moderate T2 values, the nanoparticles are clearly paramagnetic, without evidence of
superparamagnetism that would have lead to much higher r2 values.
Fig. 7 (a) 1H relaxation rates measured with Gd
2O2S: Eu5%, Ti1%, Mg8% aqueous suspensions. (b) Resulting MR-images (1.5 T, 21°C; T1-weighted fast spin-echo; TR, 400
ms; TE, 10.8 ms).
Conclusions
Gd2O2S doped Eu3+, Ti4+, Mg2+ nanoparticles were prepared using a three-steps hydrothermal synthesis. Nanoparticles morphology and size were controlled by pH and annealing treatment. In the aim of improving the red-near infrared persistent luminescence at about 620 nm, different doping ratios were studied. We obtained an optimal composition with larger magnesium content: Gd2O2S doped Eu3+ (5%), Ti4+ (1%), Mg2+ (8%). In that case persistent luminescence can be observed within several minutes for the first time in the gadolinium oxysulfide nanoparticles. Relaxometric and magnetic resonance imaging properties were investigated, and Gd2O2S: Eu3+ (5%), Ti4+ (1%), Mg2+ (8%) showed a high T1 effect with a relaxation ratio of 1.28. This compound proved to be a promising positive contrast agent. Then Gd2O2S doped Eu3+ (5%), Ti4+ (1%), Mg2+ (8%) nanoparticles combine optical imaging agent with persistent luminescence properties and a good MRI contrast agent because of its relaxation properties.
In vivo study of the bimodal properties will be the next
research step for this compound.
Acknowledgements
We thank Patrick Le Griel for his help during TEM experiments and Adrie Bos from Delft University of Technology for TSL experiments. This work was supported by the French Research National Agency (ANR) in the frame of its program in Nanosciences and Nanotechnologies (Natlurim project n°ANR-08-NANO-025). [Gd] (10-4mM) 0.041 0.037 0.033 0.029
(a)
(b)
1/T1= 6,6731 [Gd] + 0,3516 1/T2= 8,7972 [Gd] + 0,504 0,3 0,4 0,5 0,6 0,7 0,8 0,9 1 0,01 0,02 0,03 0,04 0,05 1 /T 1 , 1 /T 2 (s -1) Concentration Gd (mM) 1/T1= 9,8889 [Gd] + 0,2529 1/T2= 11,856 [Gd] + 0,2987 0,3 0,4 0,5 0,6 0,7 0,8 0,9 1,0 0,01 0,02 0,03 0,04 0,05 1 /T 1 , 1 /T 2 (s -1) Concentration Gd (mM)(A)
(B)
1/T 2= 8.79 [Gd] + 0.05 1/T1= 6.67 [Gd] + 0.35Journal Name ARTICLE
J. Name., 2013, 00, 1-3 | 7
References
1 T. Skajaa, D. P. Cormode, E. Falk, W. J. M. Mulder, E. Fisher and Z. A. Fayad, Arterioscler. Thromb, Vasc. Biol., 2010, 30, 169.
2 J. Yang, E. K. Lim, H. J. Lee, J. Park, S. C. Lee, K. Lee, H. G. Yoon, J. S. Suh, Y. M. Huh and S. Haam, Biomaterials, 2008,
29, 2548.
3 W. J. M. Mulder, G. J. Strijkers, G. A. F. van Tilborg, D. P. Cormode, Z. A. Fayad and K. Nicolay, Acc. Chem. Res., 2009,
42, 904.
4 J. Kim, Y. Piao and T. Hyeon, Chem. Soc. Rev., 2009, 38, 372. 5 W. J. M. Mulder, D. P. Cormode, S. Hak, M. E. Lobatto, S.
Silvera and Z. A. Fayad, Nat. Clin. Pract. Cardiovasc. Med., 2008, 5, S103.
6 M. M. Hüber, A. B. Staubli, K. Kustedjo, M. H. B. Gray, J. Shih, S. E. Fraser, R. E. Jacobs and T. J. Meade, Bioconjugate
Chem., 1998, 9, 242.
7 K. Y. Choi, G. Liu, S. Lee and X. Chen, Nanoscale, 2012, 4, 330. 8 J. V. Jokerst and S. S. Gambhir, Acc. Chem. Res., 2011, 44,
1050.
9 T. Maldiney, B. T. Doan, D. Alloyeau, M. Bessodes, D. Scherman and C. Richard, Adv. Funct. Mater., 2015, 25, 331. 10 B. Brooksby, B. W. Pogue, S. Jiang, H. Dehghani, S. Srinivasan,
C. Kogel, T. D. Tosteson, J. Weaver, S. P. Poplack and K. D. Paulsen, Proc. Natl. Acad. Sci. USA., 2006, 103, 8828. 11 Y. Koyama, V. S. Talanov, M. Bernardo, Y. Hama, C. A. S.
Regino, M. W. Brechbiel, P. L. Choyke and H. J. Kobayashi,
Magn. Reson. Imaging, 2007, 25, 866.
12 A. Bumb, C. A. Regino, M. R. Perkins, M. Bernardo, M. Ogawa, L. Fugger, P. L. Choyke, P. J. Dobson and M. W. Brechbiel, Nanotechnology, 2010, 21, 175704.
13 W. J. M. Mulder, G. J. Strijkers, R. Koole, C. D. M. Donega, G. Storm, A. W. Griffioen and K. Nicolay, Bimodal Liposomes and Paramagnetic QD-Micelles for Multimodality Molecular Imaging of Tumor Angiogenesis in Nanoparticles in Biomedical Imaging; Springer: New York, 2007.
14 W. F. Cheong, S.A. Prahl and A.J. Welch, IEEE J. Quantum
Electron., 1990, 26, 2166.
15 J. V. Frangioni, Curr. Opin. Chem. Biol., 2003, 7, 626.
16 T. Maldiney, A. Bessière, J. Seguin, E. Teston, S. K. Sharma, B. Viana, A. J. J. Bos, P. Dorenbos, M. Bessodes, D. Gourier, D. Scherman and C. Richard, Nat. Mater., 2014, 13, 418. 17 Q. Le Masne De Chermont, C. Chanéac, J. Seguin, F. Pellé, S.
Maitrejean, J. P. Jolivet, D. Gourier, M. Bessodes and D. Scherman, Proc. Natl. Acad. Sci. USA, 2007, 104, 9266. 18 T. Maldiney, G. Sraiki, B. Viana, D. Gourier, C. Richard, D.
Scherman, M. Bessodes, K. Van den Eeckhout, D. Poelman and P. F. Smet, Opt. Mater. Express, 2012, 2, 261.
19 Y. Li, S. Zhou, G. Dong, M. Peng, L. Wondraczek and J. Qiu,
Sci. Rep., 2014, 4, 4059.
20 X. Fu, C. Liu, J. Shi, H. Man, J. Xu and H. Zhang, Opt. Mater., 2014, 36, 1792.
21 F. Liu, W. Yan, Y.-J. Chuang, Z. Zhen, J. Xie and Z. Pan, Sci.
Rep., 2013, 3, 1554.
22 Z. Li, J. Shi, H. Zhang and M. Sun, Opt. Express, 2014, 22, 10509.
23 B. Viana, S. K. Sharma, D. Gourier, T. Maldiney, E. Teston, D. Scherman and C. Richard, J. Lumin., 2016, 170, 879.
24 A. Lecointre, B. Viana, Q. LeMasne, A. Bessiere, C. Chaneac and D. Gourier, J. Lumin., 2009, 129, 1527.
25 A. Lecointre, A. Bessiere, B. Viana and D. Gourier, Radiat.
Meas., 2010, 45, 497.
26 T. Maldiney, A. Lecointre, B. Viana, A. Bessiere, M. Bessodes, D. Gourier, C. Richard and D. Scherman, J. Am. Chem. Soc., 2011, 133, 11810.
27 A. Bessiere, S. K. Sharma, N. Basavaraju, K. Priolkar, L. Binet, B. Viana, A. Bos, T. Maldiney, C. Richard, D. Scherman and D. Gourier, Chem. Mater., 2014, 26 (3), 1365.
28 C. Rosticher, B. Viana, G. Laurent, P. Le Griel, and C. Chanéac,
Eur. J. Inorg. Chem., 2015, 3681.
29 C. Rosticher, B. Viana, T. Maldiney, C. Richard and C. Chanéac, J. Lumin., 2016, 170, 460.
30 L. Faucher, M. Tremblay, J. Lagueux, Y. Gossuin and M. A. Fortin, ACS Appl. Mater. Interfaces, 2012, 4 (9), 4506.
31 J. Y. Park, M. J. Baek, E. S. Choi, S. Woo, J. H. Kim, T. J. Kim, J. C. Jung, K. S. Chae, Y. Chang and G. H. Lee, ACS Nano, 2009, 3 (11), 3663.
32 H. B. Na, I. C. Song and T. Hyeon, Adv. Mater., 2009, 21, 2133.
33 R. Di Corato, F. Gazeau, C. Le Visage, D. Fayol, P. Levitz, F. Lux, D. Letourneur, N. Luciani, O. Tillement and C. Wilhelm,
ACS Nano, 2013, 7 (9), 7500.
34 S. A. Osseni, S. Lechevallier, M. Verelst, P. Perriat, J. Dexpert-Ghys, D. Neumeyer, R. Garcia, F. Mayer, K. Djanashvili, J. A. Peters, E. Magdeleine, H. Gros-Dagnac, P. Celsisf and R. T. Mauricot, Nanoscale, 2014, 6, 555.
35 J. Zhang, Y. Liu and S. Man, J. Lumin., 2006, 117, 141. 36 M. Mikami and A. Oshiyama, Phys. Rev. B, 1999, 60, 1707. 37 S. Mao,. Liu, M. Gu, D. Mao and C. Chang, J. Alloys Compd.,
2008, 465, 367.
38 B. Lei, Y. Liu, J. Zhang, J. Meng, S. Man and S. Tan, J. Alloys
Compd., 2010, 495, 247.
39 T. H. Shin, Y. Choi, S. Kim and J. Cheon, Chem. Soc. Rev., 2015, 44, 4501.
40 J. G. Penfield and R. F. Reilly, Nat. Clin. Pract. Nephrol., 2007,
3, 654.
41 Z. Zhou, L. Wang, X. Chi, J. Bao, L. Yang, W. Zhao, Z. Chen, X. Wang, X. Chen and J. Gao, ACS Nano, 2013, 7, 3287.
42 D. Kryza, J. Taleb, M. Janier, L. Marmuse, I. Miladi, P. Bonazza, C. Louis, P. Perriat, S. Roux, O. Tillement and C. Billotey, Bioconjugate Chem., 2011, 22, 1145.
43 J. Thirumalai, R. Chandramohan, S. Auluck, T. Mahalingam and S. R. Srikumar, J. Colloid Interface Sci., 2009, 336, 889. 44 J. Thirumalai, R. Chandramohan, S. Valanarasu, T. A. Vijayan,
R. M. Somasundaram, T. Mahalingam and S. R. Srikumar, J.
Mater. Sci., 2009, 44, 3889.
45 G. Blasse, B. C. Grabmaier, Luminescent materials, Springer
Verlag, 1994.
46 P. A. Rodnyі, Opt. Spectrosc., 2009, 107 (2), 270. 47 P. Dorenbos, J. of Lum., 2007, 122-123, 315.
48 J. T. Randall and M. H. F. Wilkins, Proc. R. Soc. A, 1945, 184, 366.
49 S. Blahuta, B. Viana, A. Bessiere, E. Mattmann and B. LaCourse, Opt. Mater., 2011, 33 (10), 1514.
50 L. Faucher, A. A. Guay-Begin, J. Lagueux, M. F. Cote, E. Petitclerc and M. A. Fortin, Contrast Media Mol. Imaging, 2011, 6, 209.
51 M. Ahre, L. Selega, F. Soderlind, M. Linares, J. Kauczor, P. Norman, P.-O. Kall, K. Uvdal, J. Nanopart. Res., 2012, 14, 1006.