Working paper
DT n° 6
Psychosocial resources and social health
inequalities in France:
Exploratory findings from a general
population survey
Florence Jusot (Irdes)
Michel Grignon (Departments of Economics and Health, Aging and Society, McMaster University, Hamilton, Ontario ;
Center for Health Economics and Policy Analysis (Chepa), McMaster University Associate Eesearcher, Irdes)
Paul Dourgnon (Irdes)
Psychosocial resources and social health inequalities in France:
Exploratory findings from a general population survey
Florence Jusot†, Michel Grignon‡,&,₤, Paul Dourgnon†
Acknowledgment: this study has benefited from a grant from CNRS-MiRe-INSERM which provided the funds for the workshops on the measurement of individual access to psycho-social resources in a general population survey. The IRDES funded the inclusion of the question in the SPS survey, allowing us to test the impact on self-assessed health. Our warmest thanks go to the participants to the workshops held in Paris (Lisa Berkman, Basile Chaix, Pierre Chauvin, Sarah Curtis, Mariel Droomers, Christine Eibner, Anne Ellaway, Alexis Ferrand, Pierre-Yves Geoffard, Frédérique Houzeaux, Myriam Khlat, Maria de Koninck, Annette Leclerc, Isabelle Parizot, Dominique Polton, S.V. Subramanian, Jean-Pierre Worms). We also would like to thank our colleagues in the Polinomics Group at McMaster University and participants to the Global Social Capital network at Berkeley. All remaining errors are ours.
Michel Grignon conceived of the study, designed the questions and co-wrote the first draft of the paper – Florence Jusot worked on the study design, ran the statistical analyses, and wrote a first draft of the paper – Paul Dourgnon participated the study design, supervised fieldwork, and helped with the analyses and writing
† Institut de Recherche et de Documentation en Economie de la Santé (IRDES), Paris, France ‡ Departments of Economics and Health, Aging, and Society, McMaster University, Hamilton, Ontario
& Center for Health Economics and Policy Analysis (CHEPA), McMaster University ₤ Associate Researcher, IRDES
Corresponding author: Florence Jusot, IRDES (Research and information institute for health economics), 10 rue Vauvenargues, 75018 Paris, France; email : [email protected]
Abstract
We study the psychosocial determinants of self-assessed health in order to explain social inequalities in health in France.
We use a unique general population survey to assess the respective impact on self-assessed health status of subjective perceptions of social capital, social support, and sense of control, controlling for standard socio-demographic factors (SES, income, education, age and gender). The survey is unique in that it provides a variety of measures of self-perceived psychosocial resources (trust and civic engagement, social support, sense of control, and self-esteem).
We find empirical support for the link between the subjective perception of psychosocial resources and health. Sense of control at work is the most important correlate of health status after income. Other important ones are civic engagement and social support. To a lesser extent, sense of being lower in the social hierarchy is associated with poorer health status. On the contrary, relative deprivation does not affect health in our survey. Since access to psychosocial resources is not equally distributed in the population, these findings suggest that psychosocial factors can partially explain of social inequalities in health in France.
JEL classification: J120, I100
Key words: social capital, social support, relative deprivation, sense of control, social health inequalities, France
1. Introduction
This study explores the statistical associations between psychosocial resources, individual health, and the social gradient of health using the production function of health theoretical framework developed by Evans, Barer, and Marmor, (1994).
The production function of health approach distinguishes three broad categories of determinants of health: Genetic, physical environment, and social environment. Within the latter category of social environment we can distinguish material and psycho-social effects (Stoddart, 1995). The former includes the material effects of housing, health care, nutrition, and work environment on the health of individuals; the latter includes the impact on health of the level and quality of social support (network an individual can mobilize), social capital (trust in the community, civic involvement), and the sense of control individuals have on their life at home or at work (measured directly or as the perceived position of the individual in her/his reference group). Both types of effects can influence health directly, through a biological pathway, or indirectly, through a behavioural one (Evans, Barer, Marmor, 1994).
Whereas material inequalities were seen as the main cause of social inequalities in health, two observed facts have cast doubt on this conception (Stoddart, 1995). First, social inequalities in health still exist in welfare states where access to health care is independent from ability to pay. Second, social inequalities in health follow a gradient rather than a two-tier divide and material resources can not fully explain why upper middle class individuals are in better health than lower middle class ones since most live in proper houses and are not subject to detrimental working conditions. Even though this latter point is disputed in Pearce and Davey Smith (2003), based on the idea that early childhood living conditions have a lasting impact on adult health and that current lower middle class individuals likely spent their childhood in working class families, the idea that material determinants may not explain all social health inequalities is now largely admitted. More over, given the social gradient of access to psychosocial resources, these appear
to be a good candidate in explaining social health inequalities (Marmot, Wilkinson, 2005 ; Berkman, Kawachi, 2000).
A recent literature review of the link between social capital (one measure of psychosocial resources) and health (Islam et al., 2006) identifies two main approaches: the first one posits that what matters for health are the level and quality of psychosocial resources (e.g. civic engagement, trust, public services) available at the aggregate level; in such a conceptual framework social inequalities in health stem from the uneven distribution of socio-economic statuses across geographic areas (Kawachi, Berkman, 2003, Veenstra et al., 2005). The alternative view, to which this study belongs, is interested in the compositional effect and measures access to psychosocial resources at the individual level rather than the availability of these resources at the aggregate leveli.
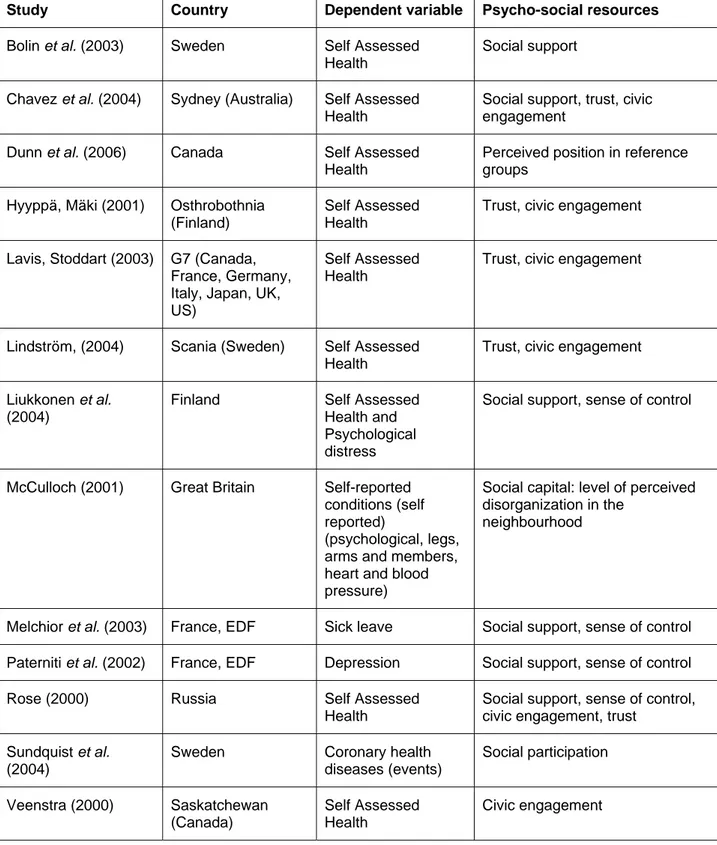
Islam et al. (2006) identified 9 published articles on the link between individual access to social capital and individual health. After this literature review was published, Dunn et al. (2006) published a study analyzing self-assessed position in the reference group and self-assessed health based on individual-level Canadian data. We also identified Lavis and Stoddart (2003), not mentioned in Islam et al. (2006), and two studies linking social support and job-related demand to health in France (Paterniti et al. 2002, Melchior et al. 2003, both based on a longitudinal survey of employees of the state-owned power company, EDF). We present briefly the main findings of these 13 studies (studies are summarized in table 1 according to country of observation, the variables used to measure health, and the type of psycho-social resources entered in the model). First, psycho-social resources are measured and defined in a variety of ways across these studies, reflecting the lack of consensus among social scientists (even among economists) on what social capital really is (Scheffler, this issue). Second, all studies show at least one significant positive relationship between access to psychosocial resources and current health. However, there is no general agreement about which type of psycho-social resource (social support, social capital or sense of control and perceived position in the social hierarchy) is more strongly associated with health. Only one study (Rose, 2000) finds a negative impact of access to social
support on health: Searching information from friends increases the likelihood of being in poor health in Russia, trust and sense of control have the expected positive impact on health. Interestingly, this is also the only study attempting to measure all three types of psycho-social resources in the same study. Lavis and Stoddart (2003) compare trust and civic engagement and find the first dimension of social capital to be strongly correlated with health, but not the latter. They also show that France is one of the seven countries included in their study where the correlation is the weakest. Causal relationship is suggested in three longitudinal studies. The risk of coronary heart disease remains significantly higher in a 10 year follow-up among individuals with low participation in Sweden (Sundquist et al., 2004). In France, depressive symptoms and the probability of being on sick leave are higher in a three-year follow up among employees with perceived high job demands, low social support, and, for male workers only, low sense of control on work, controlling for occupational status and personality traits (Paterniti et al. 2002, Melchior et
al. 2003). One study (Liukkonen et al., 2004) cannot find any causal impact of perceived security
of employment and the level of expected support from co-workers on self-assessed health and psychological distress in a 4-year follow-up study of public employees in Finland.
We follow a well-established methodology in this literature on the impact of the utilization of psycho-social resources on health and social health inequalities (see e.g. Lavis and Stoddart, 2003): using a general population survey, we measure the correlation between perceived access to psychosocial resources and health at the individual level, controlling for gender, age, income, education and occupational status (catégorie socio-professionnelle). In this framework, age and gender account for biological determinants of health, and occupation, income and education account for “material” factors of health, even though it could be argued that education incorporates some psycho-social effects as well. Behaviours per se (smoking, drinking, diet, and exercise) are not entered as controls in the regression since psychosocial factors are conceived of as determinants of health-related behaviours (poorer access to social capital could lead to smoking or poor diet). And the question is: Does individual access to psychosocial resources (support, social capital, sense of control) explain an important part of the variation in health across individuals and socio-economic statuses?
We add to the literature in the following ways:
To the best of our knowledge, this is the first time a study is conducted on this issue based on a general population survey representative of the French population. Lavis and Stoddart (2003), using data from the World Values Survey including France show that the impact of psychosocial factors on health varies with national context. Moreover, the World Values Survey (2007) indicates that the average level of access to psycho-social resources (measured as generalized trust and sense of control over one’s life in the 1999-2004 wave) is much lower in France (22% trust others and the level of sense of control over life is at 6.5 on a 10-degree scale) than in Great Britain (30% and 7.2), the US (36% and 8.0), or Sweden (66% and 7.4). Last, Mackenbach et al. (1997) have shown that France has the highest level of social inequalities in mortality among 11 European countries.
Second, we use a unique dataset, representative of the general population living in France, comprising a wealth of descriptors of individual health and health behaviours, as well as a complete set of measures of psychosocial factors at the individual level. Besides civic engagement, trust, and social support we add measures of the sense of control and the sense the individual has of his/her position in the social hierarchy. We are therefore in a position to assess the respective impacts of access to these different types of psycho-social resources whereas most previous studies focused on one (social support, social capital, or position in the social hierarchy) only.
2. Data and Method
Data
The analysis is based on a population survey, representative of the French population, the Health, Health Care and Insurance Survey (ESPS: “Enquête sur la santé et la protection
sociale”), coordinated by the Institute for Research and Information in Health Economics (IRDES). We use the 2004 wave, which included a set of questions on psychosocial resources. The survey sample, comprised of 8,141 households, is based on a random draw from administrative files of the main sickness funds to which over 90% of the population living in France belong (Allonier, Dourgnon, Rochereau, 2006). Individuals drawn at random from the administrative files are used to identify households. The socioeconomic questionnaire is answered by one key informant in each household (aged at least 18), who needs not be the individual selected at random and self-selects voluntarily. Questions on health status are collected through a self-administered questionnaire completed individually by each household member. Questions on psychosocial resources are answered by the key informant for him or herself only. Questions on civic engagement, trust and social support were asked to all key informants and questions on sense of control at work and comparisons within the reference group were asked to employed key informants only, since these dimensions make sense for this population only.
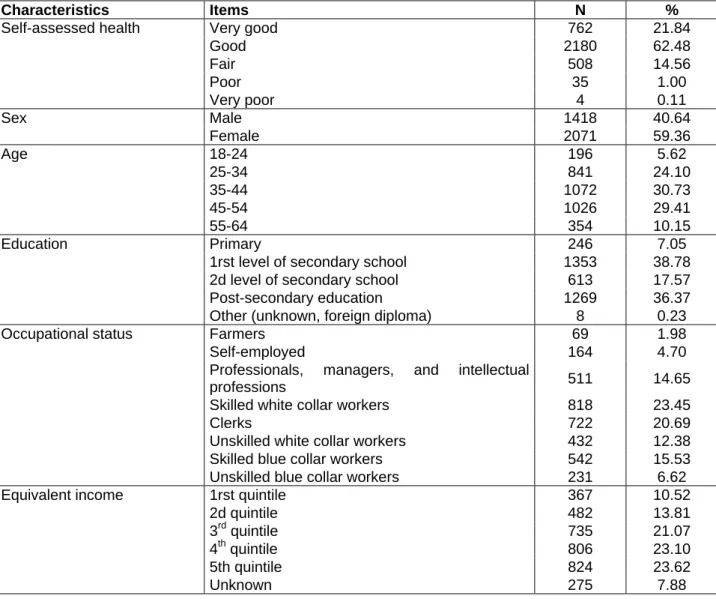
Since our main objective study is to assess the respective roles of a variety of psycho-social resources on health status, we restrict our analysis to the population of employed individuals aged 18 to 64, who reported their health status: 3,489 individuals (1,418 males and 2,071 females). This sample is representative of the population of employed key informants, aged 18 to 64, and not of the general population living in France. Table 2 below shows the main characteristics of the sample and it appears that women are over-represented as well as individuals from higher socio-economic status. These biases are controlled for in our analyses and there is no strong reason to suspect that unobserved response biases could affect the associations between psychosocial resources and health.
Health and Socio-economic variables
We use the question on self-assessed health, the first one of three standardized questions suggested by the WHO European Office to measure individual health in surveys, to construct a
binary health descriptor opposing people reporting a “very good” or “good” general health status to people reporting a “fair”, “bad” or “very bad” general health status. We use the dichotomous health measure as our dependent variable in a series of logistic regressions with socio-economic factors and psychosocial resources as the independent factors.
Income is measured as household income (from all sources of income), divided by the OECD equivalence scale (1 for the first household member, .5 for the second one, and .3 for the following ones). We create a series of categorical variables based on the income quintile of the distribution of income in the French population (rather than the studied population, as a result we don’t necessarily have 20% of the study population in each quintile), as well as one category for those who did not provide income information. Educational level is measured as: primary (age 11 in France), first level of secondary school (age 15), second level of secondary school (baccalaureate, age 18), some post-secondary education, with a supplementary category for foreign diploma and missing value. Occupational status is measured as: farmers; self-employed; professionals, managers, and intellectual professions (reference); skilled white collar workers (e.g. nurses, elementary school teachers, technicians); clerks; unskilled white collar workers; skilled blue collar workers; unskilled blue collar workers. Age is entered as a continuous variableii.
Psychosocial resources measures
Our main objective was to assess the respective roles of a variety of psycho-social resources in the variations of health across individuals. Most studies pick one dimension (social capital, social support, or sense of control) and measure its association with health, but we wanted to compare all these three dimensions with each other in their effect on health. The objective was therefore to capture as many psycho-social resources as possible, subject to the constraint that the survey already includes many questions and cannot exceed a reasonable length. As a result, we chose to assess our three dimensions (social capital, social support, and position in the social order) with two or three questions each (hence six to nine questions added to the survey overall). We present the relevant section of the questionnaire in appendix 1.
To help us in this endeavour we invited a group of international experts in the field of the link between psycho-social resources and health. Two workshops were held in Paris, in May 2003 and April 2004. The workshops were organized around three issues: how to ask about access to social capital, social support, and sense of control over one’s life?
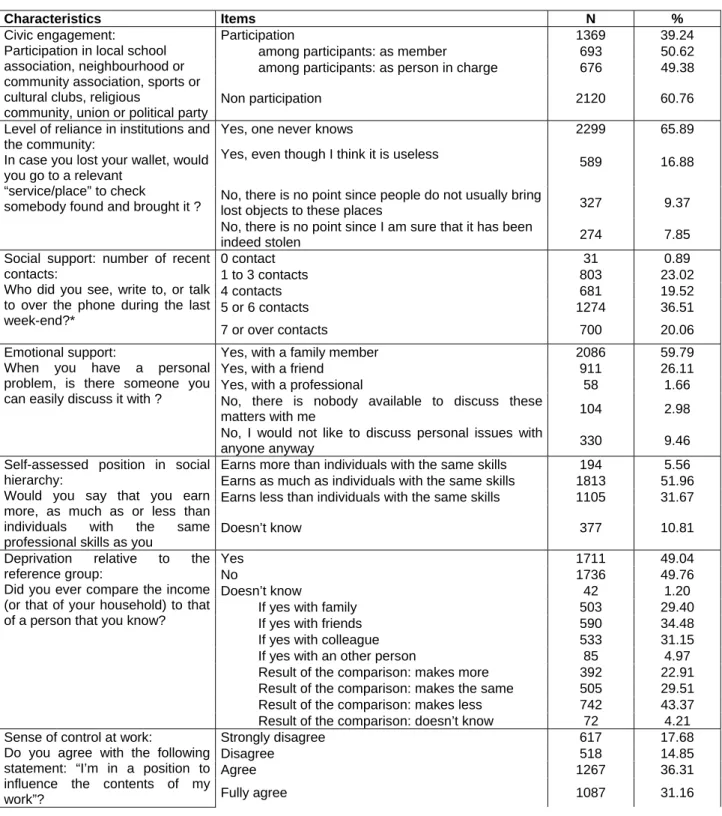
Social capital is often measured at the individual level through civic engagement (participation to collective endeavours) and/or level of trust in the community, following Putnam’s (1993) definition that social capital “refers to features of social organization, such as trust, norms and networks that can improve the efficiency of society by facilitating coordinated actions”. We asked two questions on civic engagement and one on trust.
For civic engagement, we use one question on participation (including political groups) plus one to distinguish participation as member and participation as person in charge to measure the degree of involvement of the individual in collective activities. The rationale for including political groups or unions is that in France participation to religious associations is not as common as in North America.
Trust can be measured through a mind experiment (would you trust your neighbours to look after your children?) or as a broad assessment of how trustworthy are others in general (Scheffler, this issue)iii. We opted for a mind experiment that is not restricted to parents of young children and involves institutions as well as other individuals (La Porta et al., 1997 and Rothstein, 2000 show that trust in institutions is an important component of psycho-social resources): what to do in case one loses his or her wallet? Moreover we wanted to measure the level of reliance on institutions as they exist where the individual think they are relevant (be it where s/he works or lives) and not only in the residence area.
For social and emotional support, we used a series of standard questions, adapted from the GAZEL survey (Melchior et al., 2003) and the GLOBE study in the Netherlands. A first question investigates the number of contacts and a second one asks about emotional support and the reasons for the lack of it (Berkman and Glass, 2000).
Sense of control is less often measured in general population surveys. We wanted to measure the sense the individual has of his/her position in the social hierarchy, and whether he/she can control his/her life. The first dimension can be measured as relative deprivation, compared to an objective group of reference (similar individuals). The underlying reasoning here is that feelings of under-achievement can be the individual pathway through which income or social inequalities affect health and explain why in more unequal societies individuals at the lower end of social hierarchy end up in poorer health even if they are above the absolute material poverty threshold. In the literature, such groups are comprised of people of the same age and educational level (Eibner and Evans, 2005), and we summarized these characteristics by asking about people with the same skills; therefore, we measure here a sense of being treated fairly or of discrepancies between effort and reward and we expect that perceived discrepancies signal a sense that the individual does not control his/her life. We also wanted to measure the impact of confrontations with social hierarchies on health, as stated in Marmot and Wilkinson, (2005) (see also Ellaway et
al., 2004, for social comparisons of homes and psychosocial health): a perception of being
dominated rather than dominant can diminish the sense of control and autonomy and be detrimental for health. Therefore we asked respondents whether they compared their income with other people (self-selected group of reference) and what was the outcome of the comparison. A third question adapted from the GAZEL survey (Melchior et al., 2003), asked about the sense of control at work.
Descriptive statistics on these measures are presented in table 3.
Analytic strategy
The unique character of this study is our ability to use all different types of psychosocial resources, including sense of control and self-assessed position in social hierarchy, simultaneously in explaining self-assessed health as well as to study the relation between socio-economic status (education, income, and education) and psycho-social resources.
First, we checked that the different types of psychosocial resources (social support, social capital, and sense of control) are not linearly correlated and that it is feasible to enter all as independent variables (results not presented here).
Second, we ran a baseline logit analysis with health as the dependent variable and entering age, sex, income, education, and occupational status only. We use the baseline to assess the share of social inequalities in health that is explained by psychosocial resources. All psychosocial resources were then entered simultaneously in a second model to analyze the association ceteris
paribus between self-assessed health and each psychosocial resource. This latter analysis was
also replicated separately for men and women to test the hypothesis of differential influence of psychosocial resources according to gender.
This methodology doesn’t attempt to prove a causal relationship between psycho-social resources and health. Our measures of association can indicate a true causal impact, but also, if individuals build their psychosocial resources as much as these are given to them (Bolin et al., 2003) result from reciprocal causality (poor health limits access to resources) and/or unobserved heterogeneity (the same unobserved skills or preferences explain a higher level of resources and of health capital).
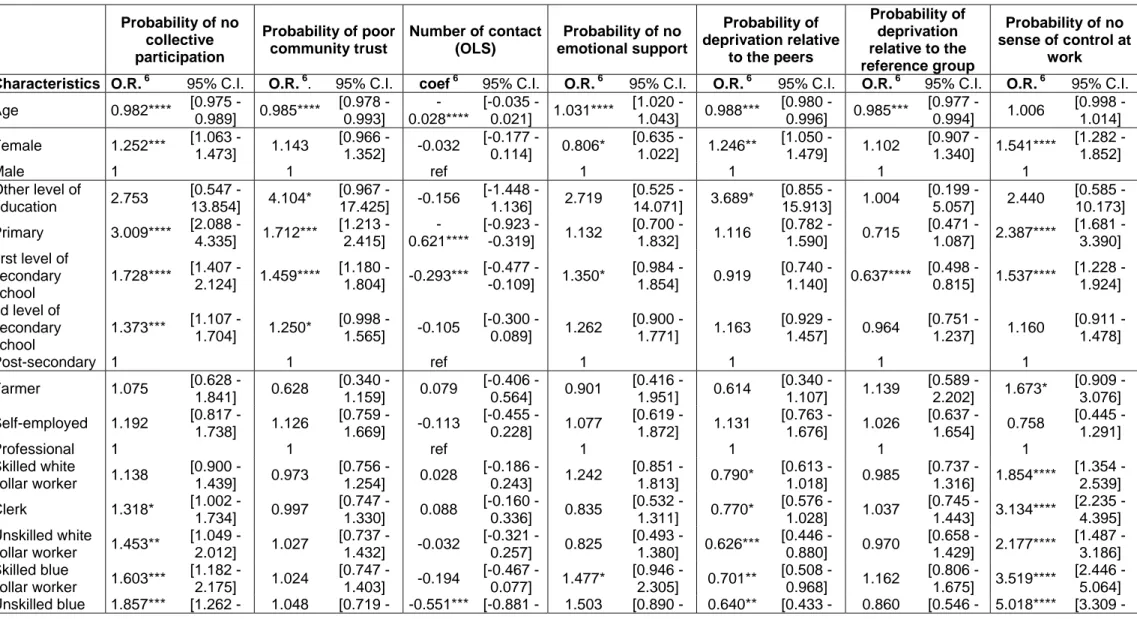
To test further that psychosocial resources that psychosocial factors can explain a substantial part of social health inequalities, we lastly analyze the socio-economic determinants of the number of contact (OLS regression) and of the probability of lacking each of other psychosocial resource (no collective participation, no community trust, any emotional support, the feeling to make less than individuals with the same skills, the feeling to make less than his reference group, no sense of control at work).
3. Findings
The findings of the baseline analysis of the material and biological determinants of health (model 1, Table 4) show that the probability of reporting poor or bad health increases with age and is
higher for females and that all socio-economic variables have a significant effect of expected sign. The only socio-economic variable which is significant at 5% level is income, less well-off individuals being more likely to be in the poorer health category. Some educational and occupational status categories are significant at 10% level: individuals with primary educational level report poorer health status compared to individuals with post-secondary education level and skilled and unskilled blue collar workers compared to professionals, managers, and intellectual professions.
The second column of table 4 gives the results of the second analysis where all psychosocial resources are entered simultaneously in the regression of self-assessed health, controlling for age, sex, occupational status, education level, and household income among employed individuals. Compared to our baseline analysis where only socio-economic determinants (occupation, education, and income) are entered, only income remains significant once psychosocial resources are introduced. The impact of education and occupational category seems to be explained entirely by differential access to psychosocial resources.
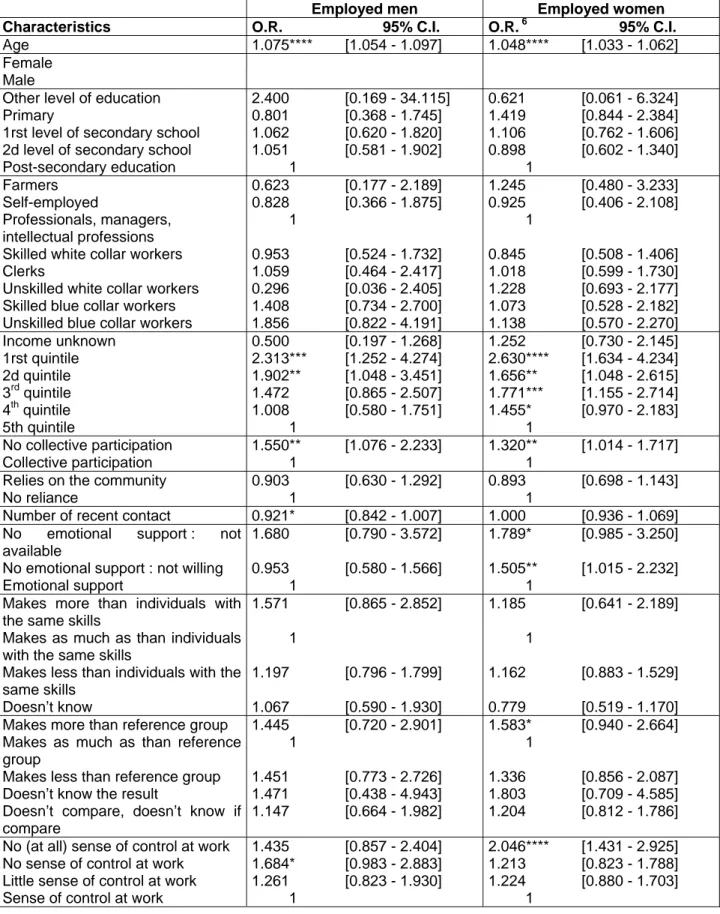
Within psycho-social resources, the strongest and most precisely estimated effect is that of the sense of control on work: individuals who strongly disagree that they have autonomy in their work have a much higher relative risk of being in the poorer health category (with an odds ratio equal to 1.9 and significantly different from 0 at the 0.1% level). This effect can partly explain the absence of any significant effect occupational status.
Second to sense of control is social support: lacking emotional support both has a strong effect on the probability of being in the poorer health category (with an odd-ratio greater than 1.5 but at the 5% level only). The lack of civic engagement is also associated to poorer health category with an odd-ratio of 1.4 (at the 0.1% level). Findings for the influence of the sense of one’s position in social hierarchy are less intuitive: making more and less than one’s reference group both increase the probability of being in the poorer health category (with odds-ratios around 1.5, but at 10% only for making less). On the contrary, perceived relative deprivation (making less than
individuals with the same skills) and reliance on the community (believing that it is useful to go to the lost and found for a lost wallet) don’t have any significant impact on self-assessed health. Conducting separate analyses for both sexes we found associations of the same sign and magnitude (Table 5). The only difference is that social support does not work identically for men and women: we are able to measure an influence of the number of contacts on health for men (more contacts decrease the probability of declaring poorer health) but emotional support influences health for women only.
The analysis of the determinants of poor access to psychosocial resources (Table 6) confirms that individuals with higher levels of education, occupational status or income also benefit on average from access to significantly better psychosocial resources: They participate significantly more often, rely significantly more on their community, have more emotional support and have a significantly better sense of control at work. The main exceptions are comparisons with peers or within the reference group for which intermediary groups (2nd level of secondary school or quintiles 3 and 4 of income) are at a disadvantage compared to extreme groups.
4. Discussion
Using a unique set of measures of psychosocial factors at the individual level and various health status indicators, this study provides empirical evidence on the link between the subjective perception of some psychosocial resources and health in France and also some evidence that there may not be a link for other, more material, factors once these psychosocial ones are taken into account. Since we also show that access to these resources is uneven in the population and strongly influenced by social status, those factors can partly explain the high level of social health inequalities in France.
Our results are consistent with several previous studies. As suggested by Putnam (1993), social capital, assessed by civic engagement, seems to have a protective effect on health, even though community trust is not associated with self-assessed health. Consistent with the findings of
Berkman and Glass (2000), health status is positively associated with access to emotional support, rather than with the size of social networks. We find a weak association between self-assessed health and relative deprivation, whatever the reference group considered (peers, family, or friends) contrary to the conclusions of Dunn et al. (2006), Deaton (2001), Eibner and Evans (2005), and Elstad et al. (2006), but similar to Miller and Paxson (2006). Finally, our main finding is that, controlling for all other resources, the lack of sense of control at work strongly increases the probability of being in poor or bad health and seems to be the main factor of social inequalities in health, in accord with the model proposed by Karasek (Karasek, 1979, Karasek and Theorell, 1990).
If the associations we measure indicate a causal pathway from psycho-social resources to health, public health policies aimed at reducing social inequalities of health in France should work on reducing the sense of disenfranchising (lack of sense of control over one’s life and lack of civic engagement) rather than at reducing income inequalities or enhancing the level of institutional trust. As recently and dramatically demonstrated by the riots in the fall of 2005, localized in a small number of urban areas, and less dramatically by the ILO survey on discrimination by employers in France (Cediey and Foroni, 2006), the unequal distribution of rights and blatant discrimination based on ethnicity and immigrant status are important factors of unequal access to psycho-social resources in France. As a result, we have good reasons to think that public policies could do a lot to address unequal access to psycho-social resources and, consequently, health inequalities.
However, the causal nature of the association is a big if: based on currently available evidence we cannot go beyond associations and the next steps in our research agenda will be to overcome biases precluding the causal interpretation of our findings. First, using a variety of less subjective measures of health (chronic conditions, risk factors, clinicians’ assessments, and health-related behaviours) we will test that the association between health and the lack of psycho-social resources is not due to a “pessimistic bias” (the same individuals tend to pessimistically assess both their health status and their capacity to muster social resources). Second, we will use
changes in health (controlling for baseline health) are linked to the initial level psycho-social resources this will provide further evidence of a causal impact of social capital on health. Third, we will use aggregate level measures of psycho-social resources as instruments (likely not influenced by individual health) to further limit the simultaneity bias between individual health and individual access to social capital.
In case these further investigations prove the causal pathway behind our observed associations, we will conduct a partial effects analysis in order to assess how much of social inequalities in health can be explained by social inequalities in access to psychosocial resources.
Last, we will investigate the determinants of access to psycho-social resources, more specifically those based on residence, race-ethnicity, immigrant status, language, and religion which are seen as major social markers in contemporary France.
i
We don’t mean here that we are interested in individual social capital only (e.g. the type of social capital stemming from one’s own participation to an association) and dismiss collective social capital. Rather, we attempt at measuring the latter as it is (subjectively) perceived by the individual.
ii
We tested several different specifications for age: linear, quadratic, and categorical (18-29; 30-39; 40-49; 50-64); the linear one was selected according to the Akaike criterion.
iii
The 2005 wave of the world value survey measures trust using the following question:
“Generally speaking, would you say that must people can be trusted or that you need to be very careful in dealing with people?”
References
Allonier, C., Dourgnon, P., Rochereau, T. (2006), “Santé, soins et protection sociale en 2004”,
IRDES report, 2006/01.
Berkman, L.F., Glass, T. (2000), “Social Integration, Social Networks, Social Support, and Health”, in L.F. Berkman and I. Kawachi (Eds), Social Epidemiology. New York: Oxford University Press.
Berkman, L.F, Kawachi, I. (2000), Social Epidemiology. New York: Oxford University Press. Bolin, K., Lindgren, B., Lindström, M., Nystedt, P. (2003), “Investments in social capital. Implications of social interactions for the production of health”, Social Science and Medicine, 56(12): 2379-90.
Cediey, E. and F. Foroni (2006) “Les discriminations à raison de ‘l’origine’ dans les embauches en France – Une enquête nationale par tests de discrimination selon la méthode du bureau international du travail », ILO, Geneva.
Chavez, R., Kemp L., Harris, E. (2004), “The social capital health relationship in two disadvantaged neighborhoods”, Journal of Health Services Research and Policy, 9(Suppl 2): 29-34.
Deaton, A. (2001), “Relative Deprivation, Inequality and Mortality”, NBER WP, 8099.
Dunn, J.R., Veenstra, G., Ross, N. (2006) “Psychosocial and neo-material dimensions of SES and health revisited: Predictors of self-rated health in a Canadian National Survey”, Social
Science and Medicine, 62(6): 1465-1473.
Eibner, C., Evans, W.N. (2005), “Relative Deprivation, Poor Health Habits and Mortality”,
Journal of Human Resources, 40(3): 591-620.
Ellaway, A., McKay, L., Macintyre, S., Kearns, A., Hiscock, R. (2004), “Are social comparisons of homes and cars related to psychosocial health?”, International Journal of
Epidemiology, 33(5):1065-71.
Elstad, J.I., Dahl, E., Hofoss, D. (2006), “Associations between relative income and mortality in Norway: A register-based study”, European Journal of Public Health, 16(6): 640-644. Evans, R.G., Barer, M.L., Marmor, T.R. (1994), Why are some people healthy and others not?
The determinants of health of populations. New York: Aldine de Gruyter.
Hyyppä, M.T. Mäki, J. (2001), “Individual-Level Relationships between Social Capital and Self-Rated Health in a Bilingual Community”, Preventive Medicine, 32(2): 148-155.
Islam, K., Merlo, J., Kawachi, I., Lindstrom, M., Gerdtham, U.G. (2006), “Social capital and health: Does egalitarianism matter? A literature review”, International Journal for Equity in
Health, 5(3): doi:10.1186/1475-9276-5-3.
Karasek, R. (1979), “Job demands, job decision latitude and mental strain : Implications for job redesign”, Administrative Science Quarterly, 24: 285-306.
Karasek, R., Theorell, T. (1990), Healthy work: stress, productivity, and the reconstruction of
working life. New York: Basic Books.
Kawachi, I., Berkman, L. (2003), Neighborhoods and health. New York: Oxford University Press.
La Porta, R., Lopez-de-Silanes F., Shleifer, A., and Vishny, R. W. (1997) « Trust in Large Organizations » American Economic Review, 87(2): 333-338
Lavis, J., Stoddard, G. (2003), “Social cohesion and health” in L. Osberg (Ed), The Economic
Implications of Social Cohesion. Toronto ON: University of Toronto Press: 121-149.
Lindström, M. (2004), “Social capital, the miniaturization of community and self reported global and psychological health”, Social Science and Medicine, 59(3): 595-607.
Liukkonen, V., Virtanen, P., Kivimaki, M., Pentti, J. and Vahtera, J. (2004), “Social capital in working life and the health of employees”, Social Science and Medicine, 59 (12): 2447-2458. McCulloch, A. (2001), “Social environments and health: cross sectional survey”, British
Medical Journal, 323(7306): 208-209.
Mackenbach J.-P., Kunst A.E., Cavelaars A.E.J.M. et al. (1997), “Socio-economic inequalities in morbidity and mortality in Western Europe: a comparative study”, Lancet, 349: 1655-1659. Marmot, M., Wilkinson, R.G. (2005), Social Determinants of Health. Oxford: Oxford University Press.
Melchior, M., Niedhammer, I., Berkman, L.F., Goldberg, M. (2003), “Do psychosocial work factors and social relations exert independent effects on sickness absence? A six year prospective study of the Gazel cohort”, Journal of Epidemiology and Community Health, 57(4): 285-293.
Miller, D.L., Paxson, C. (2006), “Relative income, race, and mortality”, Journal of Health
Economics, 25 (5): 979-1003.
Pearce, N., Davey Smith, G. (2003), “Is Social Capital the Key to Inequalities in Health?”,
American Journal of Public Health, 93(1): 122-129.
Rose, R. (2000), “How much does social capital add to individual health? A survey study of Russians”, Social Science and Medicine, 51(9): 1421-1435.
Rothstein, B. (2000) “Social Capital and Institutional Legitimacy.” Presented at the Annual Meeting of the American Political Science Association, Washington D.C.
Paterniti S., Niedhammer I., Lang T., Consoli, S.M. (2002) “Psychosocial factors at work, personality traits and depressive symptoms. Longitudinal results from the GAZEL Study”,
British Journal of Psychiatry, 181: 111-117.
Putnam, R.D. (1993), Making Democracy Work. Civic traditions in Modern Italy. Princeton, NJ: Princeton University Press.
Scheffler, R. (2007), “Social Capital, Economics, and Health: New Evidence”, Health Economics Policy and Law, forthcoming
Stoddart, G. (1995), “The Challenge of Producing Health in Modern Economies”, Toronto:
Canadian Institute for Advanced Research Working Paper, 46.
Sundquist, K, Lindström, M, Malmström, M, Johansson, S, Sundquist, J. (2004), “Social participation and coronary heart disease: a follow-up study of 6900 women and men in Sweden”, Social Science and Medicine, 58(3):615–622.
Veenstra, G. (2000), “Social capital, SES and health: an individual-level analysis”, Social
Science and Medicine, 50(5) : 619-629.
Veenstra, G., Luginaah, I., Wakefield, S., Birch, S., Eyles, J., Elliott, S. (2005), “Who you know, where you live: social capital, neighbourhood and health”, Social Science and
Medicine, 60 (12): 2799-818.
World Values Survey (2007), Ann Arbor, MI – authors’ online analyses, accessed through http://www.worldvaluessurvey.org/, on April 12, 2007
Tables
Table 1: Previous studies – main characteristics.
Study Country Dependent variable Psycho-social resources Bolin et al. (2003) Sweden Self Assessed
Health
Social support
Chavez et al. (2004) Sydney (Australia) Self Assessed Health
Social support, trust, civic engagement
Dunn et al. (2006) Canada Self Assessed Health
Perceived position in reference groups
Hyyppä, Mäki (2001) Osthrobothnia (Finland)
Self Assessed Health
Trust, civic engagement
Lavis, Stoddart (2003) G7 (Canada, France, Germany, Italy, Japan, UK, US)
Self Assessed Health
Trust, civic engagement
Lindström, (2004) Scania (Sweden) Self Assessed Health
Trust, civic engagement
Liukkonen et al. (2004)
Finland Self Assessed
Health and Psychological distress
Social support, sense of control
McCulloch (2001) Great Britain Self-reported conditions (self reported)
(psychological, legs, arms and members, heart and blood pressure)
Social capital: level of perceived disorganization in the
neighbourhood
Melchior et al. (2003) France, EDF Sick leave Social support, sense of control Paterniti et al. (2002) France, EDF Depression Social support, sense of control Rose (2000) Russia Self Assessed
Health
Social support, sense of control, civic engagement, trust
Sundquist et al. (2004)
Sweden Coronary health
diseases (events) Social participation Veenstra (2000) Saskatchewan (Canada) Self Assessed Health Civic engagement
Table 2. Descriptive statistics: socio-demographic characteristics of the sample Characteristics Items N % Very good 762 21.84 Good 2180 62.48 Fair 508 14.56 Poor 35 1.00 Self-assessed health Very poor 4 0.11 Male 1418 40.64 Sex Female 2071 59.36 18-24 196 5.62 25-34 841 24.10 35-44 1072 30.73 45-54 1026 29.41 Age 55-64 354 10.15 Primary 246 7.05
1rst level of secondary school 1353 38.78
2d level of secondary school 613 17.57
Post-secondary education 1269 36.37
Education
Other (unknown, foreign diploma) 8 0.23
Farmers 69 1.98
Self-employed 164 4.70
Professionals, managers, and intellectual
professions 511 14.65
Skilled white collar workers 818 23.45
Clerks 722 20.69
Unskilled white collar workers 432 12.38
Skilled blue collar workers 542 15.53
Occupational status
Unskilled blue collar workers 231 6.62
1rst quintile 367 10.52 2d quintile 482 13.81 3rd quintile 735 21.07 4th quintile 806 23.10 5th quintile 824 23.62 Equivalent income Unknown 275 7.88
Table 3. Descriptive statistics: psychosocial determinants of health
Characteristics Items N %
Participation 1369 39.24
among participants: as member 693 50.62 among participants: as person in charge 676 49.38 Civic engagement:
Participation in local school association, neighbourhood or community association, sports or cultural clubs, religious
community, union or political party
Non participation 2120 60.76
Yes, one never knows 2299 65.89
Yes, even though I think it is useless
589 16.88
No, there is no point since people do not usually bring
lost objects to these places 327 9.37
Level of reliance in institutions and the community:
In case you lost your wallet, would you go to a relevant
“service/place” to check
somebody found and brought it ?
No, there is no point since I am sure that it has been
indeed stolen 274 7.85
0 contact 31 0.89
1 to 3 contacts 803 23.02
4 contacts 681 19.52
5 or 6 contacts 1274 36.51
Social support: number of recent contacts:
Who did you see, write to, or talk to over the phone during the last week-end?*
7 or over contacts 700 20.06
Yes, with a family member 2086 59.79
Yes, with a friend 911 26.11
Yes, with a professional 58 1.66
No, there is nobody available to discuss these
matters with me 104 2.98
Emotional support:
When you have a personal problem, is there someone you can easily discuss it with ?
No, I would not like to discuss personal issues with
anyone anyway 330 9.46
Earns more than individuals with the same skills 194 5.56 Earns as much as individuals with the same skills 1813 51.96 Earns less than individuals with the same skills 1105 31.67 Self-assessed position in social
hierarchy:
Would you say that you earn more, as much as or less than individuals with the same professional skills as you
Doesn’t know 377 10.81
Yes 1711 49.04
No 1736 49.76
Doesn’t know 42 1.20
If yes with family 503 29.40
If yes with friends 590 34.48
If yes with colleague 533 31.15 If yes with an other person 85 4.97 Result of the comparison: makes more 392 22.91 Result of the comparison: makes the same 505 29.51 Result of the comparison: makes less 742 43.37 Deprivation relative to the
reference group:
Did you ever compare the income (or that of your household) to that of a person that you know?
Result of the comparison: doesn’t know 72 4.21
Strongly disagree 617 17.68
Disagree 518 14.85
Agree 1267 36.31
Sense of control at work:
Do you agree with the following statement: “I’m in a position to influence the contents of my
work”? Fully agree 1087 31.16
(*) Interviewers suggested possible contacts from a list including parents, parents in law, children, siblings, grand-parents, other relatives, friends, neighbours, work-mates, others, and respondents answered yes or no
Table 4. Determinants of the probability of being in poor self-assessed health, odds ratios associated to material and psychosocial determinants of health (multivariate analysis) – Employed population
Model 1 Model 2
Characteristics O.R. * 95% C.I. O.R. 6 95% C.I.
Age 1.056**** [1.044 - 1.067] 1.057**** [1.045 - 1.069] Female 1.570**** [1.243- 1.982] 1.488**** [1.174 - 1.885]
Male 1 1
Other level of education 1.646 [0.315 - 8.612] 1.149 [0.208 - 6.346] Primary 1.436* [0.951 - 2.170] 1.221 [0.798 - 1.867] 1rst level of secondary school 1.209 [0.900 - 1.626] 1.084 [0.800 - 1.467] 2d level of secondary school 1.011 [0.731 - 1.399] 0.933 [0.671 - 1.296]
Post-secondary education 1 1
Farmers 0.876 [0.426 - 1.799] 0.882 [0.422 - 1.844] Self-employed 0.860 [0.489 - 1.512] 0.893 [0.504 - 1.580] Professionals, managers, intellectual
professions 1 1
Skilled white collar workers 0.923 [0.636 - 1.340] 0.879 [0.603 - 1.281] Clerks 1.106 [0.735 - 1.666] 1.021 [0.674 - 1.546] Unskilled white collar workers 1.237 [0.784 - 1.950] 1.191 [0.751 - 1.889] Skilled blue collar workers 1.463* [0.945 - 2.265] 1.238 [0.792 - 1.935] Unskilled blue collar workers 1.611* [0.975 - 2.662] 1.319 [0.789 - 2.205] Income unknown 0.989 [0.637 - 1.534] 0.976 [0.623 - 1.529] 1rst quintile 2.547**** [1.777 - 3.650] 2.461**** [1.697 - 3.569] 2d quintile 1.647*** [1.161 - 2.337] 1.665*** [1.164 - 2.383] 3rd quintile 1.658*** [1.201 - 2.290] 1.627*** [1.171 - 2.260] 4th quintile 1.254 [0.914 - 1.720] 1.266 [0.918 - 1.745] 5th quintile 1 1 No collective participation 1.399*** [1.132 - 1.730] Collective participation 1
Relies on the community 0.910 [0.743 - 1.113]
No reliance 1
Number of recent contact 0.973 [0.923 - 1.026]
No emotional support : not available 1.689** [1.064 - 2.682] No emotional support : not willing 1.258 [0.928 - 1.704]
Emotional support 1
Makes more than individuals with the same
skills 1.338 [0.879 - 2.036]
Makes as much as than individuals with the
same skills 1
Makes less than individuals with the same
skills 1.176 [0.938 - 1.474]
Doesn’t know 0.851 [0.611 - 1.186]
Makes more than reference group 1.536** [1.015 - 2.326] Makes as much as than reference group
Makes less than reference group 1.387* [0.966 - 1.992]
Doesn’t know the result 1.685 [0.812 - 3.496]
Doesn’t compare, doesn’t know if compare 1.210 [0.881 - 1.661] No (at all) sense of control at work 1.876**** [1.404 - 2.507]
No sense of control at work 1.350* [0.987 - 1.847]
Little sense of control at work 1.259* [0.972 - 1.632]
Sense of control at work 1
Table 5. Determinants of the probability of being in poor self-assessed health, odds ratios associated to material and psychosocial determinants of health (multivariate analysis) – Employed population – men and women separately
Employed men Employed women
Characteristics O.R. 95% C.I. O.R. 6 95% C.I.
Age 1.075**** [1.054 - 1.097] 1.048**** [1.033 - 1.062]
Female
Male
Other level of education 2.400 [0.169 - 34.115] 0.621 [0.061 - 6.324] Primary 0.801 [0.368 - 1.745] 1.419 [0.844 - 2.384] 1rst level of secondary school 1.062 [0.620 - 1.820] 1.106 [0.762 - 1.606] 2d level of secondary school 1.051 [0.581 - 1.902] 0.898 [0.602 - 1.340]
Post-secondary education 1 1 Farmers 0.623 [0.177 - 2.189] 1.245 [0.480 - 3.233] Self-employed 0.828 [0.366 - 1.875] 0.925 [0.406 - 2.108] Professionals, managers, intellectual professions 1 1 Skilled white collar workers 0.953 [0.524 - 1.732] 0.845 [0.508 - 1.406]
Clerks 1.059 [0.464 - 2.417] 1.018 [0.599 - 1.730] Unskilled white collar workers 0.296 [0.036 - 2.405] 1.228 [0.693 - 2.177] Skilled blue collar workers 1.408 [0.734 - 2.700] 1.073 [0.528 - 2.182] Unskilled blue collar workers 1.856 [0.822 - 4.191] 1.138 [0.570 - 2.270] Income unknown 0.500 [0.197 - 1.268] 1.252 [0.730 - 2.145] 1rst quintile 2.313*** [1.252 - 4.274] 2.630**** [1.634 - 4.234] 2d quintile 1.902** [1.048 - 3.451] 1.656** [1.048 - 2.615] 3rd quintile 1.472 [0.865 - 2.507] 1.771*** [1.155 - 2.714] 4th quintile 1.008 [0.580 - 1.751] 1.455* [0.970 - 2.183] 5th quintile 1 1 No collective participation 1.550** [1.076 - 2.233] 1.320** [1.014 - 1.717] Collective participation 1 1
Relies on the community 0.903 [0.630 - 1.292] 0.893 [0.698 - 1.143]
No reliance 1 1
Number of recent contact 0.921* [0.842 - 1.007] 1.000 [0.936 - 1.069] No emotional support : not
available
1.680 [0.790 - 3.572] 1.789* [0.985 - 3.250] No emotional support : not willing 0.953 [0.580 - 1.566] 1.505** [1.015 - 2.232]
Emotional support 1 1
Makes more than individuals with the same skills
1.571 [0.865 - 2.852] 1.185 [0.641 - 2.189] Makes as much as than individuals
with the same skills
1 1 Makes less than individuals with the
same skills
1.197 [0.796 - 1.799] 1.162 [0.883 - 1.529] Doesn’t know 1.067 [0.590 - 1.930] 0.779 [0.519 - 1.170] Makes more than reference group 1.445 [0.720 - 2.901] 1.583* [0.940 - 2.664] Makes as much as than reference
group
1 1 Makes less than reference group 1.451 [0.773 - 2.726] 1.336 [0.856 - 2.087]
Doesn’t know the result 1.471 [0.438 - 4.943] 1.803 [0.709 - 4.585] Doesn’t compare, doesn’t know if
compare
1.147 [0.664 - 1.982] 1.204 [0.812 - 1.786] No (at all) sense of control at work 1.435 [0.857 - 2.404] 2.046**** [1.431 - 2.925] No sense of control at work 1.684* [0.983 - 2.883] 1.213 [0.823 - 1.788] Little sense of control at work 1.261 [0.823 - 1.930] 1.224 [0.880 - 1.703]
Table 6. Determinants of access to psychosocial resources (employed population, 18-64 ) Probability of no collective participation Probability of poor community trust Number of contact (OLS) Probability of no emotional support Probability of deprivation relative to the peers Probability of deprivation relative to the reference group Probability of no sense of control at work Characteristics O.R. 6 95% C.I. O.R. 6. 95% C.I. coef 6 95% C.I. O.R. 6 95% C.I. O.R. 6 95% C.I. O.R. 6 95% C.I. O.R. 6 95% C.I.
Age 0.982**** [0.975 - 0.989] 0.985**** [0.978 - 0.993] -0.028**** [-0.035 - 0.021] 1.031**** [1.020 - 1.043] 0.988*** [0.980 - 0.996] 0.985*** [0.977 - 0.994] 1.006 [0.998 - 1.014] Female 1.252*** [1.063 - 1.473] 1.143 [0.966 - 1.352] -0.032 [-0.177 - 0.114] 0.806* [0.635 - 1.022] 1.246** [1.050 - 1.479] 1.102 [0.907 - 1.340] 1.541**** [1.282 - 1.852] Male 1 1 ref 1 1 1 1 Other level of education 2.753 [0.547 - 13.854] 4.104* [0.967 - 17.425] -0.156 [-1.448 - 1.136] 2.719 [0.525 - 14.071] 3.689* [0.855 - 15.913] 1.004 [0.199 - 5.057] 2.440 [0.585 - 10.173] Primary 3.009**** [2.088 - 4.335] 1.712*** [1.213 - 2.415] -0.621**** [-0.923 - -0.319] 1.132 [0.700 - 1.832] 1.116 [0.782 - 1.590] 0.715 [0.471 - 1.087] 2.387**** [1.681 - 3.390] 1rst level of secondary school 1.728**** [1.407 - 2.124] 1.459**** [1.180 - 1.804] -0.293*** [-0.477 - -0.109] 1.350* [0.984 - 1.854] 0.919 [0.740 - 1.140] 0.637**** [0.498 - 0.815] 1.537**** [1.228 - 1.924] 2d level of secondary school 1.373*** [1.107 - 1.704] 1.250* [0.998 - 1.565] -0.105 [-0.300 - 0.089] 1.262 [0.900 - 1.771] 1.163 [0.929 - 1.457] 0.964 [0.751 - 1.237] 1.160 [0.911 - 1.478] Post-secondary 1 1 ref 1 1 1 1 Farmer 1.075 [0.628 - 1.841] 0.628 [0.340 - 1.159] 0.079 [-0.406 - 0.564] 0.901 [0.416 - 1.951] 0.614 [0.340 - 1.107] 1.139 [0.589 - 2.202] 1.673* [0.909 - 3.076] Self-employed 1.192 [0.817 - 1.738] 1.126 [0.759 - 1.669] -0.113 [-0.455 - 0.228] 1.077 [0.619 - 1.872] 1.131 [0.763 - 1.676] 1.026 [0.637 - 1.654] 0.758 [0.445 - 1.291] Professional 1 1 ref 1 1 1 1 Skilled white collar worker 1.138 [0.900 - 1.439] 0.973 [0.756 - 1.254] 0.028 [-0.186 - 0.243] 1.242 [0.851 - 1.813] 0.790* [0.613 - 1.018] 0.985 [0.737 - 1.316] 1.854**** [1.354 - 2.539] Clerk 1.318* [1.002 - 1.734] 0.997 [0.747 - 1.330] 0.088 [-0.160 - 0.336] 0.835 [0.532 - 1.311] 0.770* [0.576 - 1.028] 1.037 [0.745 - 1.443] 3.134**** [2.235 - 4.395] Unskilled white collar worker 1.453** [1.049 - 2.012] 1.027 [0.737 - 1.432] -0.032 [-0.321 - 0.257] 0.825 [0.493 - 1.380] 0.626*** [0.446 - 0.880] 0.970 [0.658 - 1.429] 2.177**** [1.487 - 3.186] Skilled blue collar worker 1.603*** [1.182 - 2.175] 1.024 [0.747 - 1.403] -0.194 [-0.467 - 0.077] 1.477* [0.946 - 2.305] 0.701** [0.508 - 0.968] 1.162 [0.806 - 1.675] 3.519**** [2.446 - 5.064] Unskilled blue 1.857*** [1.262 - 1.048 [0.719 - -0.551*** [-0.881 - 1.503 [0.890 - 0.640** [0.433 - 0.860 [0.546 - 5.018**** [3.309 -
collar worker 2.733] 1.528] -0.221] 2.539] 0.944] 1.355] 7.609] Income unknown 0.993 [0.741 - 1.331] 0.852 [0.629 - 1.153] 0.126 [-0.132 - 0.384] 1.553** [1.029 - 2.342] 1.008 [0.730 - 1.391] 0.623** [0.409 - 0.949] 1.455** [1.061 - 1.996] 1rst quintile 1.041 [0.782 - 1.386] 0.768* [0.576 - 1.024] -0.020 [-0.266 - 0.226] 1.853*** [1.260 - 2.725] 2.179**** [1.638 - 2.899] 1.333* [0.953 - 1.866] 1.460** [1.087 - 1.960] 2d quintile 0.720** [0.558 - 0.929] 1.065 [0.824 - 1.378] 0.120 [-0.106 - 0.346] 1.358* [0.934 - 1.975] 1.903**** [1.458 - 2.484] 1.622*** [1.198 - 2.195] 1.077 [0.818 - 1.417] 3rd quintile 0.796** [0.634 - 1.000] 0.949 [0.753 - 1.197] 0.004 [-0.198 - 0.206] 1.337* [0.951 - 1.880] 1.732**** [1.362 - 2.203] 1.959**** [1.500 - 2.558] 1.232* [0.962 - 1.579] 4th quintile 0.817* [0.662 - 1.007] 0.984 [0.792 - 1.222] 0.025 [-0.162 - 0.213] 0.943 [0.671 - 1.325] 1.287** [1.025 - 1.616] 1.224 [0.945 - 1.585] 0.917 [0.720 - 1.167] 5th quintile 1 1 ref 1 1 1 1
Appendix 1: Set of questions on subjective perception of psychosocial resources included in the 2004 SPS Survey
Community trust
« In case you lost your wallet, would you go to a relevant “service/place” to check somebody found and brought it?»
1.Yes, one never knows
2.Yes, even though I think it is useless
3.No, there is no point since people do not usually bring lost objects to these places 4.No, there is no point since I am sure that it has been indeed stolen
Civic engagement
« Do you participate regularly in a collective activity such as a local school association, neighbourhood or community associations, sport or cultural clubs, religious community, union or political party?»
1 : Yes, as member
2 : Yes, as an person in charge of the organisation/direction 3 : No
Recent social contact
« During last week-end, did you see, write to, or talk over the phone with one of the following persons:
List including parents, parents in law, children, siblings, grand-parents, other relatives, friends, neighbours, work-mates, others (Yes or no for each type of person)
Emotional support
« When you have a personal problem (a quarrel with your spouse or a family member) is there someone you can easily discuss it with?”
1.Yes, with a family member 2.Yes, with a friend
3.Yes, with a professional
4.No, there is nobody that I can discuss with these matters easily 5.No, I would not like to discuss personal issues with anyone anyway
Deprivation relative to peers
«Would you say that you earn more, as much as, or less, than individuals with the same professional skills as you? »
1.You earn more 2.You earn the same 3.You earn less 4.You do not know
Deprivation relative to the reference group
«Did you ever compare your income (or that of your household) to that of a person that you know? »
1.Yes 2.No
4.You do not know
«If yes, with whom?»
List including parents, parents in law, children, siblings, grand-parents, other relatives, friends, neighbours, work-mates, others
«What was the result?» 1.You make more 2.You make the same 3.You make less 4.You do not know
Sense of control at work
«Do you fully agree, agree, disagree, strongly disagree with the following statement ? : I am in a position to influence the contents of my work »
1. Fully agree 2. Agree 3. Disagree
www.irdes.fr
Florence Jusot (Irdes), Michel Grignon (McMaster University, Irdes), Paul Dourgnon (Irdes)
We study the psychosocial determinants of health, and their impact on social inequalities in health in France. We use a unique general population survey to assess the respective impact on self-assessed health status of subjective perceptions of social capital controlling for standard sociodemographic factors (occupation, income, education, age and gender). The survey is unique for two reasons: First, we use a variety of measures to describe self-perceived social capital (trust and civic engagement, social support, sense of control, and self-esteem). Second, we can link these measures of social capital to a wealth of descriptors of health status and behaviours.
We find empirical support for the link between the subjective perception of social capital and health. Sense of control at work is the most important determinant of health status. Other important ones are civic engagement and social support. To a lesser extent, sense of being lower in the social hierarchy is associated with poorer health status. On the contrary, relative deprivation does not affect health in our survey. Since access to social capital is not equally distributed in the population, these findings suggest that psychosocial factors can explain a substantial part of social inequalities in health in France.
Ressources psychosociales et inégalités sociales de santé en France :
premiers résultats d’une enquête en population générale (ESPS 2004)
Florence Jusot (Irdes), Michel Grignon (McMaster University, Irdes), Paul Dourgnon (Irdes)
Ce document présente une étude de l’impact de déterminants psychosociaux sur l’état de santé perçu visant à expliquer les inégalités sociales de santé en France.
Les données de l’Enquête Santé Protection Sociale 2004 sont utilisées pour évaluer l’impact sur l’état de santé déclaré de la perception subjective de l’accès à plusieurs ressources psychosociales, après contrôle par les caractéristiques socio-démographiques usuelles (occupation, niveau d’éducation, âge et sexe). Cette enquête, réalisée en population générale, est unique car elle offre une série d’indicateurs de ressources psychosociales : confiance et engagement civique, soutien social, sentiment d’autonomie au travail, estime de soi.
Les résultats montrent l’existence d’un lien entre la perception subjective de l’accès à des ressources psychosociales et l’état de santé. Parmi les déterminants de santé les plus importants, on trouve le sentiment d’autonomie au travail, l’engagement civique et le soutien social, après le niveau de revenu. En revanche, le sentiment d’être socialement désavantagé par rapport à son entourage n’a pas d’incidence sur la santé. L’accès à ces ressources psychosociales n’étant outre inégalement distribué dans la population, ces résultats suggèrent que les facteurs psychosociaux peuvent en partie expliquer le niveau des inégalités sociales de santé en France.