D
OCUMENT DE
T
RAVAIL
DT/2003/05
Colonization, Institutions, and
Inequality
A Note on Some Suggestive Evidence
Denis COGNEAU
Charlotte GUENARD
COLONIZATION, INSTITUTIONS, AND INEQUALITY A Note on Some Suggestive Evidence
Denis Cogneau DIAL – UR CIPRÉ de l’IRD
[email protected] Charlotte Guénard
IEP-Paris, DIAL – UR CIPRÉ de l’IRD [email protected]
Document de travail DIAL / Unité de Recherche CIPRÉ
Juin 2003
RESUME
Quels sont les types d’institutions qui influencent les inégalités économiques ? En utilisant une base de données sur les inégalités nationales de revenu sur un échantillon de 73 pays non européens, nous montrons que la « bonne gouvernance » contribue non seulement au niveau de revenu moyen des pays mais aussi à une distribution plus égalitaire à travers l’accroissement de la part de revenu reçue par la classe moyenne. A côté de cet effet de la qualité des institutions capitalistes, nous trouvons une relation en U inversé entre les inégalités et l’importance de la population de descendance européenne. Nous trouvons enfin une corrélation large et robuste entre la densité de population précoloniale et l’égalité de la distribution actuelle du revenu. Nous argumentons que cette dernière corrélation reflète des dimensions institutionnelles qui ne sont pas captées par les mesures usuelles de qualité des institutions dans les bases de données disponibles. Les pays qui étaient les plus densément peuplés au seizième siècle ont en effet une moins bonne gouvernance mais accordent une plus large part du revenu aux plus pauvres. Ils avaient des Etats précoloniaux plus structurés, ont résisté plus souvent à la colonisation, et ont adopté plus souvent un système d’économie mixte. Beaucoup d’entre eux présentent une répartition des terres plus égalitaire. L’égalité de la distribution des terres apparaît comme un déterminant important de l’égalité globale des revenus et de la pauvreté, indépendamment des standards de « gouvernance » usuels.
Mots clefs : Colonisation, Inégalités, Institutions, Développement. ABSTRACT
What is the kind of institutions that affect economic inequalities? Using a database on national income inequality for 73 non-European countries, we show that 'good governance' not only contributes to the level of income but also to a more equal distribution by increasing the income share of the middle class. Beside this effect of the quality of capitalist institutions, we also find an inverted U relationship between inequalities and the extent of European settlement. We finally find a large and robust correlation between the pre-colonial population density and the present equality of income distribution. We argue that this latter correlation may have to do with institutional dimensions that are not captured by usual measures of institutional quality in available databases. Countries which were more densely populated in 1500 have indeed worse 'governance' but give larger income shares to the poor. They had more structured pre-colonial States, more often resisted to colonisation, and more often adopted a mixed economic system. Many of them in fact ended with a more equal land distribution. The equality in the distribution of landholdings does appear as an important determinant of the overall equality of income and of poverty which is independent from 'usual' governance issues.
Key Words: Colonization, Inequalities, Institutions, Development. JEL Classification: N37, O40, P51.
Table of Contents
1. INTRODUCTION ... 4
2. COLONIZATION PATTERNS AND INEQUALITY: A DISCUSSION ... 7
2.1 Settlement colonization... 8
2.2 ‘Divide and rule’ colonization ... 9
2.3 Pre-colonial development, resistance to colonization and inequalities... 10
3. ECONOMETRIC RESULTS ... 12
4. CONCLUSION ... 22
APPENDICES... 23
A. Variables definitions and sources ... 23
B. Details on some variables constructions... 25
REFERENCES... 27
List of tables
Table 1 A typology of colonization... 31Table 2 First results on the relation colonization-inequality... 32
Table 3.1 Basic results – Dependent variable: Gini index... 33
Table 3.2 A little more sophisticated specification ... 33
Table 4 Robustness checks for the basic result on the Gini index (dependent variable) ... 34
Table 5.1 European Settlement as an additional variable ... 35
Table 5.2 Additional instruments for the quality of institutions and the population of European descent ... 36
Table 6 Robustness checks with ‘commodity endowments’ (Dependent variable: Gini index) ... 37
Table 7 Pre-colonial variables and Lorenz Curve... 38
Table 8 Present institutions and pre-colonial variables ... 39
Table 9 A Land Distribution story (1)... 40
Table 10 A Land Distribution Story (2) ... 41
List of figures
Figure 1 The weight of European Descent population in 1975 and the Gini index... 42Figure 2.1 The log-Density of population in 1500 and the Gini index ... 43
Figure 2.2 Gini index as a function of log-Density of population in 1500 ... 43
Figure 2.3 Gini index as a function of log-Density of population in 1500 Lower tercile of settlers mortality ... 44
Figure 2.4 Gini index as a function of log-Density of population in 1500 Middle tercile of settlers mortality... 44
1. Introduction
In two recent papers, Acemoglu, Johnson and Robinson provide convincing evi-dence about the influence of European colonialism on the growth paths experi-enced by non-European regions. Colonies where Europeans settled, or expected to settle, in large numbers because mortality rates for early settlers were rela-tively low ended with better capitalist institutions and therefore a higher level of GDP per capita (Acemoglu et al. 2001). Colonies which were the most densely populated and urbanized at the beginning of the colonial period (around 1500) performed worse under colonial rule and after, because of an ’institutional reversal of fortune’ (Acemoglu et al. 2002). A causal link thus seems to be rather estab-lished going from some pre-colonial characteristics such as health conditions and population density to run growth performance, passing through some long-lasting institutional features such as the protection of individual property rights or the constraints put on political executives. However there is room for study and debate about the exact channels through which pre-colonial conditions and colonial intervention interacted in institution building. For instance, the effect of pre-colonial density of population on post-colonial institutions is decomposed by Acemoglu, Johnson and Robinson into two channels. First population density would have made extractive institutions more profitable through forced labor and high taxes systems. Second it would have both directly and indirectly1 limited
the settlement of a large European population, and therefore the development of institutions encouraging local economic performance.2
Are the relative numbers of indigenous and settlers the very causal deter-minants of the quality of institutions, or else are endowments in some natural resources which were particularly profitable during the pre-colonial and/or the colonial periods the ultimate explanation? This is the now famous hypothesis raised recently by Engerman and Sokoloff (1994, 2000, 2002). In Caribbean is-lands where the indigenous population died because of the diseases brought by Europeans, the latter did not reverse their institutional choice and imported slaves
1Through the disease environment which was worse, because of contagion, in densely settled
areas.
2"In prosperous and densely settled areas, Europeans introduced or maintained
already-existing extractive institutions to force the local population to work in mines and plantations, and took over existing tax and tribute systems. In constrast, in previously sparsely settled areas, Europeans settled in large numbers and created institutions of private property, providing secure property rights to a broad section of the society and encouraging commerce and industry". Cf. Acemoglu et al., 2002, pp. 1265-66 and p.1279 (for this quotation).
from dense regions of Africa in order to carry on running large scale sugar pro-duction. In the New World, tropical regions might indeed have suffered from a kind of ’natural resource curse’ determining at the same time bad extractive insti-tutions, a higher use of forced indigenous or slave labor and high persistent levels of inequality. Easterly (2002) has recently provided an empirical test in favor of this latter thesis on a worldwide sample of former colonies. In our paper, we also try to explore the multidimensional consequences of colonization by looking at the levels of economic inequality attained in former European colonies. Economic equality has often been raised as a potential determinant of growth, through a variety of channels among which the workings of credit markets and the political determination of economic policies.3 However, the 1990s empirical literature has
not produced any robust evidence on the inequality-growth relationship at the country level, perhaps because of the superposition of a number of contradictory elementary relationships and because of nonlinearities.4 The difficulty with this
inequality-growth relationship, as well as for its older ’Kuznets curve’ counter-part, has always been that the level and the distribution of income are potentially codetermined by the same factors. In particular, growth and inequality are con-strained by long-lasting institutions. For instance, historical institutions shape the workings of credit markets and the political equilibrium, which may in turn influence policies, growth and inequality.5
Both in Engerman and Sokoloff historical perspective and in Easterly econo-metric work, the basic theoretical argument rests upon the unequalitarian insti-tutions induced by the weight of large plantation crops or of minerals extraction in the total product. In the case of agricultural commodities, economies of scale6
or even more simply the profitability of large plantations using forced, indentured or slave labor would have resulted in a skewed size distribution of farms. More generally, in countries where such profit opportunities prevailed during the colo-nial period, unequalitarian institutions were designed to protect the interests of
3See e.g. Aghion, Caroli, García-Peñalosa, 1999.
4See Banerjee and Duflo (2000) or Cogneau and Guénard (2002).
5For macroeconomic policies and macroeconomic volatility, Acemoglu et al. (2003) again
produce evidence of an institutional determination.
6Decreasing returns prevail at the stage of production for most agricultural commodities. It
is not true at the processing stage for a small set of them including sugarcane, bananas, oil palm and tea, and coffee or rubber to a lesser degree. See e.g., Bingswanger H.P., K. Deininger, G. Feder (1995), who argue p. 2695 that "the superiority of the plantation depends on a combination of economies of scale in processing and a coordination problem". [underlined by the authors]
the small class of European owners. Then, long after the colonial period and the industrial revolution, persisting unequalitarian institutions still hamper capi-tal accumulation and development. In what follows we shall raise serious doubts about the pieces of evidence produced by Easterly, and shall conclude with Nu-gent and Robinson (2001) that ’endowments are not fate’. Note that within the Engerman and Sokoloff framework, pre-colonial population density has an am-biguous status. On the one hand, if economies of scale prevail, high population density regions with abundant indigenous labor should more often end up with large plantations. Moreover, labor shortages in low density regions might have pre-cluded plantation agriculture. Then, the interaction variable crossing the kind of resource endowments (and thus the intensity of scale economies or diseconomies) with the population density should have a significant impact on land distribution and overall inequality of income. On the other hand, low density regions offered vast areas of land ready for European settlers appropriation and favored land intensive technologies.7
Our estimates indicate that institutions determined by pre-colonial and colo-nial history account for a very important share of income inequality differentials among former colonies and even among the larger set of non-European countries. Like in Acemoglu et al. (2001), we first find that countries where the settlers’ mortality was low ended with better capitalist institutions, as measured by the various indicators gathered by Kaufman, Kraay and Zoido-Lobatón (1999a and b, 2002). Like in Acemoglu et al. (2002), we also confirm that the most densely populated countries in 1500 which were colonized by Europeans ended with worse capitalist institutions and lower GDP per capita. In contrast we find that they turn out to have a more equal distribution of income. The rare non-European countries which were never colonized by Europeans also associate a higher popu-lation density in 1500 and a low level of income inequality at the end of the 20th century. The institutions of old densely populated countries do better at increas-ing the income share of the poorest. It seems that ’good’ capitalist institutions also reduce income inequality by increasing the income share of the middle class. Those two factors are sufficient to explain the continental ’dummies’ on
inequal-7Nugent and Robinson (2001) do not find any kind of variation whatsoever with population
density among Latin American coffee economies (Costa Rica, Colombia, El Salvador, Guatemala, Nicaragua). First, in the case of coffee, decreasing returns clearly prevail at the production stage, making smallholder production more efficient; second, low population density countries like Costa Rica and Nicaragua exhibit very different size distribution of farms, with Nicaragua being closer to the populated Mayan highlands countries like El Salvador or Guatemala. See also previous footnote.
ity, contrasting the high levels attained in Latin America and Africa with the low levels of Asia.
The remainder of this paper is organized as follows. Section 2 makes a dis-cussion of the potential impact of colonization patterns on economic inequality, from the institutional standpoint. Section 3 presents the suggestive evidence we have obtained regarding the impact of pre-colonial and colonial institutions on inequality. Section 4 concludes.
2. Colonization patterns and inequality: a discussion
The colonization of Asia, Africa, America, and Oceania by Europeans took place at different times in world history. It also took different paths because Europeans encountered in each case different levels of organization and of resistance. In Asia, Europeans had to deal with cultural, political and economic settings whose com-plexity was at least comparable to theirs, even if it may be that they were already more advanced in terms of wealth and technology at the end of the 18th cen-tury.8 The spread of writing, of great religions and of sophisticated agricultural
techniques came with differentiated societies and organized States extending their authority over vast and densely populated lands. There Europeans could not af-ford to settle in great numbers, even in places were health and climate conditions were enjoyable. Only a few countries have never been colonized by European powers (see table 1); excepting Liberia and Ethiopia, all are located in the Asian continent: China, Japan, Korea, Taiwan, Thailand, Iran, Turkey. In the New Worlds of America and Oceania, European settlers were confronted with young emerging empires only in two cases (Aztecs and Incas) while the rest of the time encountering tribal often nomadic societies. Even confronted with harsh resis-tance, Europeans succeeded after a lot of massacres in getting the land from the ’Indians’ and settled down in large numbers. In Southern regions and especially in the Caribbean islands where coffee, cotton, sugar, tobacco and other tropical products were very profitable, they also brought six millions of African slaves as a supplementary and more docile labor force. Slave trade was the first main in-trusion of Europeans in Africa, starting about the end of the 17th century. The power of Arab and Turk Empires had for a long time prevented them from step-ping down on the Southern coast of the Mediterranean Sea. Given its proximity to Europe, Northern Africa remained a special case. Europeans settled down during
the 19th century, mainly the French in Algeria, but had to leave in the 1960s. In Sub-Saharan Africa, bad health conditions, a higher density of population than in America, and the profit already derived from Americas through triangular trade, probably explain why Europeans did not attempt to extend their rule into the depths of the continent before the end of the 19th century. At this time, the rise of the competition between imperialist European nations which would end up in WWI led first to the ’Scramble for Africa’, a rapid and late invasion of the con-tinent between 1880 and the early 1900s. Finally, it is only in South-Africa and Zimbabwe (ex-South Rhodesia) that Europeans chose to settle down in numbers and remained, even if they never came in as large numbers than in America9.
[ Insert Table 1 here ]
2.1. Settlement colonization
It is only in Canada, USA, Australia and New-Zealand, and also in Argentina and Uruguay, that the white descendants of European settlers happened to represent the majority of the population. Still today, the first four ’Neo-Europe’ countries attract the bulk of migration flows running out of Europe. The weight of the population of European descent quickly reached more than 80% of the whole population in these countries, except in some Southern States of USA where black people still outnumber white people. Between the Neo-Europe countries and Latin American countries other than Argentina and Uruguay, there is a large gap in the distribution of the weight of European descent population (see figure 1). Brazil and Chile are the next countries with the largest proportion of Whites where they hardly weight more than 50% of the population. In other Latin American and in Caribbean Islands, the Whites weight between 10 and 30% of the population.10 Elsewhere in the world, the population of European descent has a significant weight only in South-Africa, Zimbabwe and Mauritius. In Latin America and some of the Caribbean Islands, some European people, mostly of Spanish or Portuguese origins, mixed up with the indigenous population and more rarely with blacks and gave birth to a Metis population. It almost never happened in Zimbabwe or South-Africa. In contrast, most of political leaders in Latin America countries come from the white population, whereas in Zimbabwe only since 1980 and in South-Africa
9French settlers left Algeria in 1962, and Portuguese settlers left Angola and Mozambique in
1975.
10Except in Guyana where they represent a very small minority (2%) and Haiti where they
only since 1994 the political executive is held by Blacks. It remains that in every countries where Whites represent a significant proportion of the population, they own a disproportionate share of land and capital assets, they are more educated and earn higher wages; finally white elites hold most of the levies of economic power, and in most cases of political power. Historically, institutions have been built up in order to defend and preserve the interests of white owners and settlers.
[ Insert figure 1 here]
2.2. ’Divide and rule’ colonization
In countries where they did not settle in numbers, that is in Asia and in most regions of Africa, Europeans had to invent how to rule vast regions with limited administrative bureaucracies and military forces. Although some variations ex-isted between the colonial powers which have already been commented at large (see, e.g., Cogneau, 2003a, for a recent contribution on this issue), all European colonial administrators implemented a kind of ’Indirect Rule’ system, relying on some indigenous intermediaries. European rulers had to enter a repeated game with the different local powers in order to maintain their supremacy. The first strategy was to get rid of previous kings or most dangerous leaders and to se-lect allies among the less reluctant customary chiefs and landlords. The second strategy was to promote a middle class of indigenous civil servants through formal education. In any case, they had to refrain newly promoted elites from acquiring too much authority from their strategic positions. Indirect rule always implied a ’divide and rule’ strategy. The colonial ruler thoroughly enumerated and classified ethnic and linguistic divisions, and often transformed moving and transient divides into hard and permanent enmities. Ethnic groups were rated on various scales: advanced / retarded, hard working / lazy, peaceful / belligerent, etc. (see, e.g. Horowitz, 2000).11 Besides, not any form of autonomy was ever granted. Even
when customary chiefs or landlords were allowed to collect taxes, to own and distribute land, the threat of a direct fiscal intervention and expropriation was maintained. Educated indigenous were generally not given any job security. The most talented of them became lawyers, journalists or doctors because they were kept out of the most important functions in the colonial administration. Forced labor institutions implied large labor displacement towards regions of plantation,
11In some countries where a new colonial power happened to take the place of another,
suspi-cion was maintained a long time against the allies of the former. See the cases of former German Cameroon, Togo and Tanganyika.
mines or extractive industries. After having mixed up populations in those regions or in urban areas, white employers often stimulated job competition between au-tochthons and allochthons. Most often, where the European descent population did not make the majority, the colonial power had refrained and delayed the ed-ucation and industrialization processes for fear of loosing its authority, and had designed institutions able to ensure the extraction of large rents for the benefit of a small number. Then, after independence, most colonized countries ended with larger ethnic, racial and social divides, a highly dualistic economic structure, small and weak State redistribution systems and a scarce supply of public goods. The colonial institutions were most of the time taken over unchanged by a local elite drawn out from one ethnic group and/or the dominant cast of the indigenous society.
2.3. Pre-colonial development, resistance to colonization and inequali-ties
Each of those characteristics of colonization may be thought of as contributing independently to the generation of economic inequalities. Large inequalities of income between racial or ethnic groups or casts directly lead to a large inter-group component in income inequality indexes, while dualistic factor markets and weak redistribution systems generate inequalities inside each group, thus raising the intra-group component. However, from an analytical and not purely descriptive standpoint, the two factors are not independent. Indeed, dualistic economic and State structures tend to stimulate cast or ethnic conflict for the capture of rents, generating clientelism in public employment, public investment choices (’white elephants’; see e.g. Robinson and Torvik, 2002), etc. Conversely, ethnic and cast divisions tend to lower the demand for universal redistribution and public goods, even in a democratic setting, because equalitarian political programs clash with hierarchical or racial preferences (see, e.g. Alesina, Glaeser, Sacerdote, 2001 and Lee and Roemer, 2002 for models and applications to the US case).
Hence we have good reasons to think that colonization often induced institu-tions that tend to generate and to maintain large inequalities. For instance, Iyer (2002) finds that Indian districts which were ruled by the British exhibit nowa-days a lower level of public goods delivery than districts which were never annexed to the British Empire, even once controlled for the highly selective colonial an-nexation policy. In the sample we have gathered of non-European countries, the
7 countries12 which were never directly ruled by the Europeans have an average
Gini index that is around 9 points lower than the mean of the other countries. At the other end of the spectrum of colonization, the 4 European colonies which ended in 1900 with more than 80% percent of their population being of European descent, the Neo-Europe countries13, have also an average Gini index that is more
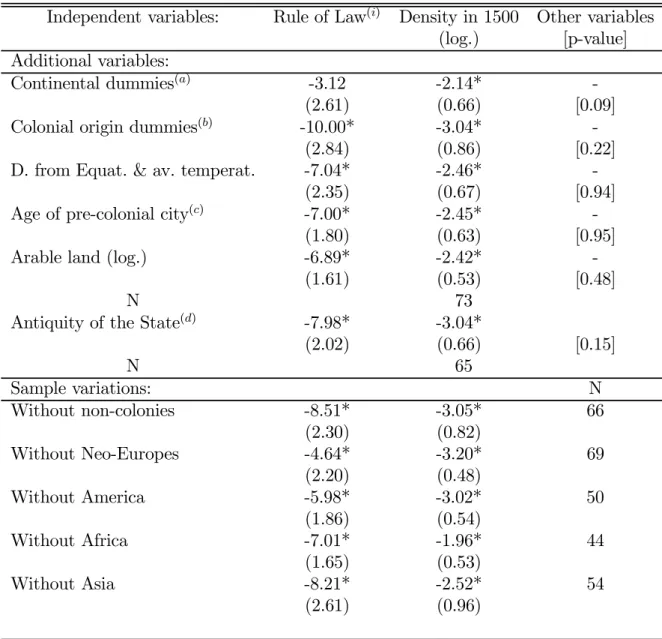
than 15 points lower. The institutions of these countries are closer to those of European countries than to those of other former colonies. Between these two groups of countries, we need indicators for the depth of the colonial institutional mark or for the degree of resistance to the colonial intrusion. We can look at the impact of the time length of the colonial period on present inequalities. Again it turns out to be positively correlated with the Gini index with a correlation coefficient of +0.18 on our sample of 62 former colonies excluding Neo-Europe countries. We can also look for measures of the pre-colonial level of economic and institutional development, assuming that regions that were initially wealthier and had more solid State structures could resist more to the unequalitarian impact of colonization. In this paper, we consider three possible indicators of pre-colonial development: the age of the first city founded before 1500 (from Parker,1997), the antiquity of the State (from Bockstette et al., 2002)14 and the logarithm of the
density of population in 1500 (from Acemoglu et al., 2002)15. The first variable
is indeed negatively correlated with the Gini index with a correlation coefficient of -0.33, the second also with -0.29, and the third again more with -0.53. Table 2 shows that the effect of the population density in 1500 absorbs the effects of both the length of the colonial period and of the age of the first city, as well as the effect of State antiquity. The Neo-Europe dummy and the density of population in 1500 taken together explain more than 40% of the variance of Gini indexes in our sample. The next section tries to corroborate a little further this first result and to discuss its institutional implications.
[ Insert Table 2 here ]
12China, Iran, Japan, Korea, Taiwan, Thailand, Turkey. 13Australia, Canada, New-Zealand and United States.
14For each period of 50 years between 1 and 1950 C.E., they asked 3 questions: (i) Is there
a government over the tribal level? (ii) Is this government foreign or locally based ? (iii) How much of the territory was ruled by this government? The scores on the three questions were multiplied by one another and by 50. The scores on each of the 39 half centuries were then "discounted" to reduce the weight of the most remote periods.
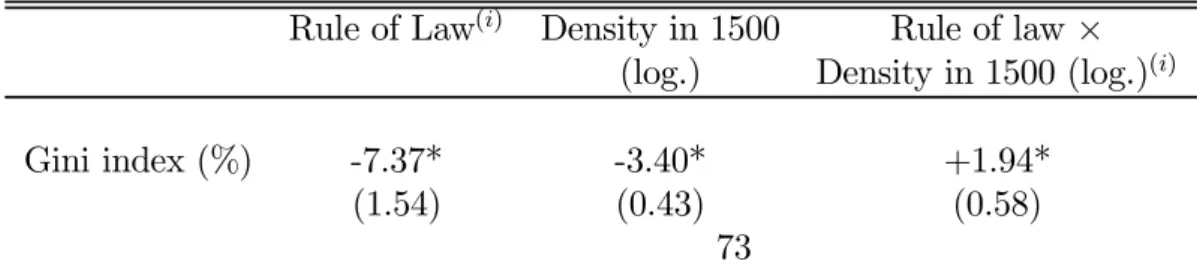
3. Econometric results
Table 3.1 shows the basic result of this paper. We transpose the Acemoglu et al. (2002) basic specification for explaining the present differentials of GDP per capita to the explanation of present inequality differentials. Whatever the out-come variable, this specification introduces a measure of the present quality of capitalist institutions and instruments it by (the logarithm of) the European set-tlers’ mortality in the 19th century.16 Here we make use of the recent Kaufman
et al. (2002) database on governance; for our basic specification, we have selected the ’rule of law’ dimension among the six institutional dimensions distinguished by Kaufman et al. Given the overall correlation of those six dimensions, our re-sults are not affected by the choice of another dimension than ’rule of law’ or of an arithmetic mean of the six. The Acemoglu et al. paper also tests for the impact of the density of population in 1500 on present GDP per capita. They show that density in 1500 is negatively correlated with present GDP per capita and that its effect goes entirely through the quality of institution variable (the ’institutional reversal of fortune’ story).
From the WIDER database on inequality, we have extracted a sample of 73 non-European countries for which a recent Gini index was available for the 1980-98 period.17 For the year of observation of the Gini index, we have then gathered such
variables as GDP per capita in PPP terms, life expectancy at birth, population density, urbanization rate, etc. (see Appendix for variables definition and sources). Quality of institution variables from Kaufman are for the year 2000. In table 3.1, we find again the basic result of Acemoglu et al, i.e. a strong impact of the quality of institutions on the level of GDP per capita and a purely mediated impact of the pre-colonial level of development as measured by the density of population in 1500. The same result holds if we take the life expectancy at birth instead of the GDP per capita, or else the average number of years of education in 1990. We find conversely that the Gini inequality index is negatively influenced by the ’rule of law’ variable but that the direct effect of population density in 1500 remains significant. As the population density in 1500 is negatively correlated with the present quality of institutions, its direct effect is in fact raised when this latter variable is taken into account. We find also that the present density of population is not correlated either with the quality of institutions or with the density of population about five centuries ago; besides, the Gini index shows no
16We had to extrapolate a settler mortality for some countries. See Appendix B.3 for details. 17See Appendix B.1 for details.
correlation whatsoever with present density of population, so that we can not give a mere demographic or factoral interpretation to the equalizing effect of the density of population in 1500.18 As shown in the bottom line of table 3.1, the
density of population in 1500 is both directly and indirectly negatively related to the present urbanization rate, whereas the latter is positively correlated with the present population density. Old densely settled countries have remained more rural on the whole, while countries populated during the colonial period have urbanized at a higher pace.19 Anyway, like for the present population density, we
observe no correlation at all between the urbanization rate and the Gini index. [ Insert Tables 3.1 and 3.2 here ]
Turning back to the explanation of present inequality, we may have a look to figure 2.1 which plots the Gini index against the (log.) density of population in 1500. In the right part of the cloud of points, we clearly discern the downward relationship revealed by the linear regression estimator. Figure 2.2 presents the result of a gaussian kernel regression (with 0.5 bandwidth) for the same sample; a Kuznets-like inverted-U curve relationship comes out, with the Gini index being low at both low and high levels of population density in 1500.20 The range of
variation of the Gini index is fairly large, as between the lower points of the curve fit and its maximum there is a more than 20 points difference. Figures 2.3 to 2.5 show the results of separate gaussian kernel regressions on a partition of the sample by terciles of settlers’ early mortality. We observe that as settlers’ mortality increases, the inverted U-curve relationship becomes a downward linear relationship, or in other words that the upward part of the inverted-U curve mainly comes from lower mortality countries.
[ Insert Figures 2.1 to 2.5 here]
In table 3.2, we try to give account of the non-linear relationship revealed by the gaussian kernel regressions, by setting down a little more sophisticated specification introducing an interaction effect between the quality of institutions and the pre-colonial population density. This interaction effect comes out as fairly significant. It may be interpreted as a varying coefficient model where the
18Within the frameworks of a dual economy model or an imperfectly opened economy,
Bour-guignon and Morrisson (1998) and Spilimbergo, Londoño and Székely (1999) examine the impact of population density on the distribution income.
19This observation could be due to a spurious effect of definition. In densely settled countries,
the population threshold which define an urban area might be higher than in sparsely settled countries.
20Anecdotally, a specification relating the Gini index to the squared logarithm of the density
equalizing effect of the colonially-induced quality of institutions (as instrumented by settlers’ mortality) is mitigated by the level of pre-colonial development. In this interpretation, when early development is low the equalizing effect of good (colonially-induced) capitalist institutions is higher.
In Table 4, we make some robustness checks for the simple two variables spec-ification explaining the Gini index. In the top panel of the table, we test for the effects of additional variables. Geographical variables like distance from Equator, temperature or country size do not come out as significant. Alternative measures of pre-colonial development like the age of the first city founded before 1500 or the antiquity of the State variable do not come out either. The same is true for colo-nial origin dummies, which do not come out either.21 Only continental dummies
do come out as slightly significant at the 10 percent level, because of the Oceania dummy which isolates two Neo-Europe countries, Australia and New-Zealand. In this regression with continental dummies, the ’governance’ effect both decreases in magnitude and significance. In the bottom panel of table 4, we deal with the impact of sample variations. While the effect of pre-colonial population density is maintained in all sub-sample regressions22, the quality of institution effect does
not loose its significance but decreases in magnitude when Neo-Europe countries are withdrawn from the analysis. Likewise, we have just seen that the introduc-tion of continental dummies cancels out the quality of instituintroduc-tions effect. These two variations do not come as a surprise, as gaussian kernel regressions (figures 2.3 to 2.5) and the non-linear specification estimated in table 3.2 have already shown that the quality of institutions effect is mainly relevant in countries of low pre-colonial density. Neo-Europe countries have both the highest quality of in-stitutions and the lowest pre-colonial density. Likewise, geographical continents show large variation in pre-colonial density, with America and Oceania being the most sparsely populated regions in 1500, and Asia the most densely populated (Africa standing in between).
[ Insert Table 4 here]
In fact, as pointed out in section 2.1, America and Oceania also make the exception (with South-Africa and Zimbabwe) in that Europeans settled down in
21The selection of colonies by the different European powers is here considered as exogenous,
as in Acemoglu et al. (2001) or La Porta et al. (1999). See Cogneau (2003) for a discussion of the selection issue in the case of the partition of Africa.
22In particular, notice that dropping never colonized countries whose ’potential
set-tlers’mortality’ has been extrapolated does not change the results. The same is true for other Table 3.1 regressions on development indicators. This robusteness check has been systematically repeated for all results in the remainder of this paper.
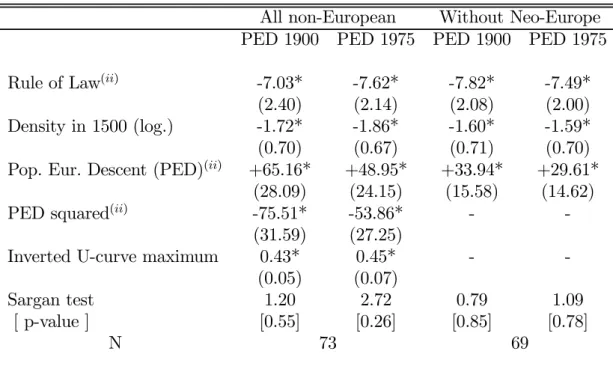
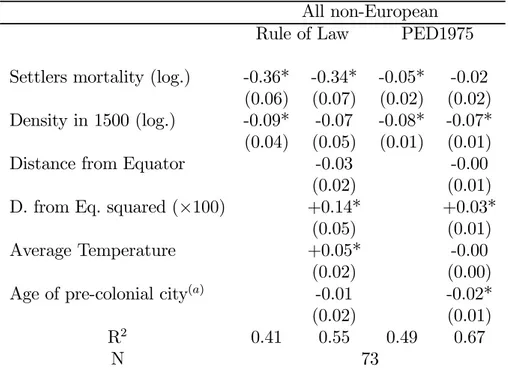
numbers in this continent. In table 5 we have tried to identify an additional direct effect on inequality of the proportion of population of European descent, taking the estimations collected by Acemoglu et al. (2001) for the years 1900 and 1975. We then need to use additional instruments in order to correct for measurement errors and the potential endogeneity of the European settlement variable. As pre-vious regressions in table 4 have shown that distance from Equator, temperature and age of the first city play no role in inequality once pre-colonial density and quality of institutions are taken into account, we treat them as valid exogenous instruments for both the quality of institutions and the proportion of European descent population. Table 5.2 gives the instrumenting first-step regressions and Sargan overidentification test in Table 5.1 confirm the consistency between the chosen instruments. Table 5.1 shows again a non-linear inverted-U curve causal-ity running from the weight of European presence, whether in 1900 or in 1975, to present inequalities of income. The maximum of the inverted-U curve is reached around 40 percent of population being of European descent. Up to this level, Eu-ropean settlement has an unequalizing effect, either directly through pure racial discrimination in schooling or labor markets (see e.g. Lam, 1999 on the cases of Brazil and South Africa) or through more diffuse institutional externalities. As the four Neo-Europe countries are the only countries where this weight was over 0.6 in 1900, this non-linear relationship becomes upwardly linear when these countries are withdrawn from the sample. The right part of the table shows the estimation of this linear relationship. Interestingly enough, when the weight of European descent population is taken into account, the quality of institutions maintains its magnitude and significance even when Neo-Europe countries are withdrawn from the analysis. As before, the effect of pre-colonial density of population is not affected by the addition of this new variable.
[ Insert Tables 5.1 and 5.2 here ]
In sum, the direct effect of the quality of institutions on the Gini index is better identified when Neo-Europe countries are included. First, there is a strong causal relation running from settlers’ mortality, through the weight of European descent population, to the quality of capitalist institutions. Second, up to a certain level, the weight of European descent has by itself an unequalizing effect with coun-terbalances the equalizing effect of the quality of institutions. In North America and Oceania where both the settlers’ mortality and the pre-colonial population density were at their lowest levels, European settlers quickly made the majority of the population and built up capitalist institutions of the highest quality. In some countries where settlers’ mortality and/or indigenous density were a little
higher, Europeans also settled down but in lesser numbers (when they did not bring African slave population with them). In those regions, they constructed capitalist institutions of only average quality and more unequal social systems.
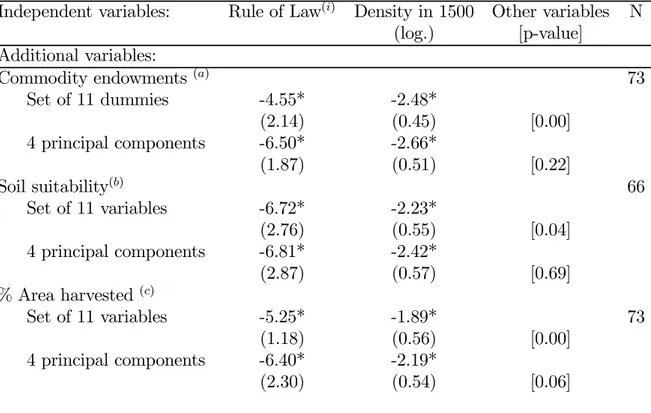
In Table 6, we turn to another and last robustness check for our basic rela-tion. We draw from the recent econometric contribution of Easterly (2002) which tests for the resource endowment thesis from Engerman and Sokoloff (1994, 2000, 2002; see introduction of this paper). Easterly extracts production data23 for a
set of 8 agricultural commodities (Bananas, Coffee, Maize, Millet, Rice, Rubber, Sugar Cane, Wheat) and 3 mineral commodities (Copper, Oil, Silver) and trans-forms it in a vector of 11 dummies indicating whether the country produces each commodity. He argues that these dummies of production do not change through time and are therefore exogenous; alternatively to the crop dummies, he also uses soil suitability estimations24 which are meant to be independent from (potentially
endogenous) production decisions. He uses this vector of resource endowments to explain (and instrument for) the share of the three middle quintiles of the dis-tribution of income, aside to the settlers’ mortality variable. We collected the same variables for agricultural commodities from the FAO databases and simi-lar variables for mineral production from Parker (1997). We also computed, for each agricultural commodity, the proportion of total arable land area harvested in 1961.25 We then tested for the influence of these three sets of resource
endow-ments indicators on our basic specification. Given the small size of the sample, the introduction of 11 dummies strongly reduces the number of degrees of freedom; this may make estimation problematic, for the effect of some dummies may in fact stand for some countries’ idiosyncrasies.26 We therefore made three preliminary
principal component analyses of each of the three sets of 11 resource endowments and retained the four first (orthogonal to each other) principal components. We then computed the GMM estimators results either with the raw set of commodity variables (11 variables) or with the principal components (4 variables).
[ Insert Table 6 here ]
23From FAOSTAT agriculture data: http://apps.fao.org/page/collections?subset=agriculture 24From FAO Global Agro-Ecological zones: http://www.fao.org/ag/AGL/agll/gaez/index.htm 25Our sample is different from Easterly’s, as we only use ’high quality’ (known methodology,
national coverage) inequality indexes. Its size is nevertheless larger because we do not introduce like him other variables like schooling or openness into the analysis. We present results for the Gini index, in order to deal with the largest sample, but taking the middle class share like Easterly changes nothing.
26For instance there are only five silver producers in our sample: Mexico, Peru, USA, Australia,
As far as our basic specification is concerned, the robustness check is unam-biguous. The effects of the ’governance’ variable and of the pre-colonial population density are left unchanged when resource endowments variables are introduced. Moreover, the resource endowments variables are jointly significant only when the raw set of 11 variables are considered, whatever their definition: production dummies, soil suitability, or proportion of area harvested. Principal components never come out as significant. This means that it is only the residual part of information brought about by the seven (11-4=7) last principal components of the ’resource endowments space’ which makes resource endowments have an ef-fect on inequality. This could be a matter of concern for the test of the resource endowment thesis, in which we shall not delve too much here. Let us just raise two additional doubts about Easterly’s test. First, production dummies are not completely time-invariant: within the 1961-98 period for which FAO data is avail-able, some countries begin or stop producing some commodities. The exogeneity of these resource endowments indicators is therefore questionable. In the case of minerals for instance, settlement colonization more often induced prospecting efforts together with railway building (see, e.g., Cogneau, 2003a, in the case of Africa). Second, the point estimates obtained are hard to interpret, in particular with regard to the ’scale economies’ story. For instance, in Easterly’s paper, oil production, aside to maize and millet, has a strong equalizing effect which may seem surprising, whereas rice has a strong unequalizing effect, aside to sugar cane and silver. Our estimates turn out to be completely different to Easterly’s, but not easier to interpret. As Easterly himself acknowledges, the list of 11 commodities he has selected is rather arbitrary. Lastly, we tried to add some other commodities where scale economies may also hold, at least at the processing stage: cotton, tea and tobacco; this did not change our conclusions.
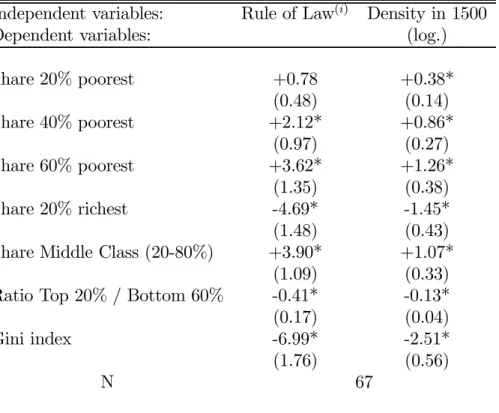
Table 7 puts another light on the effect of colonially-induced capitalist institu-tions on present inequalities. For many countries, the WIDER database not only provides Gini indexes but also quintiles’ shares of income.27 We may then estimate
our basic model at some points of the Lorenz curve of the income distribution. These estimations reveal that, even on the whole sample including Neo-Europe countries, the equalizing effect of the quality of capitalist institutions is not sig-nificant in the bottom of the distribution. Good capitalist institutions help to increase the income share of a large middle class ranging from the second quintile to the fourth quintile, but not the income share of the 20% poorest, and in fact hardly the income share of the second quintile. In contrast, the equalizing effect
of pre-colonial density reaches more than half of its potency on the 40% poorest, and three quarters of it on the 60% poorest. The fact that colonization-induced institutions are not pro-poor is of course reinforced in settlers colonies where the poorest are all of indigenous origin.
[ Insert Table 7 here ]
Lastly, we turn to the interpretation of the pre-colonial population density effect. Throughout this paper, we have already given hints about the fact that the effect of this variable on inequalities may stand for pre-colonial institutions unrelated to the capitalist institutions whose quality is measured by available ’governance’ databases. As we have seen, pre-colonial density does not play any direct role in GDP per capita or in life expectancy differentials that is not medi-ated by capitalist institutions quality. Besides, there is no significant link between the present density of population and the pre-colonial one. As table 8 shows, the pre-colonial density of population is, beside the settlers’ mortality, correlated with a lot of post-colonial institutional dimensions. The first two lines of table 8 recall us that densely populated countries were less often colonized and when they were it was for a shorter period. As the third line also shows, European could not settle in large numbers in these countries, even when settlers’ mortality was low. The fourth line recalls that a large population density in 1500 is correlated with an early start of State institutions; on the other hand, European settlers immediately built structured States but also most often obtained their formal independence earlier in history, this explaining the negative impact of the early mortality of settlers on the antiquity of the State. Then the fifth line shows that ethnic fractionalization is positively correlated to settlers’ mortality and negatively to pre-colonial density.28
The strong positive association of ethnic fractionalization with settlers’ mortality probably reflects the ’divide and rule’ strategy that Europeans colonial powers had to adopt in places where they did not settle in numbers, as outlined in section 2.2. The association with pre-colonial density conversely reflects the pre-colonial cohesiveness of densely populated and early developed regions where cultural and linguistic differentiation was limited by frequent social interactions.29 The
fol-lowing line shows that densely populated countries in 1500 more often adopted a mixed economic system (as coded by Barro, 1991) during the post-War period
28This observation allows us to raise some doubts about the exogeneity of ethnic
fractional-ization to long-run economic and institutional development indicators, in contrast with what is asserted by Alesina et al. (2002) and more in line with Miguel (2003).
29The two coefficients are left unchanged even when we introduce latitude, arable land size,
than others. Here we might again see a sign of resistance to Western or colonial influence; they however did not choose more often a socialist system. In the six bottom lines of the table come the six quality of institutions dimensions in the typology of Kaufman and coauthors. Here again we see that densely populated regions in 1500 ended with worse capitalist institutions, or worse political institu-tions at least from the European standpoint, in all dimensions. From the results of this table, a lot of institutional variables are potential candidates to stand for the institutional medium through which pre-colonial density has an equalizing im-pact on the distribution of income. It could be the short duration of the colonial intrusion, the antiquity of the State, the ethnic homogeneity, the mixed economic system, or one of the five Kaufman’s dimension that we have up to now omitted in our regressions.
[ Insert Table 8 here ]
However, none of these variables pass the test when we introduce them aside to the density of population in our basic specification (see Table 4 for the antiquity of the State variable). A proper test however calls for instrumenting each of them by another variable than population density. In the two cases of the length of colonial rule and of the antiquity of the State, we use the age of the first pre-colonial city. When instrumented that way and confronted with the population density effect, the effects of the two variables are again cancelled out, like in the Table 2 OLS results. In the case of the weight of the population from European descent, we have already shown that this variable has an unequalizing effect that is indepen-dent enough from pre-colonial population density and that is more linked to the quality of institutions effect (see above, Tables 5.1 and 5.2). For ethnic fractional-ization, distance from Equator and arable land size are valid instruments. When instrumented, it does not comes out either as a significant determinant of present inequality. As for the mixed economic we did not find any acceptable instrument, but its OLS correlation with the Gini index is small (-0.09) and completely in-significant. Finally, the five remaining dimensions of the Kaufman et al. database are so closely correlated one with each other, with correlation coefficients ranging from +0.57 to +0.89, that it seems difficult to disentangle their respective effect. Most importantly, like the ’rule of law’ dimension, they are all correlated nega-tively with the Gini index and with the pre-colonial population density. Taken at face value, this latter fact does not make them ideal candidates for explaining the equalizing impact of the pre-colonial population density.
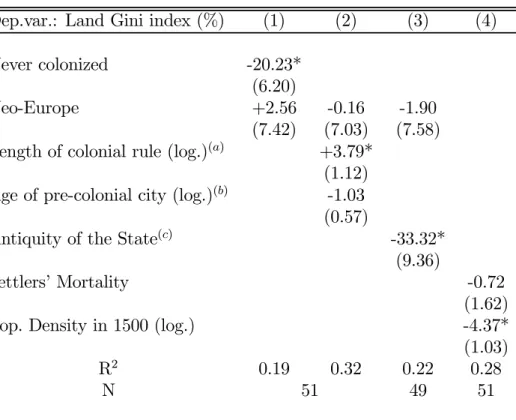
The same is not true for the last variable whose colonial and pre-colonial determination are examined in Table 9, the Gini index of the distribution of land
holdings during the 1960-70 period. Although on a much smaller sample of 51 countries30, the correlation between the income Gini and the land Gini reaches
+0.34. The correlation of land Gini with precolonial population density is -0.53.31 These two facts make the land Gini a good candidate for the mediation of
the pre-colonial population density equalizing effect. The importance of the size distribution of landholdings for growth and for poverty reduction has already been stressed by many authors.32 Bourguignon and Morrisson (1998) also show that
inequality in the size distribution of land assets has a strong influence on income inequality in LDCs, even once controlled for a traditional quadratic Kuznets curve effect.33 As Table 9 shows, the longer the colonial rule was the more unequal the
present land distribution is. Interestingly enough, the land Gini is not significantly higher in Neo-Europe countries and is not correlated with the settlers’ mortality whereas it is strongly correlated with the pre-colonial population density. Besides, countries which were never colonized have a more equal land distribution, with a land Gini index that is about 20 points lower on average.
[ Insert Table 9 here ]
Sparsely populated countries had vast areas of arable land which could be ap-propriated by European permanent settlers or, when settlers’ mortality was too high, which the colonial ’divide and rule’ strategy concentrated in the hands of docile chiefs or landlords. Furthermore, the Hecksher-Ohlin/Stolper-Samuelson story tells that the growth of trade, at least since the mid-19th century, made land returns raise in relatively land abundant countries and labor returns raise in relatively labor abundant countries (see e.g. O’Rourke and Williamson 1999 and 2002). This evolution should have reinforced the correlation between population density and inequalities.34 In sparsely populated countries with an unequal dis-tribution of land, large landowners got higher prices for their land in comparison
30See Appendix B.2 for details.
31While it comes out as only weakly linked with present population density with a correlation
coefficient of -0.23.
32See, e.g., Deininger and Olinto, 2000.
33In contrast with them, we did not find any correlation whatsoever between the level of income
inequality and the level of income dualism against agriculture, as measured by the relative labor productivity of agriculture vs. other sectors. Measurement errors may explain this surprising result.
34Spilimbergo, Londoño and Székely (1999) find a positive impact of (present) relative land
endowments on the inequality of income. The effect they find is however more pronounced in closed economies. We looked at the correlation of two indicators of openness (share of trade in GDP in PPP terms, Frankel-Romer potential trade) with both the inequality of income and the pre-colonial population density but found no significant link whatsoever.
with indigenous smallholders, not forgetting underpaid forced indigenous labor and slave labor. In densely populated countries with a more equal distribution of land, smallholders using their own labor got higher prices.35 In the absence of large
land reforms in the post-colonial period, a rather stable intergenerational trans-mission of land assets should have contributed to the persistence of landholdings inequalities. These inequalities also translated intergenerationally in inequalities in physical and human capital.
[ Insert Table 10 here ]
In Table 10, we examine the substitution of land inequality for pre-colonial population density in our basic specification for inequality of income. When pop-ulation density in 1500 is treated as an instrument for present land inequality (GMM1 estimations of the table), we observe that the effect of land inequality is re-estimated upward with a coefficient which is more than doubled (comparing GMM1 and OLS). This is revealing that the naive correlation between the income Gini and the land Gini understates the causal relationship running from the latter to the former. We may see in this result the redistrbution efforts that countries with an unequal land distribution were compelled to undertake in order to reduce poverty. The coefficient of ’rule of law’ is left unchanged: low and insignificant for the share of the 40% poorest, important for the middle class share and the Gini index. We finally made an attempt to split the effect of pre-colonial population density on inequalities into an indirect effect mediated by land inequality and a di-rect effect potentially mediated by another institution, by instrumenting the land Gini by the same geographical instruments as for weight of the European descent population (see Table 5.2, distance from Equator, distance from Equator squared, average temperature, age of the first city founded before 1500). We obtain half-satisfactory results (GMM2 estimates). While Sargan tests for overidentification confirm the coherency of instruments, the coefficients of the two variables in com-petition are difficult to identify precisely. At the 5 percent level, they both most often loose in magnitude and in significance. However, the land inequality coef-ficient seems to resist a little more. First, it remains significant at the 5 percent level in the explanation of the 40% poorest share of income. Second, in the expla-nation of the middle class share or of the Gini index, it is significant respectively at the 12 and 10 percent levels. We are thus left with a half-empty and half-full
35Even inside a densely populated country like India, Banerjee and Iyer (2002) give indications
that Indian districts which were placed under a landlord indirect rule rather than a direct British rule had (i) a more unequal ditribution of land during the colonial period, (ii) ended today with higher inequalities, lower agricultural productivity, and a lower supply of public goods.
glass. Although this land inequality story may seem intellectually satisfying and theoretically parsimonious, it is nevertheless far from being granted empirically. First, it is based on a small sample of countries. Second, the identification problem still stands.
However, the idea that the effect of the pre-colonial population density or early development on present inequality of income is purely indirect and mediated by present (and past) land distribution is not rejected by the data. Moreover, as far as the overall distribution of income is concerned, our estimates give similar magnitudes to the ’good governance’ effect and to the land distribution effect. With the GMM1 estimates of Table 9, a one standard deviation variation in both variables (0.8 for the rule of law index, 15 points for the land Gini index) lead to close variations in the Gini index of income (5 or 6 points). At the bottom of the distribution (40% poorest), the land inequality effect however strongly predominates.
4. Conclusion
In keeping with the emerging "institutional paradigm" in development economics, this paper has examined whether it can be said that income inequality shares the same institutional determinants as ’level of development’ variables (like GDP per capita, life expectancy, schooling). Like relative average development, national in-equality levels have been shown to be rather stable over time (see, e.g., Deininger and Squire 1996 and 1998). This stability might be attributed to the persistance of historical institutions. Even if we focus here on the causality running from in-stitutions to inequality, our approach does not preclude the existence of an inverse relationship running from inequality shocks to institutional change. The histori-cal work of Engerman and Sokoloff (op. cit.) and the recent econometric paper from Easterly (op. cit.) put more stress on this latter causality.36 The question
we asked is whether an improvement of ’governance standards’ like legal systems would bring a decrease in inequality as a secondary benefit. On this point, our
36Djankov et al. paper (2003) also view changes in inequality of wealth as determining changes
in institutions through shifts in their ’Institutional Possibility Frontier’. Accodring to them, institutions result from a trade-off between ’disorder’ and ’dictatorship’ (which substitutes for the old ’efficiency/equity’ trade-off of public economics). An exogenous rise of inequality, led for instance by technological change, may call for an increase in State control in order to restore the balance between ’social losses due to private expropriation’ and ’social losses due to State expropriation’ that minimize total losses. Conversely, one can think that States are compelled to make redistributive efforts in order to build and to preserve their ’legitimacy’.
results suggest with insistence that ’good governance’ standards miss an impor-tant determinant of income inequality which has something to do with agrarian issues and with asset inequality. Like ’bad governance’, asset inequality has a long history that can be traced back to the features of European colonialism. Colonies where Europeans could not settle in numbers because of a high level of mortality rates inherited extractive institutions and bad governance (cf. Acemoglu et al. op. cit.). And also, colonies which were sparsely populated and underdeveloped at the beginning of the colonial period inherited unfair institutions and an unequal distribution of assets. Well-functioning capitalist institutions play undeniably a great role in the promotion of growth, of health improvements and of educational advances. It is shown here that they indeed also contribute to the reduction of income inequalities. However they may not be able to solve all the problems raised by a highly unequal initial distribution of endowments. In regions of the world which were sparsely settled and underdeveloped at the beginning of European col-onization, the institutional shock brought about by European settlers printed a durable mark on the distribution of assets. In these regions, the progress towards the equality of opportunities for income, health or education37 may stay out of
reach if policies focus exclusively on ’good governance’ issues.38 Much research
is warranted to progress on these questions. As international comparisons with macro-data quickly reveal their limits, further research should go down at the local/regional level and combine historical and micro-data.
37Equality opportunities always imply a kind of redistribution of assets, and redistribution
of assets frequently although not always involves a redistribution of income. For instance, as far as parental income determines the health and the schooling of children, parental income redistribution may be needed to equalize opportunities for future income, health or education. See, e.g., Cogneau, 2003b.
38As might be the case if the ’law and finance’ movement fails in dealing with the large
inequalities which prevail in Latin America. See Dezalay and Garth (2002) for a sociological analysis of the exportation of this school of thinking.
a
r
ia
b
le
s
d
e
fi
ni
ti
ons
a
nd
so
urc
e
s
V A R IA B L E S D E F IN IT IO N S O U R C E index o n exp enditures h ig h q ual it y o n ly , co rrected when in come data (s ee b el o w) W IDE R d atabas e (2002) in tile shares on exp endit ures hi gh qual it y o nl y, co rrected when in come data (s ee b el o w) W IDE R d atabas e (2002) Gini index o n landhol di ng si ze di stri buti on, ext ra p o la te d (see b el o w ) D eininger et al . (20 00) + B ourguignon et a l. (1 998) P p er capit a , P P P te rm s curren t in ternati o n a l $ , in y ear o f o bs. o f the Gini inde x C helem d atabase (2002) exp ec tanc y at bi rt h in y ea r o f o b s. o f the G ini in dex W orl d Dev elopm en t Indicators (2000) erage y ea rs o f sc h o o li ng 1990 of age 15-60 p o pul a ti on Co hen a nd Soto (2 001) pu la tion den sit y T ot.P op. b y u n it o f A rable land , in y ear of ob s.of Gini inde x W orl d Dev elopm en t Indicators (2000) ni za tion rate % o f u rban p o p. in to tal p op., in y ear of obs. of G ini in dex W orl d Dev elopmen t Indicators (200 0) of La w & othe r G o v ernanc e S cores col lec te d and extrap o late d from v arious so urces K aufman, K ra a y, Z oi do-L obatón (200 2) pul a tio n dens it y 1 500 T o tal p opulati o n in 1 500 divided b y a rable la n d a rea A cemoglu et a l. (2002 ) tlers mort alit y L og. mo rt ali ty o f E ur. S ettl ers , extrap o lat ed (see b elo w) Acemoglu et a l. (200 1)+ o ur o w n extrap o la tion P op. o f E ur. D es cen t % in total p o pulati o n in 1 900 or in 197 5 A cemoglu et a l. (200 1) o f p re-colonia l ci ty L og. o f ti me p er. b et w . foundat ion & 150 0, = 0 if after 1500 P a rk er (19 97) g th of col o nial rule Log. of ti m e p er. b et w . con quest a nd ind ep ende nce O u r o w n com putat ion tiquit y o f the Stat e D is coun ted time p erio d o f exis tence of a st ructured S tat e Bo ck st ette, C handa, P ut terma n (2002) o ni al ori g in dummi es Nev er col oni zed, former B riti sh, F renc h, Spanis h o r O thers O ur o w n co d ing n ti n en ta ld u m m ie s A fr ic a ,A m er ic a ,A si a , O ce a n ia O u r o w n co d in g F ract ional izati o n H er fi ndahl index Ales ina et a l. (2 002) ance from equa tor P a rk er (19 97) erage temp erature P a rk er (19 97) la nd area, L and a rea in square k il om eters W orl d Dev elopm en t Indicators (2001) ix ed economi c system D umm y v a riable Ba rro (199 1) m m o dit y endo w m en ts inera l endo w men t dummies exi stence o f reserv es in 3 minerals in 1 990s (s ee li st in te xt ) P ark er (19 97) endo wmen t d ummi es pro duct ion of 8 agr ic ult u ra l commo di ties in 19 98 (s ee li st in text) F A O St atis tical d a tabase (20 02) su it abil it y in d ex for crop s at m ixed lev el of inpu t a n d under rai n-fed co n dit ions F A O St atis tical d a tabase (20 02) harv es ted in eac h crop in % o f tota l a rable land a rea in 1 9 6 1 F A O St atis tical d a tabase (20 02)B. Details on some variables construction
B.1. Gini index and quintile shares of expenditures
Inside the WIDER database, we selected only data from large sample surveys with known methodology and national coverage (’high quality data’ in the terminology of Deininger and Squire, 1996) For each country we kept the latest data available for the Gini index within the 1980-98 period. For only 4 countries the latest high quality Gini index available is before 1988. Data for GDP per capita in PPP terms, life expectancy at birth, urbanization rate and contemporary population density were collected for the year of observation of the Gini index. For countries for which a Gini index was available, we then extracted the quintile shares of the income distribution. Years of observation are not always the same for quintile shares than for Gini indexes. When the indexes were computed from income data rather than from expenditures, we substracted 6 percentage points from the Gini index as Deininger and Squire (1996) recommend, and substracted 2, 1.5 and 1.5 percentage points respectively from the 1st, 2nd and 3rd quintiles.
B.2. Gini index of landholding size distribution
The Deininger and Olinto (2002) dataset of land Gini indexes for the period 1960-70 intersects with only 39 countries of our original sample of 73 countries. The Bourguignon and Morrisson (2000) dataset for the 1970-80 period gives us a ’small and medium farmers share’ for an additional set of 12 countries. Its intersection with the 39 countries sample makes possible to estimate a simple linear regression on 27 countries relating the land Gini index to Bourguignon and Morrisson’s ’small and medium farmers share’:
LGIN I =−0.39
(0.08) SM F ARM + 95.7 (B.1)
R2 for this linear relationship reaches 0.47. For the 12 additional countries we
then extrapolated the land Gini using the predictor given by this simple regression. B.3. Settlers’ mortality extrapolation
We had to extrapolate mortality of early settlers for former colonies which are not covered by the Acemoglu et al. (2001, 2002) sample. We also had to extrapolate a potential settlers’ mortality for the seven countries which were never directly colonized.
Burundi was given the same settlers’ mortality as Rwanda.
Guinea-Bissau was given the same settlers’ mortality as Guinea (Conakry). Lesotho was given the same settlers’ mortality as South Africa.
Malawi and Zambia were given the same settler’s mortality as Kenya. Zimbabwe was given the average of South Africa as Kenya.
Cambodia and Lao were given the same settlers’ mortality as Vietnam. Philippines was given the same settlers’ mortality as Indonesia.
Thailand was given the average of Malaysia and Vietnam.
China, Iran, Japan, Korea, Taiwan and Turkey were given the same settlers’ mortality as Malaysia.
References
[1] Acemoglu D., S. Johnson, J.A. Robinson, 2001, The Colonial Origins of Com-parative Development: An Empirical Investigation, American Economic Re-view, 91(5), 1369-1401
[2] Acemoglu D., S. Johnson, J.A. Robinson, 2002, Reversal of Fortune: Geogra-phy and Institutions in the Making of the Modern World Income Distribution, Quarterly Journal of Economics, 117(4), 1231-1294.
[3] Acemoglu D., S. Johnson, J.A. Robinson, Y. Tchaicharoen, 2003, Institu-tional causes, macroeconomic symptoms: volatility, crises and growth, Jour-nal of Monetary Economics, 50(1), 49-123.
[4] Aghion P., E. Caroli, C. García-Peñalosa, 1999, Inequality and Economic Growth: The Perspective of New Growth Theories, Journal of Economic Literature, 47(4), 1615-1660.
[5] Alesina A., E. Glaeser, B. Sacerdote, 2001, Why Doesn’t the US Have a European Style Welfare State, Brookings Papers on Economic Research, Fall. [6] Alesina A., A. Devleeeschauwer, W. Easterly, S. Kurlat, R. Wacziarg, 2002,
Fractionalization, NBER WP 9411.
[7] Banerjee A.V. and Duflo E., 2000, Inequality and Growth: What Can the Data Say? NBER WP 7793.
[8] Banerjee A., L. Iyer, 2002, History, Institutions and Economic Performance: The Legacy of Colonial Land Tenure Systems in India, MIT, Working Paper 02-27.
[9] Barro R J., 1991, Economic Growth in a Cross-Section of Countries, Quar-terly Journal of Economics, 106(2), 407-444.
[10] Bingswanger H.P., K. Deininger, G. Feder, 1995, Power, Distortions, Re-volt and Reform in Agricultural Land Relations, in Behrman J. and T.N. Srinivasan (eds), Handbook of Development Economics, Volume III, North-Holland.
[11] Bockstette V., A. Chanda, L. Putterman, 2002, States and Markets: The Advantage of an Early Start, Journal of Economic Growth, 7(4), 347-369.
[12] Bourguignon F., C. Morrisson, 1990, Income distribution, development and foreign trade, European Economic Review, 34(6), 1113-1132.
[13] Bourguignon F., C. Morrisson, 1998, Inequality and Development: The Role of Dualism, Journal of Development Economics, 57(2), 233-258.
[14] Cogneau D., Ch. Guénard, 2002, Can a Relation Be Found Between Inequality and Growth? DT DIAL 2002/03, 39 pp.
[15] Cogneau D., 2003a, Colonisation, School and Development in Africa - An Empirical Analysis, DIAL WP 03/01.
[16] Cogneau D., 2003b, Poverty, Inequality of conditions and inequality of op-portunities — Chances and risks of new poverty reduction strategies, in Cling J.-P., M. Razafindrakoto, F. Roubaud (eds), New International Povery Re-duction Strategies, Routledge.
[17] Cohen D., M. Soto, 2001, Growth and Human Capital: Good Data, Good Results, Technical Paper 179, OECD Development Centre.
[18] Deininger K., P. Olinto, 2000, Asset distribution, inequality and growth, Rural Development Research Group Working Paper, World Bank.
[19] Deininger K., L. Squire, 1996, A New Data Set Measuring Income Inequality, The World Bank Economic Review, 10(3), 565-591.
[20] Deininger K. and Squire L., 1998, New Ways of Looking at Old Issues: In-equality and Growth, Journal of Development Economics, 57, 259-287. [21] Dezalay Y. , B. G. Garth, 2002, The Internationalization of Palace Wars:
Lawyers, Economists, and the Contest to Transform Latin American States, Chicago Series in Law and Society, University of Chicago Press.
[22] Djankov S., E. Glaeser, R. La Porta, F. Lopez-de-Silanes, A. Shleifer, 2003, The New Comparative Economics, World Bank Policy Research Working Pa-per 3054, May.
[23] Easterly W., 2002, Inequality does Cause Underdevelopment: New evidence, Center for Global Development Working Paper n◦1.
[24] Engerman S. L., Sokoloff K. L., 1994, Factor Endowments, Institutions and Differential Paths of Growth Among New World Economies: A View From Economic Historians of the United States, NBER Historical Papers #66. [25] Engerman S. L., Sokoloff K. L., 2002, Factor Endowments, Inequality and
Paths of Development Among New World Economies, NBER WP 9259. [26] Goody J., 1996, The East in the West, Cambridge University Press.
[27] Horowitz D. L., 2000, Ethnic Groups in Conflict, University of California Press (1st edition 1985).
[28] Iyer L., 2002, The Long-term Impact of Colonial Rule: Evidence from India, Department of Economics MIT, unpublished paper.
[29] Kaufman D., A. Kraay, P. Zoido-Lobatón, 1999a, Aggregating Governance In-dicators, World Bank Policy Research Department Working Paper No. 2195. [30] Kaufman D., A. Kraay, P. Zoido-Lobatón, 1999b, Governance Matters, World
Bank Policy Research Department Working Paper No. 2196.
[31] Kaufman D., A. Kraay, P. Zoido-Lobatón, 2002, Governance Matters II: Updated Indicators for 2000/01, mimeo, World Bank.
[32] La Porta R., F. Lopez-de-Silanes, A. Shleifer, R. Vishny, 1999, The Quality of Government, Journal of Law, Economics and Organization, 15(1), 222-279. [33] Lam D., 1999, Generating Extreme Inequality: Schooling, Earnings and
In-tergenerational Transmission of Human Capital in South Africa and Brazil, Population Studies Center, Report No. 99-439, University of Michigan. [34] Lee W., J. Roemer, 2002, Electoral Consequences of Racialism for
Redistri-bution in the United States, 1972-1992, mimeo, Northern Illinois University and Yale University.
[35] Mc Evedy C., R. Jones, 1978, Atlas of World Population History, Facts on File.
[36] Maddison A., 2001, The World Economy, A Millenial Perspective, OECD. [37] Miguel E.,2003, Tribe or Nation? Nation-Building and Public Goods in Kenya