de
l
'
Document de travail
GLOBAL FINANCIAL CRISIS: THE FRENCH POLICY
ANSWER IN A EU PERSPECTIVE
N° 2009-32
NOVEMBRE
2009
Catherine MATHIEU OFCE Henri STERDYNIAK OFCE Université Paris Dauphine, SDfi-LEDaGlobal financial crisis: the French policy answer
in a EU perspective
*Catherine Mathieu
Observatoire Français des Conjonctures Economiques
Henri Sterdyniak
Observatoire Français des Conjonctures Economiques Université Paris Dauphine, SDfi-LEDa
Abstract:
The 2007-2009 crisis has led to a return of Keynesian analyses and policies. The paper analyses the contradictions between a structural crisis, the implementation at a very large scale of Keynesian policies and the denial to undermine financial capitalism. The crisis has led the French government to endorse French traditional views according to which government actions have a major role. Although stimulus measures have been limited in France, the economy has been less affected than others thanks to the size of its automatic stabilisers and financial and economic archaisms. However the French government has not abandoned the objective of large public expenditure cuts. European authorities have had to admit that public deficits would rise but they have not implemented coordinated stimulus policies. EU countries are still requested to bring their budgetary positions back into balance, independently of economic developments. Yet the rise in public deficits and debts has not generated any rise in long-term interest rates and in inflation expectations. Two main issues remain: can fiscal and monetary policies alone be expected to boost activity if the roots of the crisis lie in structural imbalances? Will fiscal exit strategies be an opportunity for leading classes to cut massively social and public expenditures?
Résumé : La crise financière des années 2007-2009 a conduit à un retour en force des analyses et des
politiques keynésiennes. L’article analyse les contradictions entre une crise de nature structurelle, la mise en œuvre à une très large échelle de remèdes de type keynésien et le refus de remettre en cause le capitalisme financier. La crise a amené le gouvernement français à retrouver les positions françaises traditionnelles sur l’importance des interventions publiques. Les mesures de soutien à l’activité ont été limitées, mais la France a été protégée par l’importance de ses stabilisateurs automatiques et ses
archaïsmes économiques et financiers. Le gouvernement n’a toutefois pas renoncé à l’objectif de
fortes réductions des dépenses publiques. Les instances européennes se sont résigné au gonflement des déficits publics, mais n’ont guère organisé une stratégie coordonnée de relance. Elles continuent à réclamer des engagements de retour à l’équilibre des finances publiques, indépendamment de l’évolution conjoncturelle. Pourtant, la hausse des déficits et des dettes publiques n’a pas provoqué de hausse des taux longs et des anticipations d’inflation. Deux grandes questions demeurent : les politiques budgétaires et monétaires de soutien peuvent-elles permettre à elles seules de relancer la croissance si la crise est causé par des déséquilibres structurels ? Les classes dirigeantes réussiront-elles à utiliser le déséquilibre actuel des finances publiques pour réduire massivement les dépenses publiques et sociales ?
JEL code: E62
Keywords: Financial crisis, fiscal policies, French economy, EU economies.
*
This paper was prepared for the 13th Conference of the Research Network ‘Macroeconomics and Macroeconomic Policies’ (FMM): ‘The World Economy in Crisis - The Return of Keynesianism?’, Berlin, 30-31 October 2009.
1. Introduction
The 2007-2009 crisis has led to a return of Keynesian analyses and policies, which contrasts with the 1980-2007 period when liberal analyses and policies were prevailing. However, this return of Keynesian analyses and policies may soon come to an end, since the pre-crisis mainstream liberal views were matching the interests and policies of new leading classes, the winners of financial and economic globalisation. In France, Nicolas Sarkozy’s government had the objective of introducing a break in the French model, based on large public spending and taxation, assumed to be detrimental to labour, savings, investment and competiveness. But the crisis has led the government to change their objectives and call for a re-foundation of capitalism, which would reduce the weight of finance at the benefit of entrepreneurs and workers. The paper analyses the contradictions between a structural crisis, the implementation of Keynesian policies at a very large scale and the denial to undermine financial capitalism. Section 2 puts in contrast the Keynesian features and the structural causes of the crisis: the growth model chosen by the winners of globalisation, China’s and Germany’s mercantilism, the rise in inequalities associated with rising indebtedness and financial bubbles in Anglo-Saxon economies; financial globalisation boosted by greedy and adventurous financial institutions. Keynesian remedies proposed and implemented in G-20 countries are described. Section 3 focuses on French specificities: the weight of taxes and public spending, a large redistribution, persisting large public deficits, the difficulty of implementing liberal reforms. Structural fiscal policies implemented before the crisis are analysed: tax cuts, followed by spending cuts, efforts to generate a supply shock. The crisis has led the French government to endorse French traditional views on the importance of world governance, on financial regulation, on government support to domestic industries, on social protection. Stimulus measures have been limited, and hardly targeted on the victims of the crisis: the unemployed, especially the young, companies and industry sectors in difficulty. But the French economy was less affected than other economies thanks to the size of its automatic stabilisers and financial and economic archaisms. The government has let the public deficit and debt rise, but has not abandoned the objective of large public expenditure cuts, which it could impose in the coming years under the EU commitments of bringing back budgetary positions into balance. Section 4 analyses the EU strategy during the crisis. European authorities have had to admit that public deficits would rise but they have hardly implemented coordinated stimulus policies. Fiscal stimulus packages have been much smaller in the euro area than in the US or in the UK. The EU Commission still requests Member States to bring their budgetary positions back into balance, independently of economic developments. The Commission does not draw lessons from the crisis and maintains its liberal reforms strategy. Several economists recommend cutting public deficits through large spending cuts (and not through higher growth or wealth and speculative profit taxation). They call for governments to reassure markets by announcing large cuts in pensions and health expenditure. Yet the rise in public deficits and debts has generated no rise in long-term interest rates and in inflation expectations.
Two main issues remain: can fiscal and monetary policies alone be expected to boost activity if the roots of the crisis lie in structural imbalances? Will fiscal exit strategies be an opportunity for leading classes to cut massively social and public expenditures?
2. Economic policies in the crisis
2.1. Short-term and structural issues
The 2007-2009 crisis can be analysed as a Keynesian crisis of insufficient demand. The fall in equity prices has led to a substantial fall in households’ wealth. The impact was particularly large in Anglo-Saxon economies, where households hold a larger amount of equities, where a large part of retirement pensions is based on pension funds. Under the effects of the banking crisis, banks in difficulty had to cut lending to households and companies. The equity market crisis reduced the value of companies and hence made them financially more fragile, which reduced their capacity to borrow. Growth prospects were rapidly downgraded. Companies reduced their investments. The fear of unemployment led households to increase their savings ratio. Lower spending led output and incomes to fall. The crisis has spread around the world through foreign trade contraction and flight to quality in financial markets, which limited the capacity of many emerging countries to borrow.
The world economy entered a depressive spiral, the opposite of the strong growth that had taken place under the effects of trade globalisation, financial globalisation and rapid economic growth of emerging countries in the 1995-2007 period.
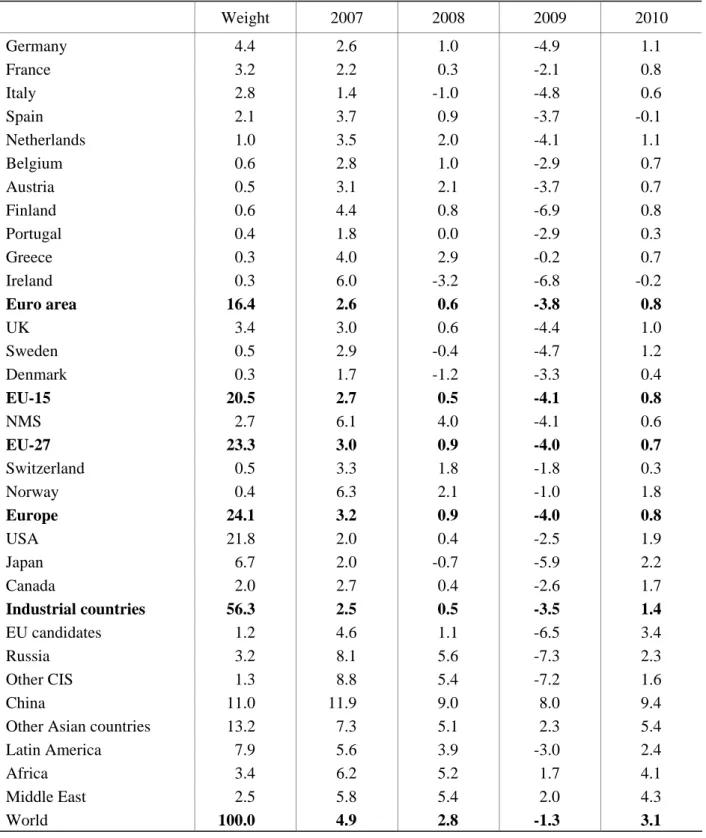
All countries were affected but the output fall was especially dramatic in Russia, the NMS, Ireland, Finland, Spain, Sweden and UK while it was relatively limited in the US, France, Portugal and Africa (see Table 1).
Expansionary monetary and fiscal policy answers are needed to tackle the crisis. Central banks have responded by cutting their base rates to lowest floors: 0-0.25% for the Fed, 0.1% for the Bank of Japan, 0.5% for the Bank of England, 1% for the ECB. Besides, central banks have provided huge liquidity to banks; they have provided support to financial markets in difficulty through widening their refinancing conditions; they have used non conventional tools to signal clearly to financial markets that they will durably maintain low interest rates. In many countries, governments intervened by recapitalizing banks and guaranteeing their deposits and their loans.
Active fiscal policies have then been implemented to such an extent that according to the June 2009 OECD estimates, fiscal deficits will exceed 6% of GDP in 2010 in almost all large economies, reaching 14% of GDP in the UK, 11% in the US, 8.7% in Japan, 8.5% in France, 7% in the euro area, 6% in Italy and Germany.
The crisis has destroyed the liberal point of view that the market economy was fundamentally stable and did not need government interventions. The view according to which only supply policies matter and demand policy should be restricted to monetary policy alone was forgotten. Policy-makers now agree that fiscal polices are needed to get out of the crisis.
Table 1. GDP Growth Prospects, in % Weight 2007 2008 2009 2010 Germany 4.4 2.6 1.0 -4.9 1.1 France 3.2 2.2 0.3 -2.1 0.8 Italy 2.8 1.4 -1.0 -4.8 0.6 Spain 2.1 3.7 0.9 -3.7 -0.1 Netherlands 1.0 3.5 2.0 -4.1 1.1 Belgium 0.6 2.8 1.0 -2.9 0.7 Austria 0.5 3.1 2.1 -3.7 0.7 Finland 0.6 4.4 0.8 -6.9 0.8 Portugal 0.4 1.8 0.0 -2.9 0.3 Greece 0.3 4.0 2.9 -0.2 0.7 Ireland 0.3 6.0 -3.2 -6.8 -0.2 Euro area 16.4 2.6 0.6 -3.8 0.8 UK 3.4 3.0 0.6 -4.4 1.0 Sweden 0.5 2.9 -0.4 -4.7 1.2 Denmark 0.3 1.7 -1.2 -3.3 0.4 EU-15 20.5 2.7 0.5 -4.1 0.8 NMS 2.7 6.1 4.0 -4.1 0.6 EU-27 23.3 3.0 0.9 -4.0 0.7 Switzerland 0.5 3.3 1.8 -1.8 0.3 Norway 0.4 6.3 2.1 -1.0 1.8 Europe 24.1 3.2 0.9 -4.0 0.8 USA 21.8 2.0 0.4 -2.5 1.9 Japan 6.7 2.0 -0.7 -5.9 2.2 Canada 2.0 2.7 0.4 -2.6 1.7 Industrial countries 56.3 2.5 0.5 -3.5 1.4 EU candidates 1.2 4.6 1.1 -6.5 3.4 Russia 3.2 8.1 5.6 -7.3 2.3 Other CIS 1.3 8.8 5.4 -7.2 1.6 China 11.0 11.9 9.0 8.0 9.4
Other Asian countries 13.2 7.3 5.1 2.3 5.4 Latin America 7.9 5.6 3.9 -3.0 2.4
Africa 3.4 6.2 5.2 1.7 4.1
Middle East 2.5 5.8 5.4 2.0 4.3
World 100.0 4.9 2.8 -1.3 3.1
Source: OFCE forecasts, October 2009.
However, the nature of the crisis needs to be addressed. The origins of the crisis lie in fundamental imbalances of the world economy, directly linked to production, trade and financial globalization. Is it possible to get out the crisis without questioning the functioning of the recent global financial capitalism?
– Anglo-Saxon economies have opted for a growth strategy characterised by the stagnation of wage earnings and incomes of most households and rising income inequalities (table 2) offset by rising households’ indebtedness and financial and housing bubbles. US have supported this type of growth through maintaining low real interest rates which allowed for rising indebtedness and generated rises in assets prices.
– A large number of countries, like Germany and China, have implemented a “mercantilist” growth strategy based on external demand with low domestic wages and the accumulation of external surpluses. Their growth occurred at the detriment of trade partners who had to accumulate deficits.
Table 2. Interdecile ratio D9/D1
1985 2005 United States 5.5 5.9 Italy 3.9 4.3 United Kingdom 3.8 4.2 Germany 3.0 4.0 France 3.6 3.4 Sweden 2.4 2.8 Source: OECD.
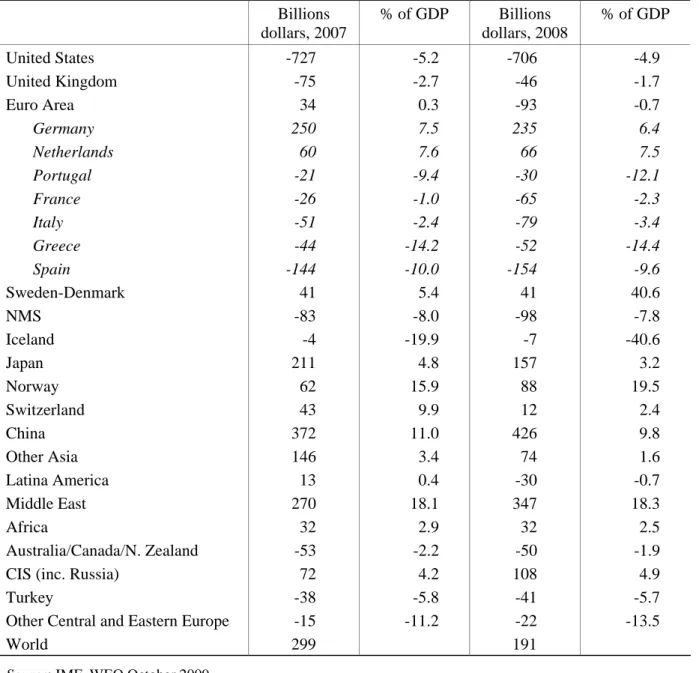
The configuration of the current account was deeply unbalanced (table 3). The countries (China, Germany) which based their growth on exports accumulated huge external assets while the Anglo-Saxon countries, able to attract foreign capitals, due to their sophisticated financial system, accumulated unsustainable deficits. Many emerging countries were unwilling to rely on financial markets spirits and to be at risk of asking support from IMF, chose to accumulate surpluses.
The countries which had based output growth on wage restraint and external surpluses created a shortfall of aggregate demand which had to be compensated. In the years before the crisis, this has been done by public deficits in some countries, by low interest rates driven by the US Federal Reserve policy which induced the development of private credit and financial and real estate bubbles. Due to trade globalization and leading classes’ interests, countries refused to support demand by increasing wages or social expenses.
The US economy massively supported world growth; the US external deficit was a more a sign of growing imbalances than a medicine for reducing world imbalances. The US became progressively unable to continue to play a leadership role in terms of global growth.
The economic developments in the years 1995-2007 led to deep macroeconomic and financial imbalances, which was neither satisfactory nor stable.
Table 3. Current account balances, in 2007 and 2008 Billions dollars, 2007 % of GDP Billions dollars, 2008 % of GDP United States -727 -5.2 -706 -4.9 United Kingdom -75 -2.7 -46 -1.7 Euro Area 34 0.3 -93 -0.7 Germany 250 7.5 235 6.4 Netherlands 60 7.6 66 7.5 Portugal -21 -9.4 -30 -12.1 France -26 -1.0 -65 -2.3 Italy -51 -2.4 -79 -3.4 Greece -44 -14.2 -52 -14.4 Spain -144 -10.0 -154 -9.6 Sweden-Denmark 41 5.4 41 40.6 NMS -83 -8.0 -98 -7.8 Iceland -4 -19.9 -7 -40.6 Japan 211 4.8 157 3.2 Norway 62 15.9 88 19.5 Switzerland 43 9.9 12 2.4 China 372 11.0 426 9.8 Other Asia 146 3.4 74 1.6 Latina America 13 0.4 -30 -0.7 Middle East 270 18.1 347 18.3 Africa 32 2.9 32 2.5 Australia/Canada/N. Zealand -53 -2.2 -50 -1.9 CIS (inc. Russia) 72 4.2 108 4.9
Turkey -38 -5.8 -41 -5.7
Other Central and Eastern Europe -15 -11.2 -22 -13.5
World 299 191
Source: IMF, WEO October 2009.
The crisis was mainly caused by the excessive size of the financial sector, the large amounts of capital available, the cupidity of capital owners and the adventurous strategies of banks and financial institutions. Since the early 1980’s, financial markets and institutions have developed incredibly in the world economy, dealing with huge amounts of capital flows in search of high profitability unrelated to real performances. Through a succession of booms and bursts, globalisation has shown once again that financial markets are myopic, instable, herdic and cyclothymic. Financial globalisation allows for a durable increase of imbalances which burst at some point. Exchange rates instability and unpredictability, stock market bubbles, credit excessive growth show that financial markets exacerbate economic instability instead of playing a stabilizing role.
The triumph of liberalism was a Pyrrhic victory. Markets have been unable to ensure a stable, durable world growth. Thus, the 2007-2008 crisis has destroyed the theoretical bases of global
finance and led world financial markets to implode. The crisis questions the sustainability of global economy dominated by financial markets, without world economic governance.
The financial crisis is accompanied by an environmental crisis with immediate economic consequences. Consumption and production patterns will have to change due to depletion of energy resources and environmental constraints, which raises uncertainty for many economic sectors.
Domestic strategies, world economic governance and financial markets functioning need to be questioned. A strong monetary and financial support is needed to bring the economy out of the crisis, but restoring confidence in a satisfying growth requests to define a new world economic growth model. The financial and banking system needs to work again properly but here also the issue of a new functioning of finance has to be raised. There is a need for a re-foundation of capitalism.
A new world economic strategy needs to be implemented to restore a durable growth.
1. Growth should be based on domestic demand and not on exports; consumption should be based on wages and not on borrowing or capital gains.
2. Companies should pay less attention to the value for their shareholders and more on jobs and output. This implies a redistribution of power in the firms.
3. World growth must become less intensive in energy, raw materials, greenhouse gas emissions and pollution. This requires a world regulation, a concerted environmental taxation, settling a World Environment Organisation with substantial powers. Government should help their companies to shift their production techniques towards green growth (transportation, buildings,…).
4. Financial returns required by markets should be lowered; the role of financial markets and the weight of speculation should be reduced; the banking system should be re-focused on its missions to finance productive investments.
5. A world economic governance should be implemented.
But where are the social forces which can impose such a change? The winners of the globalisation refuse to change the growth model of 1995-2007. How to implement global economic governance that would arbitrate between conflicting interests between countries and social classes? Will capitalism be able to find a new robust growth without curing the factors which induced the imbalances which caused the crisis?
2.2. The G-20 summits
Three G-20 summits were held during the crisis (Washington, 15 November 2008; London, 2 April 2009; Pittsburgh, 25 September 2009). The US, supported by the IMF, wishes the meetings to focus on how to revive world economic growth. On the contrary, EU countries consider that the G-20 should tackle in priority the issue of improving world economic governance and financial markets regulation, observing that world economic governance failure and financial markets deregulation were at the origins of the crisis.
There is probably a need to pursue both objectives: the need for active policy measures should not hide the need for deep reforms. A substantial fiscal and monetary stimulus is required to bring economic recovery, but restoring confidence in a sustainable and durable growth requires the design of a new world growth model. Banking and financial systems need to
function properly again; although, here also, the implementation of a new functioning of the financial system is a major issue to be addressed.
Short-term stabilisation policies often come in contradiction with structural issues. The stimulus objective requires that interest rates remain durably low and that banks are massively rescued so that they can rapidly provide lending; the reform objective advocates for preventing the emergence of financial bubbles, hence for a tighter credit control.
The G20 summits laid the blueprint for a better governance of the world economy and a better regulation of financial markets, although we can consider they do not go far enough in these two subjects.
In most countries, fiscal and monetary policies have responded vigorously to the crisis. There was no coordination problem, even if the instruments used were not identical. Similar fiscal actions are desirable as concerns stabilisation policies, while differentiated measures should be introduced as concerns structural developments. It would make sense that countries with unsustainable external deficits and particularly hit by the financial crisis (US, UK) allow their exchange rates to depreciate while countries running external surpluses (like China) let their exchange rate rise significantly. Countries running surpluses should have implemented larger expansionary measures than others; wages should have been increased in order to raise domestic consumption in countries like Germany and China.
Openly protectionist measures have been very rare. It is not shocking that countries implement stimulus measures mostly benefitting their producers. It is not shocking that countries introduce specific support to industry sectors most affected by the crisis and help these sectors to adopt more environmentally friendly production processes.
In September 2009, the Pittsburgh summit reaffirmed the need to maintain measures to support activity as unemployment rates remain high. It is not appropriate cut public deficits now, even if it is said that in the future coordinated strategies to end the crisis would have to be developed.
The need for global economic governance has been reaffirmed. It should be ensured by the G20, with the help of the IMF. The G-20 took the commitment to challenge their national economic strategies: structural deficit countries will increase their private savings rate and cut their public deficits, countries with structural surpluses will increase domestic demand. But this would require exchange rates realignments, which the G-20 does not organise, simply writing that exchange rates should “reflect underlying economic fundamentals”. The G-20 countries will have undertaken structural reforms (but their contents are not specified) and will improve their “social safety nets”. It remains to be seen whether the G-20’s commitment will be held, especially by the countries at the origins of the imbalances: the US, China, Germany...
The G-20 took the commitment to collectively monitor the evolution of the global economy to ensure that implemented economic policies allow for “a strong, sustainable and balanced growth”, to identify risks (particularly financial risks) and to suggest adjustments. The IMF should help “its members to cope with financial volatility”, reducing the perceived need for excessive reserve accumulation" and “strengthen its ability “to provide even-handed, candid and independent surveillance of the risks facing the global economy and the international financial system”. Meanwhile, the G-20 is refusing to “restrict capital flows”, to fight against speculative behaviours, to settle more stable financing laws or to reorganize the International
The G-20 recognizes that the crisis was induced by “reckless and irresponsible unconscious risks” taken by banks and financial institutions. The objective remains to better control the institutions and financial markets, but not to greatly reduce their role and their weight. Banks will have to hold more capital, especially to cover market risk, securitized credit and off-balance assets. The capital requirements will be anti-cyclical. But the risk remains that banks fulfil these requirements by reducing their lending to businesses and households or by increasing their profits. The G-20 does not prohibit banks from engaging in speculative activities or from lending to hedge funds; the G-20 did not consider to oblige banks to restrict their activity on the credit distribution to businesses and households and on safe and low-remunerated assets.
The derivatives markets should be more transparent, but the G-20 does not propose to strictly limit it to the coverage of actually held assets.
All institutions whose failure could raise systemic risks should be subject to regulation. Large financial groups and cross-border groups will be better controlled. But the G-20 does not propose measures to reduce the size and the internationalisation of financial groups.
Wage practices should be reformed: bonuses should be spread over time, should reflect risks exposure and should be recouped in case of losses. But traders’ incomes will not be capped and there was no agreement to harmonise their taxation at a high level.
The G-20 welcomed the progress in the fight against tax and regulations heavens and agrees to continue. But the G-20 did not re-examine the list of these heavens; the G-20 maintained lax criteria for allowing a country to leave the list. The G-20 refused to take a strong measure: to prohibit financial institutions and firms to set up subsidiaries and to locate any financial (or having tax consequences) activity in these countries.
There have been worrying signs more recently: banks are making high profits in 2009 by taking advantage of very low refinancing rates they did not fully passed on to borrowers; many banks have repaid State aids in order to recover rapidly their entire freedom; Anglo-Saxon banks pay again high bonuses and compete again to attract traders to speculate like before; the crisis has caused mergers among financial institutions which can now benefit from their monopolistic situation to make huge profits (like Goldman Sachs and BNP-Paribas). The foreign exchange market is again unstable: the euro is appreciating and has come close to $1.50 which endangers EU firms’ competitiveness. World equity markets, which had dropped by about 55% from March 2007 to February 2009 have risen since by more than 40%. The global economy is not immune to the resurgence of asset bubbles.
The G-20 has gone very far in the right direction, but the reforms hit the interests of large capital owners and financial sector leaders. They will try to delay reforms, hoping to quickly resume their activities as before, as they did after the implosion of the dot.com bubble. Will the willingness of reforms of the G-20 leaders be strong and durable enough?
2.3. About expansionary monetary policies
Central banks have responded to the crisis in cutting drastically their base rates, providing massive liquidity to banks and using non conventional tools (accepting lower quality assets as collateral and buying if necessary long term assets).
However, in a deep crisis, monetary policy rapidly reaches limits. Low nominal interest rates remain high as compared to growth and inflation, especially as the spread between central
bank rate and credit or corporate bonds rates increases. At the beginning of 2009, the interest rate on the Aaa corporate bonds was 5.05% in the US, for a 1% expected GDP growth in value for 2009: the spread between the two variables was 4 percentage points, when it was only 0.5 in July 2007. In France, the interest rate for companies’ credit was 4.6% for a 1.3% expected growth of GDP in value in 2009; the spread was 3.3 points as compared to 1 point only in July 2007. Borrowing costs remain high for companies anticipating a decline or a stagnation of their prices and output. Uncertain economic prospects discourage companies and households to borrow and banks to lend. It is very difficult for monetary policy not to be pro-cyclical.
Table 4. Interest rates and GDP growth expectations
June 07 January 08 June 08 January 09 June 09
USA Fed funds 5.25 4.0 2.0 0.15 0.15 Treasury 10-year 5.0 3.75 4.0 2.5 3.6 Corporate bonds* 5.7/6.65 5.3/6.55 5.65/7.15 5.05/8.15 5.4/6.3 Forecast GDP growth** 5.2 4.8 -3.2 1.0 3.9 France ECB rate 4.0 4.0 4.2 2.3 1.0 Treasury 10-year 4.6 4.15 4.7 3.6 3.7 Companies credit rate 4.9 5.2 5.5 4.6 3.4 Forecast GDP growth ** 3.9 3.75 -2.8 1.3 1.3
*Aaa/Baa; ** In value
Sources: Fed, Banque de France, OFCE calculations.
In a financial economy, central banks face a difficult choice: should interest rates be durably maintained at very low levels at the risk of generating new financial and housing bubbles and hence giving again illusionary wealth to companies and households?
2.4. What fiscal stimulus to tackle the crisis?
In a situation of falling output, governments should respond through fiscal policy in allowing public deficits to rise.
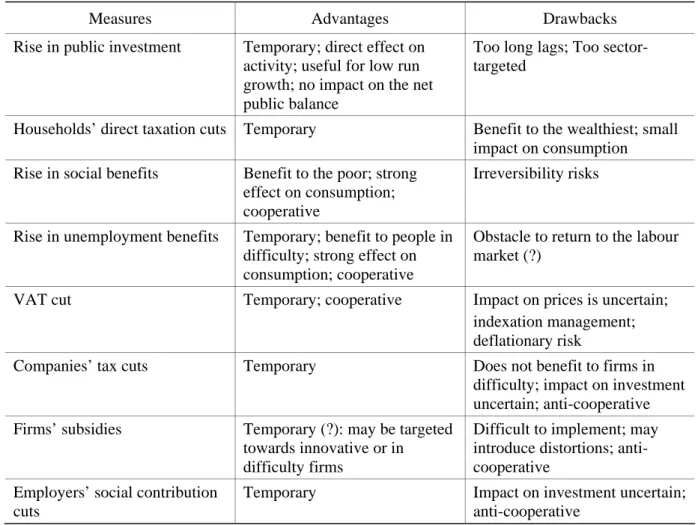
First the automatic stabilisers will play: they have the advantage of playing without delay and they can be reversed. They are larger in economies with a high level of public taxation, progressive taxation and unemployment benefits, larger in continental Europe than in Anglo-Saxon economies. Second will come discretionary measures explicitly designed to support activity: rise in public spending and investment, tax cuts or increase in social benefits (table 5).
According to the 3T rule, stimulus measures should be timely, temporary and targeted. However, their temporariness may be questionable if the crisis has structural causes: for instance, inequalities have dramatically risen in Anglo-Saxon countries and social benefits may be increased on a permanent basis through higher taxation on the wealthiest; China needs to support durably consumption through the introduction of a decent social protection.
Table 5. Advantages and drawbacks of fiscal stimulus
Measures Advantages Drawbacks Rise in public investment Temporary; direct effect on
activity; useful for low run growth; no impact on the net public balance
Too long lags; Too sector-targeted
Households’ direct taxation cuts Temporary Benefit to the wealthiest; small impact on consumption Rise in social benefits Benefit to the poor; strong
effect on consumption; cooperative
Irreversibility risks
Rise in unemployment benefits Temporary; benefit to people in difficulty; strong effect on consumption; cooperative
Obstacle to return to the labour market (?)
VAT cut Temporary; cooperative Impact on prices is uncertain; indexation management; deflationary risk
Companies’ tax cuts Temporary Does not benefit to firms in difficulty; impact on investment uncertain; anti-cooperative Firms’ subsidies Temporary (?): may be targeted
towards innovative or in difficulty firms
Difficult to implement; may introduce distortions; anti-cooperative
Employers’ social contribution cuts
Temporary Impact on investment uncertain; anti-cooperative
If fiscal policy is seen as temporary, then private agents may fear that the end of the fiscal stimulus will depress activity. It should be announced that the stimulus will last as long as necessary.
The housing sector is particularly hit by the crisis and should be supported. However countries like Spain have no alternative but reduce the weight of this sector in their economies. Investment goods sectors are also strongly affected by the crisis and cannot be so easily supported by fiscal policy: this is a problem for Germany.
The needs for a rapid stimulus (supporting existing sectors) may come in contradiction with long-term needs (shifting production towards less energy-intensive and more environmentally-friendly processes).
In a situation of insufficient demand, output needs to be substantially supported. The IMF had suggested a fiscal stimulus of 2% of GDP at the world level; the European Commission of around 1.5% of GDP at the EU level.
Ideally policies should be strongly coordinated in order to:
- Prevent free riding behaviours (some countries benefiting from the stimulus policy in neighbour countries),
- Avoid strategies with detrimental effects on other countries (exchange rate depreciation, wage moderation, protectionism)
But coordination takes time and is difficult to settle. Each country has reasons for doing less than other countries: EU countries may request the bulk of the effort to be made by the US, responsible for the crisis, but the US may reply that on the contrary the crisis is due to the fact that in the past the US was the only country to support world growth; Germany may not wish to undermine its previous restructuring efforts although this efforts are viewed as counter-productive by EU partners.
The current crisis has highlighted the general problem of fiscal policy: the rise in public deficits and debt. This should come to an end at some point, but without pushing the economies back to the crisis. The level of public debt has been permanently increased under the effects of the crisis. Once the crisis is over, can the implementation of a durably restrictive fiscal policy stance be avoided?
3. The French fiscal policies during the crisis
3.1. French fiscal specificities
France has remained a mixed economy with a high level of public spending and taxation, persistent public deficits and a rather Keynesian fiscal policy. France has not implemented an extensive programme of structural liberal reforms, because of the disapproval in the population, of the State tradition and of the lack of enthusiasm among leading classes, closely linked to the State.
In his 2007 electoral campaign, Nicolas Sarkozy set the objective of substantial cuts in taxation levels and public deficits which should imply dramatic public spending cuts (but the contents of the strategy were never totally unveiled, except for the reduction in waste of public money and in the number of public servants).
This objective was based on:
- ‘liberal’ considerations (lower tax rates will boost employment, savings, investment, and so production)
- the difficulty to maintain high taxation in the context of globalisation and the European single market without tax harmonisation.
In 2007-2008, the French government cut taxes but did not succeed in reducing substantially public spending. In the crisis, France has had difficulty to implement a large-scale temporary fiscal stimulus. There is a contradiction between the need to increase public expenditures and the desire to reduce them structurally. Most of the implemented tax cuts will be permanent. The discretionary stabilisation measures were insufficient. But, due the weight of automatic stabilisers, France was less hit by the crisis than most EU countries. Nevertheless, France has now to face a structural crisis of its public finances.
3.2. A relatively high public spending
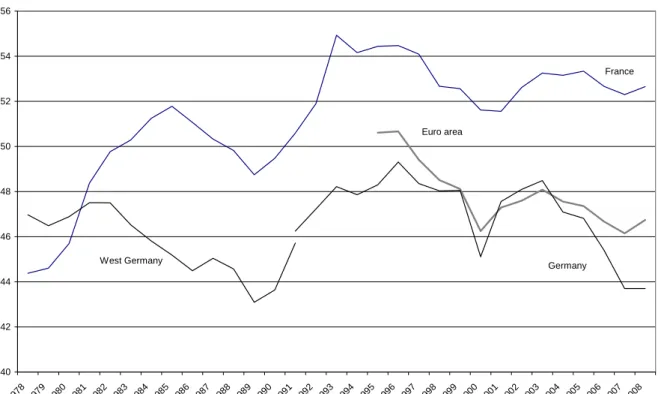
The weight of public spending has remained high in France: 52.7% of GDP in 2008 as compared to 46.8% in the euro area (see Chart 1).
Chart 1. Public spending, as a percentage of GDP 40 42 44 46 48 50 52 54 56 1978 1979 1980 1981 1982 1983 1984 1985 1986 1987 1988 1989 1990 1991 1992 1993 1994 1995 1996 1997 1998 1999 2000 2001 2002 2003 2004 2005 2006 2007 2008 France Euro area Germany West Germany
Note: Total expenditure: general government:- Excessive deficit procedure (Including one-off proceeds (treated as negative expenditure) relative to the allocation of mobile phone licences (UMTS))
Source: European Commission, AMECO Database.
Contrary to most euro area countries, France has made very limited effort to cut the weight of public spending in GDP (table 6). France benefited less than the area average from the reduction on public debt interest payments. In 1990, public spending amounted to 49.5% of GDP in France i.e. 1 percentage less than the euro area average. In 2007, the ratio was 6 percentage points above the euro area average. In 2007, France became the EU country with the highest public spending level as a percentage of GDP.
Table 6. Public spending growth (in real terms)
In % per year 1991/2001 2001/2008 France: GDP Public expenditures 2.05 2.25 1.6 1.9 Euro area : GDP Public expenditures 2.1 1.7 1.6 1.5
Sources: OECD, OFCE calculations.
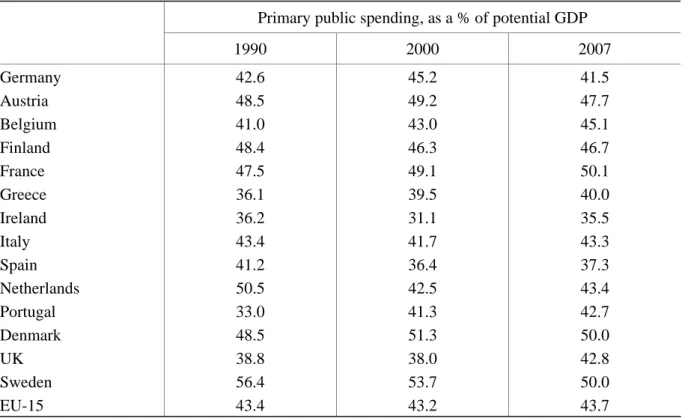
The weight of primary public spending in GDP has remained stable since 1990 in the EU-15 taken as a whole. There have been significant cuts in some countries: the Netherlands (7 percentage points), Sweden (6.5 percentage points), Spain (4 percentage points), either because of social protection privatisation or because of rapid GDP growth. But public
spending as a percentage of GDP has risen in some other countries: Portugal (10 percentage points), UK, Belgium and Greece (4 percentage points). It increased by 2.5 percentage points in France, where it was already at a relatively high level.
Table 7. Primary public spending in EU countries
Primary public spending, as a % of potential GDP 1990 2000 2007 Germany 42.6 45.2 41.5 Austria 48.5 49.2 47.7 Belgium 41.0 43.0 45.1 Finland 48.4 46.3 46.7 France 47.5 49.1 50.1 Greece 36.1 39.5 40.0 Ireland 36.2 31.1 35.5 Italy 43.4 41.7 43.3 Spain 41.2 36.4 37.3 Netherlands 50.5 42.5 43.4 Portugal 33.0 41.3 42.7 Denmark 48.5 51.3 50.0 UK 38.8 38.0 42.8 Sweden 56.4 53.7 50.0 EU-15 43.4 43.2 43.7
Sources: OECD, OFCE calculations. Public spending composition
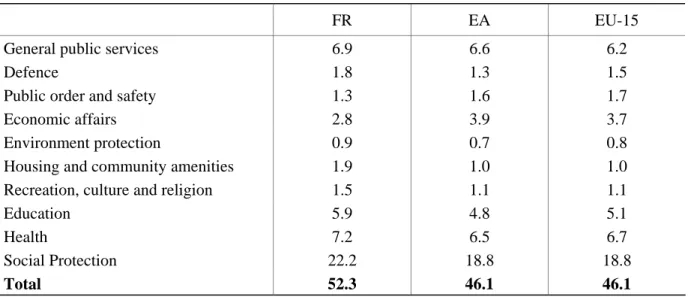
Public spending is about 6 percentage points of GDP higher in France than in the euro area. The gap is particularly large in the field of social protection (including health) where public spending is almost 4 percentage points higher in France than in the euro area (table 8). France has an almost entirely public health system and pays generous housing and family benefits, family supports such as child care expenditure and support to mothers who leave their job to care after their young children; unemployment benefits are relatively generous; France has also a minimum income system; the basic and the complementary pension systems are public and older people are entitled to a generous minimum allowance.
Public spending in education is 1 percentage point of GDP higher in France than in the euro area, due to a higher share of young people in the population and to the low level of private spending in education in France. Public spending is slightly higher in France in housing and collective infrastructure (0.9 percentage point) and in culture (0.5 percentage point).
A large cut in public spending would require substantial cuts in public expenditures directly benefiting the population (health, pensions, family benefits, etc), which would be unpopular and questionable from a social point of view (inequalities would rise) and from an economic point of view (people would have to replace public expenditure by private ones; it is not certain that it would be more efficient for education, health, pensions,…).
Table 8. Government expenditure by function in 2007
As a % of GDP
FR EA EU-15
General public services 6.9 6.6 6.2
Defence 1.8 1.3 1.5
Public order and safety 1.3 1.6 1.7 Economic affairs 2.8 3.9 3.7 Environment protection 0.9 0.7 0.8 Housing and community amenities 1.9 1.0 1.0 Recreation, culture and religion 1.5 1.1 1.1
Education 5.9 4.8 5.1
Health 7.2 6.5 6.7
Social Protection 22.2 18.8 18.8
Total 52.3 46.1 46.1
Source: Eurostat.
Recent projects for large public spending cuts in France
Since 1998, all updates of the Stability Programmes submitted by France have announced a significant deceleration of public spending growth. But this did not occur before 2006 (see Table 9). Public spending in volume grew by 2.1% in 2005 and slowed down to 1.1% in 2006, 1.5% in 2007 and 1.2% in 2008. Public expenditures were managed with a strong discipline: for instance, family benefits, pensions, minimum incomes were indexed on prices only and not on wages. However, this did not allow for a reduction of public spending as a share of GDP.
Table 9. Public expenditures growth, per year, in real terms
In %
Stability programme Observed
2000-2002 1.0 2.3 2001-2003 1.3 2.5 2002-2004 1.5 2.5 2003-2005 1.3 2.2 2004-2006 1.3 1.8 2005-2007 1.1 1.6 2006-2008 1.2 1.3 2007-2009 0.6 2.0 2008-2010 0.6 1.9 2009-2012 1.125 2011-2013 1.0
Sources: OFCE calculations.
Many texts (in particular the Pebereau’s Report) have called for a strong decrease of public spending in order to lower the tax burden on the productive sector. But this assumes that the
existing public expenditures are unnecessary. However, many public expenditures are useful to growth (education, research) or production (infrastructure, child care support). Others are crucial for households (health, retirement) and their reduction would have to be offset by increased private insurance spending, at a similar or higher cost. Finally, some reflect a social choice for a society with more solidarity (minimum income, unemployment benefits). While a rigorous management of public finances is needed, a social choice has to be made between public and private expenditure but we may think that households prefer more nurseries than more bank branches and that the ratio of teachers to golden boys’ wages should be increased rather than the opposite.
The LOLF (‘Loi organique relative aux Lois de Finances’) adopted in 2001 and enforced from 2006 has modified management practices and adoption rules of the French budget. Expenditure limits are classified into 120 programmes, then grouped in ‘missions’. The manager of each ‘mission’ has a certain degree of freedom to reallocate expenditure. The outcomes of each mission are controlled through precise indicators. Performance reports are expected to control the evolution of indicators and budget costs. The LOLF aims at improving public spending efficiency. There is no certainty that it will allow to cut spending. For instance, as concerns family policy, the LOLF sets targets in terms of living standard parities for families relatively to couples without children, of child poverty rates and of child care; but the fulfilment of these targets would require an increase in public spending.
According to the Attali’s Report (January 2008) the government and other pubic administrations should be substantially reformed and public spending should be cut and focused on some precise objectives. However, the Report recommends substantial programmes aiming at increasing infrastructure, supporting social housing, reducing the number of poor people down from 7 to 3 million, improving pre-primary, primary and higher education, adapting France to innovation. At the same time, the report advocates for cutting public expenditure by 1 percentage point per year during 5 years, which implies that public spending should grow by 0.5% per year only (the report even says 0). Are these objectives consistent? Yes, according to the report, owing to expenditure reallocations and development of private-public partnership. But is this credible? Some cuts recommended by the Report are arguable: reducing family allowances according to incomes (but the government has refused this measure); introducing a non-refundable payment on medical costs depending on incomes; abolishing a regional level of government administration - the ‘départements’ (but who will manage social assistance?). But the main idea is to increase efficiency, like abolishing a large part of support to companies, employment and housing which would be inefficient (but is this true?). The Report recommends a change in civil servants earnings’ growth rules. However, their average real wage decreased by 0.4% between 2000 and 2007 (as compared to an increase by 5.7% in the private sector). Can it decrease even more rapidly? The report recommends not to replace 2 civil servants over 3 retiring, i.e. a 8.5% cut in the number of civil servants in 5 years and a 5 billion euro reduction in costs (0.25% of GDP), the third of which would be allocated to civil servants’ wage increases. No evidence that substantial savings measures could be implemented is given.
The General Revision of Public Policies intends to reduce public spending albeit increasing efficiency and quality of public intervention. Here also, there is a bet that more can be done at a lower cost, which avoids social choices to be debated and made. Public policies have been
opinions of the concerned administrations and especially of concerned people are not taken into consideration. The announced measures deal with merging some administration branches, reducing the field of the administration, privatising some tasks and abolishing some benefits. Most measures are arguable and it is not certain that the government could resist the opposition of people (and even administrations) involved.
Until now, the French governments have refused to cut massively public expenditure and especially benefits. Benefits slowly diminish in relative terms, but there is no massive privatisation of health, education or pensions systems; no massive cuts in family or assistance benefits. The EU pressure and liberal mainstream views on the one hand and the wish of the population on the other hand lead rooms for manoeuvre to be very small.
3.3. French taxation system
The French tax to GDP ratio increased significantly from 34% in 1974 to 42.5% in 1984 and remained stable at that level until 1993. It reached 44% in 1996 and remained roughly at that level until 2007, 4 percentage points above the EU15 average. In 2007, France ranked 3rd among OECD countries (behind Sweden and Belgium) in terms of tax to GDP ratio.
Chart 2. Tax revenues as a percentage of GDP in France and Germany since 1970
30 32 34 36 38 40 42 44 46 1970 1972 1974 1976 1978 1980 1982 1984 1986 1988 1990 1992 1994 1996 1998 2000 2002 2004 2006 2008 France Germany
Sources: OECD, Revenue Statistics; estimates for 2008 based on AMECO database, April 2009.
Since 1984, French governments have considered that the tax-to-GDP ratio had reached a maximum and that structural adjustment would be done through spending cuts. Since it is difficult to cut spending levels in a short period of time, this choice explains the rapid rise in public deficits in 1992-1995 and later in 2002-2004. The government raised taxes in 1996-1997 only because of the Maastricht binding rules.
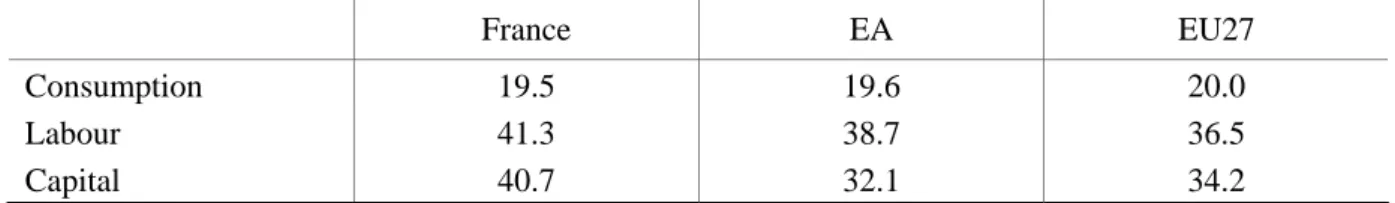
According to Eurostat classification, taxation is slightly heavier on labour in France than in the EU-27. This is much more true for capital, which may be justified both from fairness and economic efficiency view points in a context of mass unemployment, but raises today a problem because of free movements of capital.
Table 10. Implicit tax rates, 2007 In %
France EA EU27
Consumption 19.5 19.6 20.0
Labour 41.3 38.7 36.5
Capital 40.7 32.1 34.2
Source: Taxation trends in the EU, Eurostat (2009).
The French taxation system has four main features:
- Households’ income taxation is especially weak (7.5% of GDP against 9.4% in the EU). This is partly offset by a high local taxation.
- Employers’ social contributions are particularly high (11% of GDP against 7.2% in the EU).
- Business tax is high (corporate tax, business tax (taxe professionnelle))
- Households’ wealth taxation is relatively high (tax on higher wealth ISF, estate and inheritance taxes).
French taxation remained relatively redistributive, with some specific taxes like wealth taxation and business tax (taxe professionnelle) which make France an isolated example in Europe. The higher marginal tax rate earnings is 56.8% which is higher than in Germany (47.5%) or in UK (46.8%).
The current French government is tempted to implement liberal reforms in order to adapt to globalisation, through lowering the tax burden on the most mobile factors: companies, capital, the highest wages or the wealthiest. At the same time, the government projects to cut labour taxation, although there is no budgetary room for manoeuvre and no implementation of a strategy of massive public spending cuts.
3.4. French fiscal policy
In 2007 and in 2008 - before the crisis-, France was the only large country in the euro area keeping a close to 3% of GDP public deficit and hence looked as the only ‘sinner’ in the area. In Germany and Italy, public deficits had been substantially reduced. France looked like the only country resisting the prevailing anti-Keynesian view in Europe. The latter inspires euro area economic policies, the independence of the ECB and the Stability and Growth Pact. This framework seems unable to support growth in Europe and thus France has some reasons for departing from this view.
However, France does not explain its policy and does not seem to try to impulse a change in economic policy in Europe. France regularly promises to bring the government deficit back to 0 and hence seems more like being unable to control its public finances than trying to
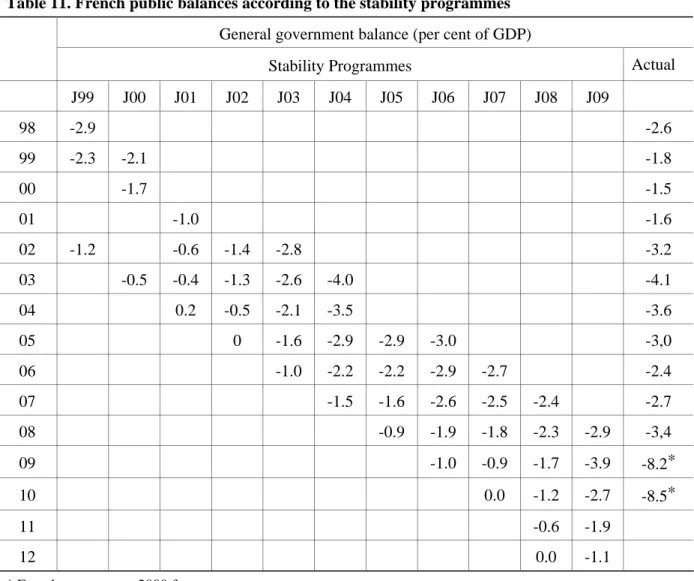
Table 11. French public balances according to the stability programmes
General government balance (per cent of GDP)
Stability Programmes Actual J99 J00 J01 J02 J03 J04 J05 J06 J07 J08 J09 98 -2.9 -2.6 99 -2.3 -2.1 -1.8 00 -1.7 -1.5 01 -1.0 -1.6 02 -1.2 -0.6 -1.4 -2.8 -3.2 03 -0.5 -0.4 -1.3 -2.6 -4.0 -4.1 04 0.2 -0.5 -2.1 -3.5 -3.6 05 0 -1.6 -2.9 -2.9 -3.0 -3,0 06 -1.0 -2.2 -2.2 -2.9 -2.7 -2.4 07 -1.5 -1.6 -2.6 -2.5 -2.4 -2.7 08 -0.9 -1.9 -1.8 -2.3 -2.9 -3,4 09 -1.0 -0.9 -1.7 -3.9 -8.2* 10 0.0 -1.2 -2.7 -8.5* 11 -0.6 -1.9 12 0.0 -1.1
* French government 2009 forecast.
Sources: European Commission, Stability programmes, Eurostat, own calculations.
From 1998 to 2000, the fiscal stance was rather expansionary: France refused to implement restrictive policies, in order not to put the economic recovery at risk. In 2000, government deficits reached 1.5% of GDP. France was far from the 3% of GDP limit, but had not built any room for manoeuvre.
In 2002-2003, in a context of a world economic slowdown, France ran an expansionary policy (1.5 percentage point of GDP) which added to the cyclical deficit and led deficits to reach 4% of GDP in 2003, like in Germany, initiating a crisis of the SGP in November 2003. At the whole euro area level, the fiscal impulse only reached 1.2 percentage point of GDP over these 3 years, as compared to 6 percentage points in the US and 5.4 percentage points in the UK. From 2004 to 2006, while France had a small negative output gap, restrictive fiscal policies were run (1.6 percentage point), which allowed France not to reach the 3% of GDP limit. Fiscal policy was therefore pro-cyclical from 1994 to 1997 (due to the convergence process to the Maastricht criteria), in 2000 (for electoral purposes), from 2004 to 2006 (due to the lack of room of manoeuvre). On the contrary, fiscal policies were stabilising in 2002-2003 although probably insufficiently.
Table 12. Fiscal developments in France 1997 1998 1999 2000 2001 2002 2003 2004 2005 2006 2007 2008 Public balance -3.3 -2.6 -1.8 -1.5 -1.6 -3.2 -4.1 -3.6 -3.0 -2.3 -2.7 -3.4 Output gap -1.2 -0.1 0.7 2.4 1.8 0.6 -0.6 -0.6 -0.9 -0.7 -0.6 -2.4 Cyclical component -0.6 -0.1 0.3 1.2 0.9 0.3 -0.3 -0.3 -0.4 -0.3 -0.3 -1.2 Interest payments 3.1 3.0 2.8 2.7 2.7 2.7 2.6 2.5 2.4 2.3 2.5 2.6 Cyclically-adjusted primary balance 0.4 0.5 0.7 0.0 0.2 -0.8 -1.2 -0.8 -0.2 0.3 0.1 0.4 Fiscal impulse -0.2 -0.2 0.7 -0.2 1.0 0.4 -0.4 -0.6 -0.5 0.2 -0.3 Sustainability index* 1.0 0.5 0.3 -1.2 -0.9 -1.1 -0.9 -0.5 0.3 0.7 0.4 1.6
*Cyclically-adjusted primary balance less 0.5 output gap. Source: own calculations.
Is the French public debt sustainable?
The French public debt (according to Maastricht definition) reached 63.8% of GDP at the end of 2007.Since 1991, public debt rose by 28 percentage points of GDP in France, as compared to 8 percentage points for the euro area as a whole. Although in terms of debt trends, France performed less well than the average, the French debt level does not depart from most EU countries and even shows a more favourable position. The French debt level is below the euro area average (66.4%) and close to the US level (65%), well below Belgium (84%), Italy (106%) and Japan (181%).
The Maastricht definition for government debt does not account for assets owned by the general government sector and among them financial assets. The general government sector owns substantial financial assets in France. At the end of 2007, the net financial debt was 34% of GDP in France. The French net public debt is well below the euro area average (43.5%), the Germany (43%), the US (43%) and Japan (80.4%).
From 1995 to 2007, the net financial debt remained roughly stable in France (-3 percentage points of GDP). The rise in the French gross public debt was to a large extent offset by the rise in the value of financial assets owned by the general government sector. The choice made by EU authorities of a gross definition for the public debt is not neutral; it penalizes the countries where the government owns public firms.
Table 13. General government accounts
In % of GDP
1994 2007 2008
Non financial assets 57.0 76.3 74.3 Financial assets 30.5 45.4 42.2
Debts 62.9 80.3 86.4
Net value 24.6 41.5 30.1
Source: INSEE, own calculations.
If we take non financial assets into account, then the net value of general government sector was 41.5% of GDP in 2007. France is not indebted vis-à-vis the rest of the world: French net overseas assets are slightly positive, around 1% of GDP at the end 2007.
1. Fiscal policy is satisfactory when it does not generate an inflation rate above the central bank objective; it does not lead the central bank to set the interest rate above the nominal GDP growth rate; it does not induce an excessive external deficit. This is the case with the current French fiscal policy.
2. Financial markets do not fear any default risk. French government debts are ranked AAA by notation agencies (Standard and Poor’s, Fitch ratings). Financial markets are willing to hold French government debt at low interest rates: in September 2009, 3.6% for 10-year bonds; in January 2009, 4.1% for 30-year bonds.
3. We can define public finance sustainability as the stability of the public debt-to-GDP ratio. If the nominal interest rate is close to nominal GDP growth and if the stabilising discretionary measures may represent half of the output gap, the primary structural balance should be higher than half of the output gap. French public finances seems unsustainable from 2000to 2004, sustainable since 2005 (table 12).
4. The European commission defines sustainability as the stability of the debt-to-GDP ratio in a scenario where tax rates are stable and public expenditures rise due to an ageing population (European Commission, 2009). But this definition is not acceptable: a country should not raise tax rates today because, in the future, its health or pensions expenditure will rise. A country has the right to envisage that its taxes rates will be increased when expenditures rise, not before.
5. If the objective is that net public debt equals general government assets, then the structural deficit should be higher than: net investment + government debt depreciation due to inflation + capital gains on owned shares. The upper limit for the French structural deficit is thus at around 2.8% of GDP, i.e.: net investment (1% of GDP) + debt depreciation (1.2%) + capital gains on shares (0.6%).
Public finances need to be managed seriously, but in the light of these different indicators, the French public debt does not currently raise any sustainability problem.
3.5. Nicolas Sarkozy’s fiscal policy (2007-2008)
During the electoral campaign, Nicolas Sarkozy announced the objective of cutting the French tax-to-GDP ratio from 44% to 40%, at the EU average. He wanted to cut labour taxation (to give a work incentive to workers), companies’ taxation (to improve their competitiveness), and taxes on the wealthiest and high-income earners (to encourage them to remain in or come back to France). At the same time, France had a public deficit of 2.3% of GDP in 2006 and the government promised to cut it by at least 0.5 percentage points per year. Simultaneously, Nicolas Sarkozy promised to increase many social expenses and public spending for research and higher education; the new announced measures amounted to around 32 billion euros per year. At the same time, Nicolas Sarkozy also announced a huge cut of total public spending although its content was not explained, except for a reduction of waste
of public money, a reform of the pension system of public firms (the régimes spéciaux1) and to reduce the number of public servants by replacing only 1 over 2 retiring.
Nicolas Sarkozy expected a robust growth. This growth would have been boosted by an increase in labour supply induced by measures increasing gains from work (the motto was
1
In fact, the government reformed the régimes spéciaux in 2008, but this reform had no financial impact in the short-term, as wages were increased to offset the degradation of the pension system.
‘work more to earn more’, ‘travaillez plus pour gagnez plus’) and by the shock of confidence that its liberal policy would induce for companies’ owners. This growth would have brought revenues allowing to finance the programme.
This hope of robust growth has vanished with the crisis. The fiscal stimulus objective requires the government to boost public spending, which is in contradiction with its fiscal programme for the long run.
On the revenue side, a tax package was adopted in the summer of 2007 (the ‘paquet fiscal’). It introduced an income tax reduction for mortgage interest payments, a tax cut for overtime worked hours, a significant reduction in inheritance taxation, a reduction of households’ wealth taxation and a ‘tax shield’ (the ‘bouclier fiscal’): households will not pay more than 50% of their before-tax income in direct taxes, including the income tax, the local tax, the CSG (the social contribution), the ISF (the wealth tax). The tax shield benefits to the wealthiest households, especially to people who live in a flat that they own or rich people who do not realize their gains on their wealth (as implicit rents and unrealized gains are not included in their before-tax income).
The government increased the research tax credit and abolished the local business tax (taxe
professionnelle) on new investment spending. In 2009, the French government was allowed
by its EU partners to cut VAT on restaurants, which is an expensive and inefficient measure that the government had promised to the restaurant lobby.
In 2009, the government has decided to reform the local business tax. The reform will cost 7.3 billion euros; the reduction will benefit mainly firms in the industrial sectors.
In 2010, the government will introduce a carbon tax as an incentive for households and firms to reduce CO2 emissions. To avoid that this tax would unpopular, the amounts of the tax paid
by households will be returned to them by a lump sum, although the French public deficit is large.
Altogether, the permanent tax cuts amount to 1% of GDP.
On the expenditure side, the RMI (minimum income, revenu minimum d’insertion) was transformed into the RSA (revenu de solidarité active). The reform provides a supplementary income for vulnerable workers and their family; it increases their gains when they return to work (but the impact will be small in the short run as the labour market situation dramatically deteriorates); the measure costs 1.5 billion euros and is financed by a levy of 1.1% on capital incomes. It is the only case where the government has increased taxation.
The non-replacement of 1 over 2 civil servants who retire will amount to a 7 billion euros cut after 5 years. This measure is problematic in a context of high and rising unemployment. The reduction weighs mainly on teachers, which come in contradiction with the objective of raising the education level and diminishing social inequality through education.
The whole set of fiscal measures will have increased the deficit by 0.8 of GDP on a permanent basis. France has undertaken its stimulus plan before the crisis.
The government refuses any significant increase in the tax burden, believing that the tax rate is too high in France. The government refuses to reform the bouclier fiscal which protects the richest from any taxation rise. The government wants to rebalance public finances by reducing public expenditure. The strategy is to cut taxes first and to rely afterwards on the public deficit to force a reduction in expenditure.
Table 14. Permanent fiscal measures In billions euros
2007 2008 2009 Full year Mortgage tax reduction -0.3 -1.1 -4.0
Overtime work tax cuts -0.9 -3.3 -5.0 -5.0 Wealth taxation -1.0 -1.2 -1.2
Inheritance taxation -0.4 -1.6 -2.0 -2.0 VAT on restaurants -1.2 -2.4
Local taxation on firms -3.0 -3.0 -7.3 Flat tax on firms -0.3 -1.6 Research tax credit -0.6 -1.2 -2.0
Carbon tax +1.4
Tax on capital incomes +1.3 +1.5 Tax on health insurances +1.1 +1.1
Taxes -1.3 -9.2 -12.4 -21.5
RSA 0.7 1.5
Cuts in the number of civil servants -1.4 -2.8 -7.0
Expenditures -1.4 -2.1 -5.5
Source: Ministry for finance, own estimations.
3.6. French policy answers to the crisis
During the crisis, Nicolas Sarkozy has changed the tone of his speech, from a liberal to a social, interventionist and industrialist one. During the three G-20 summits, France advocated for a reform of financial markets and institutions and a reform of world economic governance. At Argonay, on 23 October 2008, Nicolas Sarkozy said: “The ideology of the market being powerful and the public being powerless died with the financial crisis. We must re-establish the world capitalism by giving the leading role of the entrepreneur and the worker, not the speculator”. He announced heavy public interventions:
1. "Alongside investment in universities, research and the environment, we are going to invest heavily in the digital economy, which will be the driver of future growth, along with clean technologies“
2. Introduction of a public intervention fund, “Fonds stratégique d’investissement” which could provide support to French strategic companies to protect their capital or help them finance their growth (capital: 20 billion euros; 14 billion in already made participation and 6 billions in available liquidity).
3. Over three years, "175 billion euro of direct investment" will be injected by the government into economic activity
4. Complete exemption from local business tax for investments made between now and the beginning of 2010.
At the same time, he maintained a liberal strategy by making the legislation for work on Sundays more flexible.
French policy answers to the crisis: December 4th 2008
The stimulus package announced in December 2008 was relatively limited in size (26 billion euros, i.e. 1.3% of GDP). But automatic stabilizers are high in France. The government refused to strongly support households’ consumption and preferred to focus on public investments and firms aids. The argument was that public investments prepare the future and do not increase the net public debt, while support to firms allows them to maintain employment, thus benefiting households.
Public investments should be raised by 10.5 billons euros, of which 4 should be made by the State, 4 by Public companies and 2.5 by local authorities. The initial announcement was to implement all investment in 2009, but from the Finance Law adopted in early 2009, 70% of planned investment was expected to be implemented in 2009. In 2009, the government has made a lot of efforts to accelerate the implementation of these new investments, at the detriment of their relevance. For instance, the government has accepted to suspend urbanism rules and environmental objectives.
---
The stimulus package (4th December 2008): 26 billion euros (1.3% of GDP)
Public investment: 10.5 billion euros (0.5% of GDP)
General government investment: 4.0 bn — Infrastructure: 1.4 bn
— Research and higher education: 0.7 bn
— Military defence, public order and safety: 1.36 bn — Historical buildings. 0.6 bn
Public corporations’ investment: 4.0 bn
— EDF (2.5), GDF Suez (0.2), RATP (0.45), SNCF (0.3), La Poste (0.6) Support to local government investment: 2.5 bn
— advance payment (€2.5 billion) of the 2008 FCTVA in 2009 (due to be paid in 2010).
Support to companies: 11.4 billion euros (0.6% of GDP)
— Reimbursement of sums due by the Treasury to companies. Reimbursement of research tax credit and VAT on a monthly basis.
— Accelerated depreciation of investments made in 2009;
Support to the housing sector and automobile sector: 2 billion euros (0.1% of GDP)
Housing sector: 1.8 bn
— Doubling the size of the 0% interest rate mortgage credit: 0.6 bn — Building 100,000 houses: 0.6 bn
— Urban renovation, specific investment in housing : 0.6bn Automobile sector: 0.2 bn,
— car-scrapping scheme (prime à la casse)
Employment policies: 1.2 billion euros
— Incentive for job creation in companies with less than 10 workers: 0.7 bn — Active employment policies (transition professionnelle contract): 0.5 bn
Social policies
— Bonus for low-income earners: Prime de solidarité active (PSA).
Social Summit (18th February 2009): 2 billion euros
— Unemployment benefits: 0.25 bn — Family allowances: 0.8 bn
The measures aimed to support companies are mainly cash-flow measures. The final cost is only interest payment: 6% on 10 billions euro (600 million per year). They may help firms facing short-term financing difficulties in the crisis.
The prime de solidarité active (PSA, active solidarity bonus) is a €200 per household bonus, paid in one payment, in April 2009. It does not depend on the size of the family. The PSA was a temporary measure implemented before the introduction of the RSA in June 2009. It equals roughly two monthly RSA. It benefited 3.8 million low-income households: families at the minimum income (RMI, revenu minimum d’insertion), single parent allowance (API,
Allocation de parent isolé), low-benefit unemployed, low-wage workers (single earning the
minimum wage or slightly above, 2 minimum wages for couples, 3 minimum wages for families with 4 children).
Social Summit (18th February 2009): 2 billion euros
In February, when the crisis became deeper, the government organized a social summit and announced new and more targeted to households measures amounting to 2 billion euros.
1. 250 million to improve unemployment benefits:
- Benefits for part-time unemployment rise from 60% to 75% of the wage,
- 500 euro given to the unemployed who have worked more than 2 months but not enough to be entitled to the unemployment benefit.
2. 450 million to families: 150 euros for the families entitled to the ARS (allocation de
rentrée scolaire, a means-tested benefit for low-income families with children of school
age). The benefit does not depend on the number of children.
3. 200 million to low-income families (with children, disabled or old people) to buy services to the persons.
4. 1,100 million for a reduction by 2/3 of income taxation for people at the first income bracket (at 5.5%) and for people at the lower range of the second bracket (14%).
The introduction of a “Fonds d’investissement social” (Social Investment Fund) was also announced to finance young people’s participation in the labour market, reconversion and vocational training and part-time work schemes. The fund should be allocated 3 billion euros in 2009 (1.3 given par the State, 0.2 by the European Social Fund, 1.5 by the Unedic, the French unemployment fund managed by social partners).
The social measures seem randomly spread among households (table 15): some benefits depend of the family size, some do not; tax cuts benefit middle-income families. Single people receive more than families, unless they earn more than 1.25 minimum wage. Households with an income of one minimum wage per unit of consumption can receive 0, or 200 euros (single person) or 150 euros (family with 2 children). Among the poorest, the single are favoured; above a certain level of income, families are favoured.
The total amount of these measures is rather low (2.8 billion, or 0.14% of GDP); the goal is more to support targeted households than to provide a large support for consumption. But the target has not been clearly defined between three groups of the population: the poorest, the victims of the crisis and “the most modest of the middle class”, which the government wanted to support for political reasons.
The plan should have been more focused on the people hardest hit by the crisis: households becoming unemployed and people at risk of falling into poverty: the young who cannot find a
job and are not entitled to any benefit; the unemployed who reach the end of the period of benefit entitlement.
Table 15. Random benefits?
Income in minimum
wage
by uc PSA ARS Income
tax Total Total by uc Single 0.5 0.5 200 0 0 200 200 1 1 200 0 0 200 200 1.25 1.25 0 0 0 0 0 Couple 0.75 0.5 200 0 0 200 133 1.5 1 0 0 0 0 0 1.875 1.25 0 0 234 234 156 Family with 1.15 0.5 200 150 0 350 152 2 children of school age 2.3 1 0 150 0 150 65 2.875 1.25 0 0 529 529 230
Source: own estimations.
What assessment of the French fiscal package?
It is difficult to assess the impact of this fiscal plan:
1. What is the amount of additional investments induced? Will they be implemented in 2009 or later?
2. What will be the impact of measures designed to improve companies’ cash-flow? According to OFCE’s estimates, the effective stimulus package amounts to 19 billion euros in 2009 and will have an effect of 0.8% of GDP (without Barro-Ricardo effect and without coordinated stimulus package effects, table 16).
Table 16. An assessment of the French fiscal package: OFCE’s estimates
In billion euros Announced stimulus Effective in 2009 Multiplier Impact on GDP Public investment 4 3 1.2 3.6 Public corporations investment 4 2 1.2 2.4 Local government investment 2.5 1.5 1.2 1.8
Support to firms’ cash
flow 11.4 7.1 0.4 2.8 Housing sector 1.8 1.4 1.2 1.7 Car industry 0.2 0.2 1.2 0.25 Employment policies 1.2 1.2 1.0 1.2 Social measures 2.8 2.8 0.8 2.25 Total 28.0 (1.4% of GDP) 19.2 (1.0% of GDP) 16.0 (0.8% of GDP)