AN EVALUATION FRAMEWORK FOR DATA QUALITY TOOLS
(Practice Oriented) Virginie Goasdoué EDF R&D [email protected] Sylvaine Nugier EDF R&D [email protected] Dominique Duquennoy A.I.D. [email protected] Brigitte Laboisse A.I.D. [email protected]Abstract: Data Quality is a major stake for large organizations and software companies are
proposing increasing numbers of tools focusing on these issues. The scope of these tools is moving from specific applications (deduplication, address normalization etc …) to a more global perspective integrating all areas of data quality (profiling, rule-detection…). A framework is needed to help managers to choose this type of tool. In this article, we focus on tool-functionalities which aim to measure the quality of data(bases). We explain what one can expect of such functionalities in a CRM context, and we propose a general matrix which can be used for the evaluation and comparison of these tools.
Key Words: Framework, Data Quality, DQM, Information Product, Criteria, Connectivity, Deduplication,
Integration, On-line interface, Address normalisation, Relevancy, Consistency, Accuracy, Completeness.
1 I
NTRODUCTION
Over the past few years, data quality has become a major concern for large companies in various activities, for instance in customer relationship management (CRM), data integration or regulation requirements. Poor data quality generates maintenance and repair costs. Beyond these economic aspects, poor data quality can also affect customer satisfaction, reputation or even strategic decisions…
It is therefore very important to be able to measure the quality of data (bases). Some market players propose software contributing to this task e.g. Data Quality (Informatica), DataFlux (SAS), Quality Stage (IBM) and Data Quality (Business Object), BDQS (BDQS)1. These software packages will at minimum
allow the discovery of data quality issues, the measurement of data quality problems and quality monitoring. For simplicity, such tools are called data quality management tools in the following chapters. This article focuses on the choice of a data quality management tool. This problem is not as simple as it may seem as it raises crucial questions such as: “What do we expect of such a tool?” and “How can we compare these tools fairly?” Our goal is to attempt to answer these two questions.
The contribution of this paper is twofold:
we explain what one can expect of a data quality
management
tool in a CRM context, andwe propose a general matrix which can be used for the evaluation and comparison of these tools’ specific functionalities. We have also constructed benchmark samples for a list of criteria. These samples include partly “correct” data and partly “incorrect” data, the notion of correct or incorrect being measured according to the criteria.
Section 2 presents the context of this work (the company for which the work was carried out, its background in quality management, its quality issues, etc). Section 3 provides a general matrix containing all the functionalities which can be expected of a data quality
management
tool i.e., all criteria which can be taken into account for the comparison of such tools. We also explain in Section 3 how our matrix was used to evaluate tools in the case of a French utilities company. We conclude in Section 4.2 B
ACKGROUND
The EDF Group is an integrated energetic utility, and manages all aspects of the electricity business: deregulated activities (generation, supply, trading) or regulated activities (transmission, distribution). Here, we focus on a commercial aspect of the group. EDF has a strong footing in Europe, with a total of 40.2 million customers worldwide (including 28 million in France). EDF employs 156,524 people worldwide (including 106,565 in France). In 2006, the Group recorded consolidated sales of €58,932 million, net income (Group share) of €5,605 million.
The Research and Development Division (EDF R&D) of a large company like EDF, deals with large numbers of important tasks. Among these missions, we will focus on those related to the objective of the present paper. Every operational entity within the company can call on EDF R&D to work on emerging problems or to investigate new methodologies. EDF R&D needs to anticipate these requirements in order to be able to recommend appropriate methods and software according to the company’s needs and tasks. This implies paying constant attention to emerging methods and research (in particular in the academic community) and following the evolution of software in the market.
This paper focuses on work related to software. A classic way to evaluate software consists of defining an evaluation procedure. This procedure must be generic enough to enable the evaluation of all of the software packages under the same criteria in the same conditions. We believe that this approach is the fairest way to compare software. Moreover, EDF R&D has already defined this type of protocol in order to evaluate RSPV (
Reorganization, Standardization, Postal Validation
)2 software [16], Text Mining tools [17] [19], and automatic text summary tools [15].We focus here on Customer Relationship Management (CRM) databases. Business-to-Business and Business-to-Consumer databases process large volumes of multi-source information including the customer’s: name, location information, energy consumption, marketing scores, etc. It is not unusual to find databases comprising several terabytes of data. Given the complexity of the information, the database structure is often highly complex (hundreds of tables).
In this complicated context, it seems obvious that data quality cannot always be excellent. Errors due to insufficient data quality can lead to a certain number of (sometimes disastrous) consequences [21]: wrong decisions, negative financial impact, additional operating costs, customer dissatisfaction, tarnished corporate image, loss of confidence among users …
The general context of data quality
Data quality emerged as an academic research theme in the early ‘90’s. In large companies, awareness of the importance of quality is much more recent.
The primary meaning of data quality is data suitable for a particular purpose (“fitness for use”, “conformance to requirements”, “a relative term depending on the customers’ needs”). Therefore the same data can be evaluated to varying degrees of quality according to users’ needs (see Figure 1). Such a utilitarian vision depends on how well the representation model lines up with the reality of business processes in the “real world” [2]. The different ways in which the project leader, the end-user or the database administrator evaluate data integrity
produces a large number of quality dimensions. A vast number of bibliographic references address the definition of criteria for measuring data quality. Criteria are usually classified into quality dimensions ([6], [11], [18], [20], [21], [24] for an overview). From an operational point of view, criteria need to be ranked according to resources and users’needs. In practice, criteria which are retained for measurement and management relate to genuine concerns arising from data quality (each criterion can be crucial for a project’s success). Each information system project needs to define its own quality criteria according to the planned usage framework.
A study was conducted in EDF [14] in order to identify data quality problems encountered by the EDF information systems department, and to assess their cost. Different personnel working with data (analyst, supplier, functional administrator, technical administrator, designer, decision-marker …) were interviewed. This study showed that several quality dimensions obtain a consensus in the company. Accuracy (correctness), completeness, relevancy and consistency quality dimensions (see Table 1) are designated as the most important dimensions. We detail them below.
Dimensions and some related questions Definitions Some metrics Some improvement opportunities Completeness
Is a concept missing? Are there missing values in a column, in a table? Are there missing values w.r.t. a reference population?
Rate of missing values
Crosschecking or external data acquisition
Imputation with statistical models Statistical smoothing techniques
Accuracy
Closeness between a value v and a value v’ considered as the correct representation of the reality that v aims to portray
Number of incidents or malfunctions (marketing campaign feedback) Comparison with reality
Analysis of consistency and likelihood controls
Meta-data: degree of reliability
Consistency
Data are consistent if they respect a set of constraints
Computation of
discrimination power for controls
Definition of a control strategy Comparison with another, apparently more reliable, source
Relevancy Is the data useful for the task
at hand? Degree of utility
Survey (helps to improve relevancy of planed tasks for maintaining and improving data quality)
Table 1 - Main theoretical dimensions selected within EDF projects
2.1 Completeness Issues
Completeness applies to values of items and to columns of a table (no missing values in a column) or even to an entire table (no missing tuples in the table) (see [1]). In production databases, great attention is paid to completeness issues where they are essential to the correct execution of business processes (for example: the correct aggregation of invoices requires the presence of all invoice lines). Dealing with large data warehouses, a good level of completeness is often crucial since information can be used to improve customer relationship management.
In practice, it is fairly straightforward to measure completeness within an operational process. In the context of marketing databases, it seems to be the most frequently reported among all quality criteria [14]. In the same way, control and improvement of completeness can naturally be plugged into the process either at the source, or during the ETL phase (for control purposes) or even at the end of the chain (with end-user queries).
EDF R&D has developed and implemented data mining techniques to compensate for missing data such as certain “key” customer characteristics [9]. A prototype called DECLIC-L encapsulates these statistical, data mining and exploration processes. DECLIC-L also allows automatic calculation of a predictive model for database enrichment. All tasks have been automated in order to help end-users to analyze and clean data. DECLIC-L produces results which enable the comparison of a model’s performance (percentage of correct predictions) with the confidence limit of the predictions (probability that the predictions will be correct). One of the major strengths of this method is that each predicted value is given with its associated statistical precision.
2.2 Accuracy Issues
Accuracy is often connected to precision, reliability and veracity. In the case of a phone number, for instance, precision and accuracy are equivalent. In practice, despite the attention given to completeness, accuracy is often a poorly reported criterion since it is difficult to measure and often leads to high repair costs.
This is due to the fact that accuracy control and improvement requires external reference data. In practice, this comes down to comparing actual data to a true counterpart (for example by using a survey). The high costs of such tasks leads to less ambitious verifications such as consistency controls (for example French personal phone numbers must begin with: 01, 02, 03, 04, 05) or based on likelihood (disproportional ratios of men versus women).
2.3 Consistency Issues
A consistency factor is based on a rule, for example, a business rule such as “town address must belong to the set of French towns” or “invoicing must correspond to electric power consumption”. Consistency can be viewed as a sub-dimension of accuracy. This dimension is essential in practice in as much as there are many opportunities to control data consistency. Consistency cannot be measured directly: it is defined by a set of constraints. Instead, we often measure the percentage of data which satisfy the set of constraints (and therefore deduce rate of suspect data). Consistency only gives indirect proof of accuracy. In the context of data quality tools, address normalisation and data profiling processes use consistency and likelihood controls. For example, EDF selected the Normad RSPV tool for managing postal addresses after an evaluation of different tools of the market.
2.4 Relevancy Issues
Relevancy corresponds to the usefulness of the data. Database users usually access huge volumes of data. Among all this information, it is often difficult to identify that which is useful. In addition, the available data is not always adapted to user requirements. For this reason users can have the impression of poor relevancy, leading to loss of interest in the data(base). Relevancy is very important because it plays a crucial part in the acceptance of a data source. This dimension, usually evaluated by rate of data usage, is not directly measurable by the quality tools so we do not discuss it here.
The extent of information acquisition and management costs, the financial and strategic stakes associated with their usage, cause users to insist that providers guarantee the quality of information. The term “information certification” is being used more and more frequently. In France, for example, the energy markets authority (Commission de Régulation de l’Energie), requires the electricity distributor to validate the reliability of the information sent to the different market players.
In this context, software companies offer a range of tools dedicated to data management such as ETL (Extract-Transformation-Load), MDM (Master Data Management), DQM (Data Quality Management). This article is focused on the DQM tools, and especially on Data Quality Measurement functionalities.
3 P
URPOSE
The aim of this study is the creation of a methodology for evaluating Data Quality Measurement Tools. This approach can be divided into four main points:
• The scope of the tools with regard to evaluating data • The definition of a list of evaluation criteria,
• Unit tests specified by main functionality, and
• Integration tests based on business cases on which the different criteria will be measured.
3.1 Scope of Tools
The first generation of data quality tools corresponded to dedicated data cleansing tools such as address normalisation tools and de-duplication tools. During the last 10 years, we have observed the generalization of a new kind of software: ETL tools, which allow the optimization, through user-friendly interfaces, of the alimentation process. Recently, some editors have started to offer tools dedicated to data quality management. Most of these have now been bought out by ETL editors such as: SAS (DataFlux), Informatica (Data Quality), and IBM (Quality Stage) for example. The result of these acquisitions is a new category of tools: Data Quality Management tools (DQM), which generally integrate profiling, parsing, standardization, cleansing and matching processes.
In this paper, the focus is on the measurement functionalities of DQM tools. What do we mean by data quality measurement? The list of functionalities covered in general are: profiling, matching, rule management. The goal is to explore the data, find outliers and records with problems, and define cleaning rules. The methods used are at the frontiers of three types of application:
- normalization, de-duplication tools, - statistical tools, and
- ETL tools.
Depending on the borders which are defined and on the scope of the project, the list of data quality tools will belong to one or another type of application. In this article, we will focus on functionalities which are designed for detecting and measuring problems.
3.2 Criteria
The Gartner group [10] takes into account six aspects of data quality problems in comparing DQM tools: Parsing and standardization, Generalized “cleansing”, matching, profiling, monitoring, enrichment. Other studies on this market are available such as: [5], [4], [13], [27], and [26]. Criteria listed in this paper are featured in most of our references. Our specific contributions in terms of the criteria discussed below are as follows:
- Detailed specification of most of the criteria. Although the main sections have already been published at a “high level”, we describe all of the detailed specifications needed to evaluate tools in an operational mode.
- The criteria are adapted to the context of EDF, and more generally to CRM data environments with multiple sources and large volumes of data relating to clients’ energy consumption. This means that data quality tools not only need to deal with immediate issues regarding addresses; parsing, duplicates,… but also address continuous data issues : outliers in the consumption data, missing observations (over time),…
- The experience of A.I.D. as a data quality service provider has enabled us to add certain criteria which we have found useful in an operational mode.
- A focus on measurement functionalities.
The criteria presented below are classified as: general criteria, address normalization, deduplication, consistency rules, reference files, reporting, integration, and statistics.
3.2.1 General Criteria
General criteria applicable to choosing any type of software (available languages, interface user-friendliness, availability and language of help, error management, turnover of the publisher …) or which are specific to EDF (the software company is already a provider for EDF, budget, …) will not be detailed here but are taken into account in the study.
Item Criteria Comment
G2 Detection and use of Patterns Two levels of patterns can be generated: - level of pattern generated (alpha numeric, numeric, etc …), - syntax of patterns: standards.
G6 Availability of specific algorithms Verifying emails, phone numbers for example. This is where we look for available reference libraries (first names, country codes etc …)
G7 Merge Simulation
For example, during a migration, it can be useful to dynamically simulate the process and result of merging of two or more sources. Priorities must be set by field or data blocks and this by:
- origin of the information, - date of the information,
- quality attribute (result of the address normalisation for example). G9 Profiling Relationships between variables, summary statistics: Min Max, Average etc … G10 Checking for relationships between data Research of interrelated columns in a table or in several tables.
G11 Available Cleansing Functions The list of data Cleansing functions available. G12 Temporal Management
Several notions: (1) Capability to freeze a version of the data and compare the evolution at n+1 (can only be performed on a sample), and (2) Comparison of Aggregates on n periods with evolution. Capability of predictive evolution.
G14 Analysis of External Databases Comparison, Enrichment Simulation, Testing de-duplication with an external database. G15 Meta Data Management CWM (Common Warehouse Metadata from Object Management) Compliancy.
Item Criteria Comment
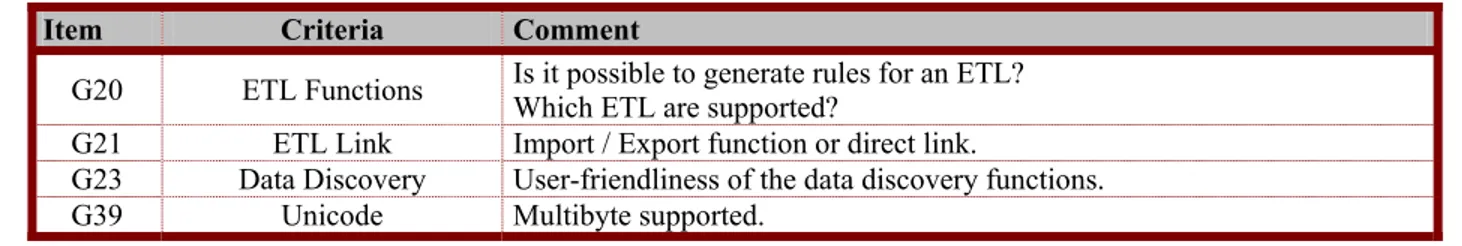
G20 ETL Functions Is it possible to generate rules for an ETL? Which ETL are supported? G21 ETL Link Import / Export function or direct link.
G23 Data Discovery User-friendliness of the data discovery functions.
G39 Unicode Multibyte supported.
Table 2 - General criteria
3.2.2 Address normalization criteria
In the CRM world, address normalization is a very important element. The costs generated by non normalized addresses are direct additional costs because the quality of address normalization directly impacts the postal rates. Table 3 shows the major criteria but the list is not exhaustive.
Item Criteria Comment
N1 Compliance with official address normalization requirements and certificates
For example, in France, a certification is given by the Post Office. To qualify, the tool must pass a series of tests. A sample of 1,000 records is provided and the results are evaluated in terms of correct or erroneous address normalization and error rates attributed to the tool. The certification is awarded for two years and has to be renewed every two years.
N3
List of countries. For each country, indicate: - The origin of the reference tables (Post Office,…)
- Update frequency
- What is the level of detail for the availability and processing of reference tables: zip code/city, street, number in the street, name of the recipient.
Are subscription costs included in the price of the tool?
Most normalisation tools claim to cover a variety of countries. In reality, knowing the level of detail at which each country is covered and the origin / frequency of subscription for reference tables is the most valuable information.
N4
Indicate the levels of the normalization return code. This code gives all the details about the level of normalisation which has been achieved (zipcode, street…).
Pas de tests prévus
N5 Does the software provide information on the degree of effort required to correct the address?
For this code, we suggest using the levels employed by the French Post Office during certification in slightly more detail:
- No update: the initial address is correct
- Minor update (special character to remove, uppercase...): update possible without a dedicated tool. - Major update: for instance, correct the street name. - Address warning: the address needs to be reviewed.
For example, the street is ambiguous (the exact match does not exist and two approximate matches exist). - Address error : normalisation is not possible
N6
The tool produces two outputs: a normalized address normalized, but also a standardized address. By standardized address, we mean an address parsed as: street number, street name… These elements must be in the official language of the geographical location. For example, in Belgium, if the input address is in French, the
Address normalisation tools are often the first step in the de-duplication process. In this context, standardization is an element which prepares for deduplication.
Item Criteria Comment
normalized address will be in French, and the standardized address can be in Dutch, if the official language of the address is Dutch. Table 3 - Address normalization criteria
3.2.3 Deduplication criteria
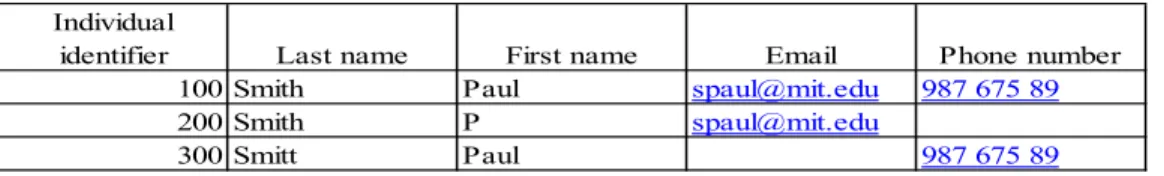
Deduplication (also known as object identification, record linkage, duplication detection, reference matching or entity-name matching) is an activity which has generated many academic papers [25], [5], [7], and most data quality tools have already integrated this functionality, albeit at very different levels. We recall that object identification is the recognition in one or multiple tables of similar records corresponding to the same entity. For example, in figure 2, there are multiple occurrences of Paul Smith not recognized as the same person.
Individual
identifier Last name First name Email Phone number
100 Smith Paul [email protected] 987 675 89
200 Smith P [email protected]
300 Smitt Paul 987 675 89
Figure 1 - Samples duplicates
The criteria for comparing the tools in this section are major factors contributing to successful deduplication: method of comparison, scope of comparison…
Item Criteria Comment
D1
The deduplication process is based on: 1. A Match key, or 2. A comparison within an area, or 3. A sorted neighborhood window.
In the first case, the objective is to find keys which enable the system to recognize duplicate records. In the second case, an area such as the zip code is defined and all the records with the same zip code are compared. In the last case, the records are sorted on a key and each record is compared to the w previous records, where w is the window size.
The first method is technically much easier to implement because the key is treated as an index in the database.
The second method generates
∑
Tp=1N
p(
N
p−
1
)
/
2
comparisons where Np is the number of records for the area p, and T is the numberof areas. Considerable technical resources can be involved. The last method generates wn comparisons (n being the total number of records and w the size of the window).
The first method has limited results but can cover the needs for BtoC data.
D2 The tool allows data transformation: uppercase, ltrim, soundex, cleaning noise words….
Field standardization:
- Allows match keys or area comparisons to construct the same key from different data (lower/uppercase, blanks at the beginning of a string, …),
- Avoids generating false proximities through comparisons of fields containing common terms such as “limited” or “street”.
D3
In the case of area or window comparisons, list of available distances : Edit distance, Hamming, Jaro, … and/or probabilistic method
The list of distance definitions available for comparing the fields of two records is one of the main criteria for obtaining a good deduplication. The facility to select a probabilistic method takes into account the overall frequency of words/strings and associates a conditional probability. This is a useful option to take into account as complementary criteria.
Item Criteria Comment
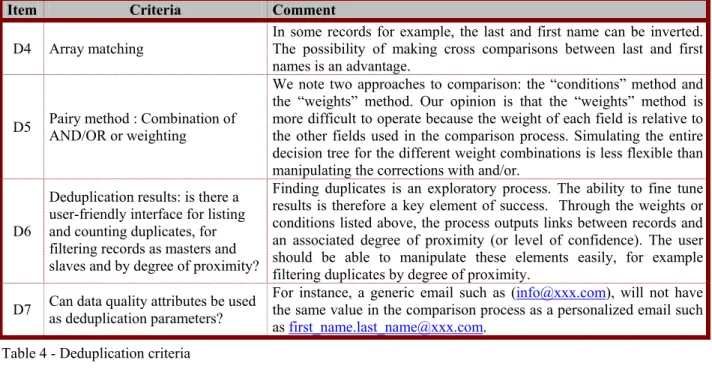
D4 Array matching In some records for example, the last and first name can be inverted. The possibility of making cross comparisons between last and first names is an advantage.
D5 Pairy method : Combination of AND/OR or weighting
We note two approaches to comparison: the “conditions” method and the “weights” method. Our opinion is that the “weights” method is more difficult to operate because the weight of each field is relative to the other fields used in the comparison process. Simulating the entire decision tree for the different weight combinations is less flexible than manipulating the corrections with and/or.
D6
Deduplication results: is there a user-friendly interface for listing and counting duplicates, for filtering records as masters and slaves and by degree of proximity?
Finding duplicates is an exploratory process. The ability to fine tune results is therefore a key element of success. Through the weights or conditions listed above, the process outputs links between records and an associated degree of proximity (or level of confidence). The user should be able to manipulate these elements easily, for example filtering duplicates by degree of proximity.
D7 Can data quality attributes be used as deduplication parameters? For instance, a generic email such as (the same value in the comparison process as a personalized email [email protected]), will not have as [email protected].
Table 4 - Deduplication criteria 3.2.4 Rule Consistency Criteria
As viewed in Section 2.3, consistency validation is a first step towards checking for accuracy. It consists of auditing the implementation of a set of business rules.
The first step is to verify whether a rule can be applied. If it can be applied, we will measure the user-friendliness of its application by a software function or computer program:
- if the rule is programmed, is the language standard or proprietary ?
- if the rule is applied through a software function, how many steps need to be carried out in order to obtain the result ?
Item Criteria Comment
COH2 Comparison of two fields. For example, check whether the number of employees of a site is less than the total number of employees of the company.
COH3 Transformation of a continuous field into ranges and comparison with another range field.
For example, calculation of the range of number of employees (site and company) and verify that the site range is less than or equal to the company range.
COH4
Aggregation of a field in a table linked to a master table by one to many and comparison with a field in the master table.
For example, aggregate the number of employees of the different sites of a company and compare the result to the total number of employees of the company.
COH5 Identify companies with diverging information. For example, two sites of the same company with a different total company number of employees. COH6 Comparison of a datum over time. Standard deviation, average, algorithms.
COH7 Application of different consistency rules depending on the value of an attribute. Table 5 – Rule Consistency Criteria
3.2.5 Reference File criteria
Again we will begin by checking that the criteria can be applied and if so, we will measure the user-friendliness of the application by the number of steps needed to obtain the result.
Item Criteria Comment
REF1 Find an external key in a single field of another table. REF2 Find an external key in another table using a combination of n fields.
REF3 Find an external key in a flat file. For example, looking for a first name in a list of first names. REF4 Lookup function with approximation. If available, describe what kind of
approximation algorithm is available.
For example, use of a string distance (Edit, Q-Grams, Levenshtein, …) to search for the closest first name in a complete first names reference file.
REF5 Lookup a field in a reference file and if the search is positive, comparison of fields. For example, searching for a fiscal id and if found comparison of the name / address. REF6 Creation of a reference file based on word frequency in a field and selection of the
words wth the highest frequency.
REF7 Validation of the consistency of a datum on a reference file. Table 6 - Reference Files criteria
3.2.6 Reporting criteria
The evaluation of the reporting facet concerns the available report models and the user-friendliness of the output interface. For example, Is the output dynamic? Can extreme values, atypical trends, or values close to pre-defined goals be highlighted or coloured? Etc.
Item Criteria Comment
REP1
The tool proposes functionalities facilitating the creation or the export of reports in OLAP cubes. If special formats containing OLAP cubes can be generated then they are compatible with existing OLAP tools (state which ones).
Creating OLAP cubes allows sharing huge multidimensional reports with a high number of users. Cubes are usually managed by relational or multi-dimensional DataBase Management Systems. Some major actors (such as Oracle, Microsoft, IBM, etc) propose OLAP solutions (see [23] for details).
For example, the evaluated tool could propose an export of the reports in a format adapted to some OLAP existing tools or the export in a star (or snowflake) template schema adapted to cube (multidimensional) storage.
REP2 Reports can be published on the web. Publishing on the web is well-suited to sharing information (reports) among several users. We believe this is a very important functionality.
REP3 Can classification by quality dimensions (completeness, accuracy, etc) appear in the report?
Quality dimensions (see section 2) are a useful and common way of classifying quality measures. The tool should provide a way to 1) assign a quality dimension to each measurement and 2) group these measurements in a report by the main quality dimensions. REP4
Quality goals can appear in the report. The report can graphically show the distance between values of quality measurements and their respective goals.
In a quality improvement approach, goals are often assigned to quality measurements. These goals have should appear in the report in order to facilitate analysis and decision.
REP5
The tool can display the evolution between two audit periods. The decision to emphasize the evolution can be controlled by a threshold.
This functionality graphically shows the evolution of data quality measures between two periods (two quality audits). It helps the user to see which quality measures increase or decrease over time. REP6
An general quality score can be computed by weighting the values of quality measurements.
Given this requirement, a user may wish to define an overall quality score, i.e. an aggregation of quality measurements. This aggregation is often defined as a weighted aggregation of quality measurements.
Item Criteria Comment
REP7 The general score can be adapted to each user (or profile / group of users).
Different users can have different overall quality scores. For example, the rate of missing values in the phone number attribute can be important to one user i and meaningless for another user j. Therefore the measurement will not bear the same weight in the general score defined by i and in the overall score defined by j. REP8 Secured access to reports. Quality reports must be secure. Security levels define which reports a user can access.
REP9 The report client tool is web based. The drill down functionality can be used via a web based interface.
Users often prefer to access reports without having to install software on their computers. A web browser should be sufficient for accessing reports. In this case, the drill down functionality should still operate, as this is often very useful for examining reports.
REP10 A publication server is available and allows navigation on HTML pages. Table 7 - Reporting criteria
3.2.7 Integration
Item Criteria Comment
I1 Audit functions are available through web services.
I2 Connectivity: DBMS can be accessed through ODBC and through native connections. I3 Connectivity: specific software such as SAP, SAS…, can be accessed.
I4 Detected errors are analysed online by functions. Records containing the errors are highlighted dynamically or a stored in a temporary table, or in a table of the data quality tool.
I5 Access to the dictionary: practical ability to access all other users tables when permission has been granted. Table 8 - Integration
3.2.8 Statistics
If the software is directly connected to the DBMS and uses SQL, all of the functions listed below are linked to the DBMS and not to the tool. The difference will be lie in the method of calculating query results either via temporary table or on the fly.
Item Criteria Comment
COM1 Existence of a user-friendly Interface for counting This interface will not require knowledge of SQL. If such an interface exists, a list of available functions will need to be created.
COM2 Capability of performing simple counts. Count, distinct null values for example. COM3 Capability of performing simple counts on ranges.
COM4
Aggregation functions (Min Max , Average, standard deviation, sum, decile)
Creation of ranges from the results. COM6 Dynamic Join.
COM7 Counts on different tables using aggregate functions. e.g. Average transaction amount over the last year, per customer. COM8 Generating samples. Random samples or by quotas.
COM9 Comparison of variables, of statistics on variables Compare average, max, rate.. Table 9 - Countings
3.3 Choosing functional indicators or metrics
To evaluate the criteria we have selected and described above, it is necessary to define indicators on which to measure these criteria. However defining indicators will depend on operational needs which es why different indicators can evaluate the same criteria.
In our approach, the choice of indicators is guided by the practice of two types of activity or task: CRM processes and load curve analysis jobs (a process specific to EDF). For CRM, the most important measurements are the capacity to identify patterns and the validation of consistency rules (aggregated counts, correlation of variables). For load curve analysis, the essential measurement is the difference between distribution profiles (descriptive statistic functions)
Some examples of indicators in the EDF context are:
- Ind8: detection of patterns on CICE code (unique identifier for an energy meter type), selection of the most frequent and valid patterns, identification of incorrect patterns, number of incorrect patterns per type of source,
- Ind9: number of energy meters per postal address, - Ind12: validation of the rate code,
- Ind15: number of negative values per load curve and per year,
- Ind21: consistency between the invoiced use and the use measured by the load curve, - Ind23: research of extreme values in a curve.
For each of these indicators, we will test the performance of the tool with regard to of the amount of data (30 millions of records), the expressiveness of the language used (to define business rules) and the management of reference files or dictionaries.
3.4 Benchmark samples
The facility to generate benchmark samples was chosen so that users would be able to obtain a good representation of multiple error cases. A.I.D., through their experience of data manipulation in multiple contexts, were able to provide samples for a list of criteria. These samples included partly “correct” data and partly “incorrect” data. The correct or incorrect nature of the data was measured according to the criteria. For example, for phone numbers, a list of correct patterns was defined for France and the sample classified the phone numbers as correct/incorrect based on consistency with these patterns.
The comparison matrix introduced in Figure 3 enables a score to be calculated for each software package. Hypothesis
Tool result
The data is classified correct
The data is classified incorrect
The data is correct x1 x2
The data is incorrect x3 x4 1 2 3 4
4 1 x x x x x x Score + + + + =
Figure 2 - Comparison Matrix
Note: we assume that the classification errors (x2 and x3) have the same weight. In some cases, the cost to of classifying a data as correct when it is incorrect and vice versa is not the same. For this reason it can be useful to introduce the notion of weight.
3.4.1 Focus on deduplication
Concerning deduplication, some methods have been already published as [22], [8] or [5] in order to compare the results of two different deduplication processes. We propose using the index below which:
- combines the measurement of false matches and of false non-matches, and
- provides an automatic, easy method of calculation taking into account the volume of records classified as pairs by deduplication methods.
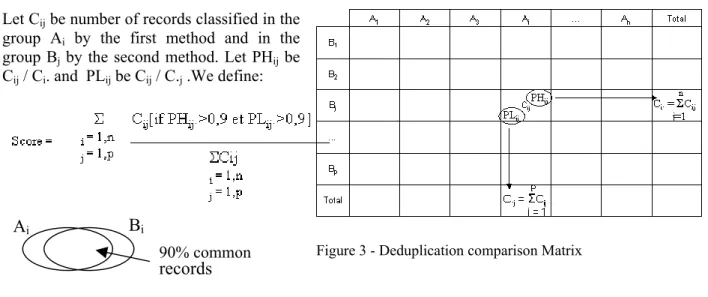
In our example, A is the result of a deduplication process with n groups and B is the result of the software evaluated with p groups. Regarding the matrix shown in Figure 3:
Let Cij be number of records classified in the
group Ai by the first method and in the
group Bj by the second method. Let PHij be
Cij / Ci. and PLij be Cij / C.j .We define:
3.5 First results
For confidentiality reasons we cannot detail our results or the scores attributed to each tool. However, we can reveal some of the discriminating factors which were observed during the evaluation.
The first factor is connection to the information system: most tools provide connexion to the RDBMS through an ODBC link, sometimes using a specific driver such as SQL*Net for Oracle. We found a differentiating factor in the data analysis mode. We observed two approachs: “flow” analysis and specific database analysis. In the first case, the tool reads the data and performs the analysis on the fly. In the second case, the tool reads the data, creates a temporary database specific to the task in hand and performs analysis on this database. There are supporters for each school, however we have two remarks: the risk of poor performance for the first solution, the problem of copying data for the second solution.
The second discriminating factor is the deduplication module: some tools integrate advanced modules with powerful functionalities, distances, optimisation of comparisons (Informatica Data Quality for example). Some tools have very basic deduplication modules based only on match-keys.
The third factor is ETL integration: some editors generate rules that are recognizable by designated ETL’s, others have no integration facility even though they may distribute an ETL package.The reason for this is that the data quality tool offered is often the result of an acquisition and has not (yet) been integrated with the other products in the editor’s catalogue.
Another element is the on-line interface: the trend is to offer web access to the cleaning and evaluation functionalities of the data quality tool. The differentiating factor arises from the ease and of setting up the solution and the subsequent response times.
A common point: most editors have integrated an external solution for address normalisation, such as QAS or Address Doctor.
At this stage, we have evaluated Informatica Data Quality, SAS Data Flux is in progress, IBM Data Quality Stage will be certainly the next.
Figure 3 - Deduplication comparison Matrix
A
iB
i90% common
3.6 Using the evaluation framework
EDF R&D is evaluating different data quality measurement tools based on the approach described here. Given a tool T and a job J, the evaluation of a tool consists in assigning a certain number of scores (described bellow) measuring the adequacy of T to J. The process compounds two steps.
Step 1: R&D fills in the matrix for tool T. Scores are assigned to each criterion c for three dimensions3: Dimension 1: the level of availability, called Nav(c,T), measuring whether the criterion c can be
evaluated (or is available) in the tool4;
Dimension 2: the level of criterion evaluation ease, called Nimp(c,T);
Dimension 3: the level of output quality, called Nans(c,T), corresponding for example to the score
described in Section 3.4.
Step 2: Two different jobs do not necessarily require the same functionalities and, if they do, they do not attach the same importance to each criterion or to each dimension. A way of taking this into account is to define a weighting system for each job involved in the evaluation. This weighting system is defined by R&D together with -some- users (performing the job). In practice, two weighting systems are defined:
1. A weighting system for the dimensions. This allows allocation of a score to each criterion. Let p1(J), p2(J) and p3(J) be the weights respectively affected to dimensions 1, 2 and 3. The score of a
criterion ci with respect to a job J is N(ci,T,J)= p1(J)xNav(ci,T) + p2(J)xNimp(ci,T) + p3(J)xNans(ci,T).
2. A weighting system for the criteria. This allows allocation of a score on each axis. Let
{
ci1≤i≤n}
be the criteria of the matrix. For each ci, let wi(J) be its associated weight. The score of Dimension
1 is ( , ) ( ) ( ) 1 i av n i i av T J w J N c N
∑
≤ ≤ ×= . This formula can easily be adapted to dimensions 2 and 3. By extension, the global adequacy score of T to J is: N(T,J)=p1(J)xNav(T,J)+ p2(J)xNimp(T,J)+ p3(J)xNans(T,J).
Based on this framework, we can compare (1) different tools for a job and (2) the adequacy of a tool for carrying out different jobs. It is easy to add a job to an overall test: one simply has to perform Step 2 and calculate scores. Adding a tool is also easy: one simply has to perform Step 1 and calculate scores.
4 C
ONCLUSION
In this paper, we have presented a framework for the evaluation of data quality measurement tools in a CRM context. We have defined criteria enabling the evaluation and comparison of these tools’ functionalities. This approach involves a precise definition of what one can expect of such a tool in this context. Criteria, classified in six criteria types, were presented as a matrix which can be used in a general evaluation/comparison approach.
The matrix will certainly be enriched each time it is used. For example, a too general criterion could not discriminate a new tool. It could be necessary to split it in order to precisely display every tools’ dissimilarities.
Moreover, in order to deliver an evaluation of results quality, we provided benchmark samples per some functionality measurement. Samples are needed for more criteria. Furthermore, our samples are currently only based on our French experience: we need to enlarge their scope on an international level.
3 Sometimes, one of the three dimensions has no object. In this case, a default score of 0 is assigned. This has no critical effect on the subsequent procedures.
4 We note here that the result is not boolean because it we can have, for example, 0=“no”, 1=“partly”, 2=“no, but should be available in a future version”, 3=“yes, but requires using the SGBD functionalities accessed through the tool and is not performed by the tool itself”, 4=“yes”.
5 A
CKNOWLEDGEMENTS
The authors would like to thank Delphine Clement (Hewlett Packard) for her helpful advice, Pierre Troxler (IT and Telecoms unit of EDF), Sandra Graff and all members of the “Observatoire des Consommations” team (EDF R&D) for their precious help and time.
6 R
EFERENCES
[1] Aebi D., Perrochon L. Estimating data accuracy in a federated database environment In Proc of the 7th Intl. Conference on Information Systems and Management of Data (CISMOD’93), 1993.
[2] Agosta L., Definitions of Data Qualit IdeaByte July 14, 2000.
[3] Akoka J., Berti-Equille L., Boucelma O., Bouzghoub M., Comyn-Wattiau I., Cosquer M., Goasdoué V., Kedad Z., Peralta V., Nugier S., Si-Said S.: A framework for quality evaluation in data integration systems. Dans Proceedings of the 9th International Conference on Enterprise Information Systems, 2007 (ICEIS’07). [4] Barateiro J. and Galhardas H. A Survey of Data Quality Tools, Datenbank Spectrum 14 (2005)
[5] Batini C., Scannapieco M., Data quality: concepts, methodologies and techniques Springer 2006
[6] Berti L., La qualité des données et leur recommandation : modèle conceptuel, formalisation et application à
la veille technologique Phd Thesis, 1999.
[7] Berti-Equille, L., Journées CRM & Qualité des Données au CNAM – Qualité des données multi-sources : un
aperçu des techniques issues du monde académique 2005
[8] Clément D., Laboisse B. Création d’un référentiel d’indicateurs de mesure de la qualité des données 7èmes journées francophones « Extraction et gestion des connaissances » EGC Namur 2007
[9] Derquenne C., Goutier S. and Stéphan V. Tirer profit des sources externes pour l’enrichissement des bases
clients, In XXXVèmes Journées de Statistique, Lyon, Juin 2003
[10] Friedman, T., Bitterer A., Magic Quadrant for Data Quality Tools Gartner Group 2007 [11] Huang, K.T., Lee, Yang W., Wang R. Quality Information and Knowledge Prentice Hall 1998
[12] Kriebel, K. Evaluating the quality of information system Design and Implementation of computer based information systems, N. Szysperski and E. Grochla, eds. Germantown, Sijthoff and Noordhoff, 1979
[13] Les solutions de gestion de la qualité des données : Le comparatif. JDN Solutions. http://www.journaldunet.com/solutions/0612/061204-panorama-gestion-qualite-donnees/4.shtml
[14] Lincoln, Guisnel F., and Nugier S., and Stéphan V. Contrôle et amélioration de la qualité. Rapport de recherche EDF, HE-72/04/005/A, 2004
[15] Minel J.L., Nugier S., and Piat G. How to appreciate the quality of automatic text summarization. Examples
of FAN and MLUCE Protocols and their Results on SERAPHIN. Proc. of EACL (The European Chapter of
the Association for Computational Linguistics), pp.25—30, 1997
[16] Naulleau E. Rapport d’évaluation des logiciels Integrity et Normad Rapport de recherche EDF, E72/EN/02-04, 2002
[17] Nugier S., Quatrain Y., Peradotto A., Garrouste D. Protocole d’évaluation de logiciels de Text Mining
Rapport de recherche EDF, HE72/03/011/A, 2003
[18] Olson, J., E. Data Quality, the accuracy dimension Morgan Kaufmann, 2003
[19] Quatrain Y., Peradotto A., Nugier S. Evaluation d’outils de Text Mining dans un contexte industriel Colloque International sur la Fouille de Texte CIFT 2004, La Rochelle
[20] Redman, T., C. Data Quality for the Information Age Artech House Publishers, 1996 [21] Redman, T. C., Data Quality: The Field Guide Digital Press 2001
[22] Talburt John R., Hess Kimberly, Wang Richard, Kuo Emily, An Algebraic Approach to Quality Metrics for
Customer Recognition Systems – ICIQ-04 (MIT IQ) Conference Program 2004
[23] The Olap Report (online) resource available from: http://www.olapreport.com/
[24] Wang R.Y., Lee Y.W., Pipino L.L., Funk J.D. Journey to Data Quality The MIT Press 2006
[25] Winkler WE., The State of Record Linkage and Current Research Problems" Statistics of Income Division, Internal Revenue Service Publication R99/04, 1999
[26] www.infoimpact.com