1
i
LES PROCESSUS SÉDIMENTAIRES DURANT LE PETIT ÂGE
GLACIAIRE ET L’ACTUEL DANS L’ARCHIPEL ARCTIQUE
CANADIEN
Mémoire présenté
dans le cadre du programme de maîtrise en Océanographie en vue de l’obtention du grade de maître ès sciences
PAR
© SARAH LETAÏEF
iv
Composition du jury :
Gwenaëlle Chaillou, président du jury, UQAR-ISMER Guillaume St-Onge, directeur de recherche, UQAR-ISMER
Jean-Carlos Montero-Serrano, codirecteur de recherche, UQAR-ISMER France Lagroix, examinateur externe, IPGP, Paris
vi
UNIVERSITÉ DU QUÉBEC À RIMOUSKI Service de la bibliothèque
Avertissement
La diffusion de ce mémoire ou de cette thèse se fait dans le respect des droits de son auteur, qui a signé le formulaire « Autorisation de reproduire et de diffuser un rapport, un mémoire ou une
thèse ». En signant ce formulaire, l’auteur concède à l’Université du Québec à Rimouski une
licence non exclusive d’utilisation et de publication de la totalité ou d’une partie importante de son travail de recherche pour des fins pédagogiques et non commerciales. Plus précisément, l’auteur autorise l’Université du Québec à Rimouski à reproduire, diffuser, prêter, distribuer ou vendre des copies de son travail de recherche à des fins non commerciales sur quelque support que ce soit, y compris l’Internet. Cette licence et cette autorisation n’entrainent pas une renonciation de la part de l’auteur à ses droits moraux ni à ses droits de propriété intellectuelle. Sauf entente contraire, l’auteur conserve la liberté de diffuser et de commercialiser ou non ce travail dont il possède un exemplaire.
viii
Why explore? It is as well as those who ask such a question that they are others who feel the answer and never need to ask.
x
REMERCIEMENTS
Je tiens tout d’abord à remercier mon directeur Guillaume St-Onge pour m’avoir offert l’opportunité de ce projet ainsi pour son optimisme durant ces deux années. Un grand merci à mon co-directeur Jean-Carlos Montero-Serrano : merci pour ton soutien, tes remarques pertinentes et les bons moments passés sur le bateau. Tu m’as beaucoup appris. Je remercie Marie-Pier St-Onge pour son dévouement et l’aide précieuse qu’elle a apportés à l’avancement du projet. Merci à tous les techniciens Dominique Lavallée, Mathieu Babin et Quentin Beauvais pour leur aide constante à la manipulation des instruments, à Bassam Ghaleb pour avoir répondu à mes nombreuses questions concernant les datations au plomb ainsi qu’à Pascal Rioux et Christian Boutot pour ces très bons moments passés durant les missions en mer.
Une maîtrise c’est beaucoup de temps passé au laboratoire, c’est pourquoi je voudrais aussi remercier mes collègues du labo : Arthur Bieber, Julie Velle, Naïs Sirdeys, Quentin Duboc, Pierre-Arnaud Desiage, Myriam Caron, Simon Faye, Edouard Philippe et Charles-Edouard Deschamps pour toutes les questions ou interrogations que j’ai pu vous posées ainsi que pour les très bons moments que l’on a partagés durant les déplacements en congrès !
Merci aussi à mes différents colocs : Jean-François Beaudoin, Jordan Latour, Mathilde Chemel, Louis Landry-Massicotte et Pierre-Yves Francoeur pour m’avoir fait découvrir, chacun à votre manière, la culture québécoise ! En parlant de culture québécoise, un grand merci à mes acolytes de canot à glace pour la découverte de ce sport complètement déluré et atypique qui aide à finalement apprécier le rude hiver québécois !
L’opportunité d’avoir participer à l’école d’été sur le magnétisme à Minneapolis m’a permis de rencontrer Marco Albàn Albarran Santos. Gracias a ti por tu ayuda y tu
comprensión. Estoy muy contenta de haberte encontrado ! L’aventure québécoise m’a également
permise de rencontrer deux merveilleuses personnes : Safwen Khamassi et Fatma Dhifallah. Vous êtes vraiment géniaux, merci pour tout : les voyages à Percé, les bons repas de ramadan, les
xi
séances de sport suivis d’une poutine et tous les « tvt » ! J’aimerais aussi te remercier Nino pour tout le soutien que tu m’as apporté et ces moments avec toi qui m’ont fait beaucoup de bien.
Finalement, merci à ma famille pour leur soutien, merci à mes parents qui m’ont donné le goût du voyage. Merci à ma mère pour son courage et sa ténacité. Je dédie donc ce mémoire à mes parents et particulièrement à mon père qui, je l’espère, est fier de moi, là où il se trouve.
xiii
RESUME
Les propriétés géochimiques, physiques, sédimentologiques et magnétiques de 40 échantillons de surface et de base prélevés sur des carottes boîtes dans l’Archipel arctique canadien (AAC), du plateau canadien de la mer de Beaufort vers l’est jusqu’au détroit de Lancaster (plateau/pente du Mackenzie, golfe d’Amundsen, ouest de l’Île de Banks, détroit de M’Clure, les golfes de Coronation et de la reine Maud, les détroits de Victoria, de Barrow et de Lancaster) ont été analysés afin de déterminer les processus sédimentaires récents et ceux durant le Petit âge glaciaire (PAG). Dans un premier temps, la chronologie de sept carottes a pu être établie grâce aux mesures du 210Pb, où l’âge de la base des carottes est datée à ~1600 AD. Les différentes propriétés mesurées combinées à des analyses statistiques multivariées ont permis l’identification de trois provinces possédant des caractéristiques sédimentaires différentes : (1) la province de l’ouest (plateau/pente du Mackenzie, l’ouest de l’Île de Banks et le détroit de M’Clure) caractérisée par des associations géochimiques détritiques (Fe-Rb-Ti-Zn), d’important apports en matière organique, une dominance de magnétite et de minéraux magnétiques de faible coercivité et finalement un fort ratio Al/Ca (surtout durant le PAG) ; (2) la zone intermédiaire (golfe d’Amundsen et le golfe de Coronation) qui se distingue par la précipitation d’oxyhydroxydes Fe-Mn (durant la période récente), une concentration en minéraux magnétiques importante et constante ainsi qu’un mélange de matière organique d’origine marine et terrigène; (3) la province de l’est (Golfe de la reine Maud, détroit de Victoria, détroits de Barrow et de Lancaster) décrite par des apports de carbonates détritiques élevés, une matière organique d’origine marine et une prédominance de minéraux magnétique de haute coercivité ainsi qu’une augmentation de la concentration en minéraux magnétiques durant le PAG. Nos résultats confirment donc que la dynamique sédimentaire actuelle est surtout contrôlée par l’apport détritique fluviatile dans l’ouest et la zone intermédiaire alors que l’est est plus influencé par les sédiments issus de l’érosion côtière puis transportés par la glace. Les processus sédimentaires durant le PAG suggèrent une intensification de la décharge du Mackenzie, des conditions de glace et donc du transport de sédiment par celle-ci.
Mots clés : Archipel arctique canadien, Petit âge glaciaire, dynamique sédimentaire,
xiv
ABSTRACT
Sedimentological, geochemical, physical and magnetic properties of 40 surface and basal sediment samples of box cores collected throughout the Canadian Arctic Archipelago from the Canadian Beaufort shelf eastward to Lancaster sound (Mackenzie Shelf/Slope, Amundsen Gulf, West of Banks Island, M’Clure strait, Coronation and the Queen Maud Gulf as well as the Victoria Strait and the Barrow/Lancaster Sound) were analyzed in order to determine the modern and the Little Ice Age (LIA) sedimentary processes. Firstly, the chronology of 7 cores was established using 210Pb measurements, where the base is dated on average at ~1600 AD. The
different properties combined with multivariate statistical analyses have resulted in the identification of three provinces with distinct sedimentary characteristics during both periods: (1) The West province (Mackenzie Shelf/Slope, the West Banks Island and the M’Clure Strait) typified by detrital associations (Fe-Rb-Ti-Zn), important organic matter inputs, dominance of magnetite and low coercivity minerals and higher alluminosilicate contents especially during the LIA; (2) The Intermediate Zone (Amundsen and Coronation Gulfs) distinguished by Si-Al-Zr-Sr-K-Y associations, Fe-Mn oxyhydroxyde precipitation (particularly in the recent period), constant high magnetic grain concentration and a mixture between marine and terrigenous OM; (3) The East Province (Queen Maud Gulf, Victoria Strait and the Barrow/Lancaster Sound) described by high detrital carbonate inputs, marine organic matter, a dominance of high coercivity minerals and higher magnetic concentrations especially during the LIA. Our results confirm that the recent sedimentary dynamics are controlled by sediment supplies from the river discharges in the West and Intermediate Provinces whereas the East province is more influenced by sea-ice and coastal erosion. Sedimentary processes during the LIA suggest intensification of the Mackenzie River runoff, sea ice conditions and consequently of sediment transport by this latter.
Keywords: Canadian Arctic Archipelago, Little Ice Age, sedimentary dynamics, sedimentology,
xv
TABLE DES MATIERES
REMERCIEMENTS ... x
RÉSUMÉ ... xiii
ABSTRACT ... xiv
TABLE DES MATIÈRES ... xv
LISTE DES TABLEAUX ... xviii
LISTE DES FIGURES ... xix
LISTE DES ABRÉVIATIONS, DES SIGLES ET DES ACRONYMES ... 1
INTRODUCTION GÉNÉRALE ... 4
PROBLEMATIQUE: LE RECHAUFFEMENT CLIMATIQUE DANS L’OCEAN ARCTIQUE ... 4
PRESENTATION DE LA ZONE D’ETUDE ... 5
VARIATION CLIMATIQUE DANS L’ARCHIPEL ARCTIQUE CANADIEN DEPUIS LE PETIT AGE GLACIAIRE (PAG) ... 7
PROCESSUS ET TRANSPORTS SEDIMENTAIRES ... 9
DEFIS ET ENJEUX POUR DATER AU 210PB DES SEDIMENTS DE L’ARCTIQUE ... 11
OBJECTIFS DE RECHERCHE ... 12
ORGANISATION DU MEMOIRE ET CONTRIBUTION ... 13
AUTRES REALISATIONS ... 13
CHAPITRE 1 MODERN AND LITTLE ICE AGE SEDIMENTARY PROCESSES within the canadian arctic archipelago ... 15
1. Introduction ... 15
2. Regional settings ... 16
xvi
2.2.SURROUNDING GEOLOGY ... 17
2.3.HYDROLOGY ... 17
2.4.SEDIMENT DYNAMICS ... 18
3. Materials and methods ... 19
3.1.CORING AND SAMPLING ... 19
3.2.CONTINUOUS PHYSICAL AND GEOCHEMICAL ANALYSES ... 22
3.3.CARBON AND NITROGEN ANALYSES ... 22
3.4.GRAIN SIZE ANALYSIS ... 23
3.5.DISCRETE MAGNETIC ANALYSES ... 23
3.6.210P B MEASUREMENTS ... 24
3.7.STATISTICAL AND SPATIAL APPROACH ... 25
4. Results ... 26
4.1.CHRONOLOGY ... 26
4.2.SEDIMENTOLOGICAL AND PHYSICAL PROPERTIES ... 28
4.2.1. Grain size distribution ... 28
4.2.2. Spatial delimitations based on elemental geochemistry ... 29
4.2.3. Carbonate and inorganic carbon contents ... 32
4.2.4. Organic carbon sources ... 33
4.2.5. Sediment colours ... 34
4.3.MAGNETIC PROPERTIES ... 35
4.3.1. Frequency dependence ... 35
4.3.2. Magnetic mineralogy ... 36
4.3.3. Magnetic concentration ... 37
4.3.4. Magnetic grain size ... 38
4.4.RELATIONSHIP BETWEEN MAGNETIC PROPERTIES, GRAIN SIZE AND ELEMENTAL GEOCHEMISTRY ... 40
xvii
5.1.SEDIMENTARY PROVINCES AND PROCESSES ... 41
5.1.1. The West Province ... 42
5.1.2: The Intermediate Province ... 45
5.1.3: The Eastern Province ... 46
6. Conclusions ... 47
CONCLUSION GÉNÉRALE ... 50
ANNEXES ... 53
xviii
LISTE DES TABLEAUX
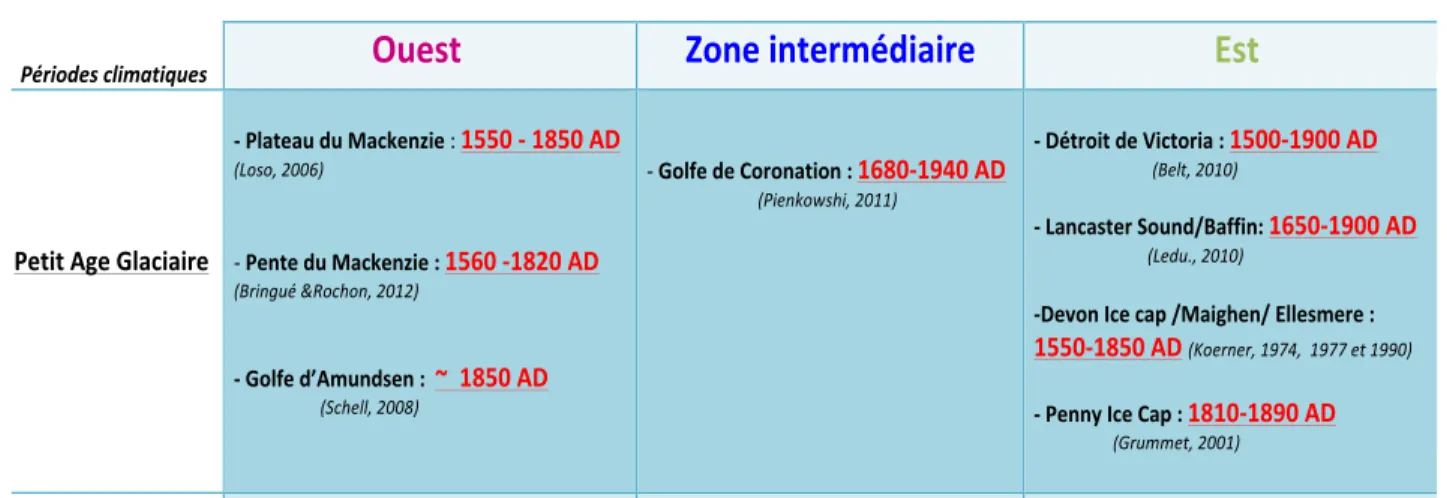
Table 1 Résumé des différentes datations du PAG retrouvées dans la bibliographie ... 8 Table 2 Coordinates of the studied cores. See also Figure 1. ... 21
xix
LISTE DES FIGURES
Figure 1 (A) Map of the Canadian Arctic Archipelago showing studied regions forming part of the study area. The generalized modern circulation: dashed arrows represent surface currents (BG: Beaufort Gyre and CAC: Coastal Alaskan Current) whereas solid black arrows indicate deepest Atlantic Water circulation (BC: Baffin Current and WGC: West Greenland Current). Some important rivers are also identified: A=Mackenzie River; B= Coppermine River; C= Ellice River; D= Back and Hayes Rivers and E= Cunningham River. (B) Map of the geological setting and collected dot cores. The geographic provinces discussed later in the text are also represented: pink = west; blue = intermediate zone (IZ); green = east. Framed red stations correspond to 210Pb dated cores. Simplified geological units map of the CAA inspired from wheeler et al (1996), Harrison et al (2011) and modified from Alkire et al (2017). The color code represents the dominant facies: C*= dominant carbonate/evaporite; C = major carbonate unit; S = sedimentary facies; Ip = plutonic; M = metamorphic; SM = sedimentary and metamorphic, SV = sedimentary and volcanic; G = unknown deposit influenced by the ancient glacier coverage. ... 6 Figure 2 Représentation schématique des différents types de transport par la glace. (A) Vêlage d’iceberg. (B) Frasil. (C) Glace d’ancrage. ... 10 Figure 3 Cycle de formation du 210Pb. Modifiée à partir de Ghaleb et al (2017). ... 12 Figure 4 Photos de la mission à bord du NGCC Amundsen dans l’Archipel arctique canadien. ... 14 Figure 5 210Pb chronology of selected bow cores from the CAA. Total activity of the 210Pb (dpm/g) and vertical dashed lines characterized supported 210Pb was represented in the first row. Ln (excess of 210Pb activity) and basal age (BA) for each core were represented in the
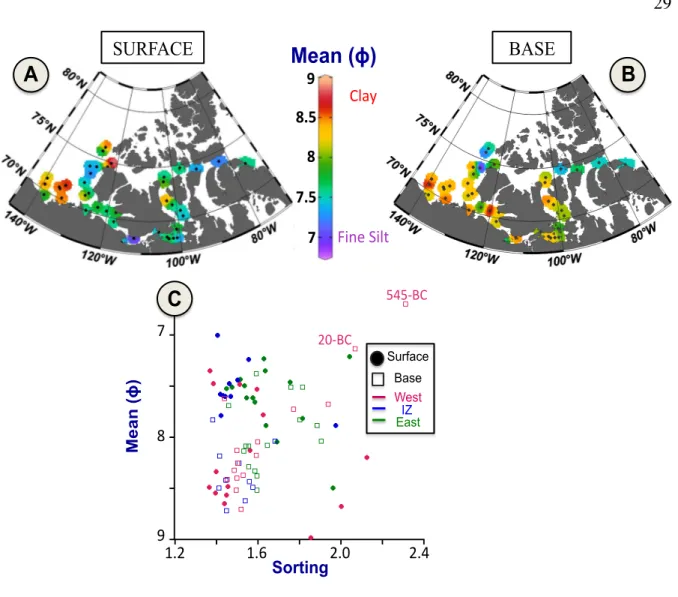
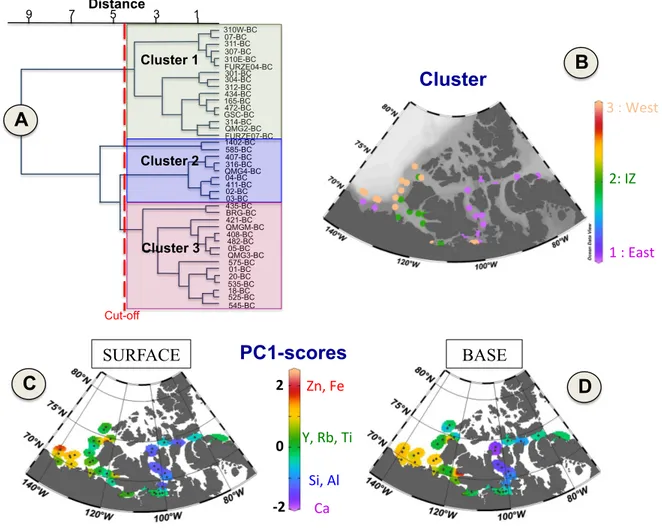
next ones. ... 28 Figure 6 Maps of surface (A) and basal (B) mean grain size distributions. (C) Plot of sorting versus mean grain size in phi scale for surface and base sediment samples. ... 29 Figure 7 Statistical analysis based on major geochemical elements: (A) Clustering dendrogram; (B) map of the three clusters, which point out the three geographical
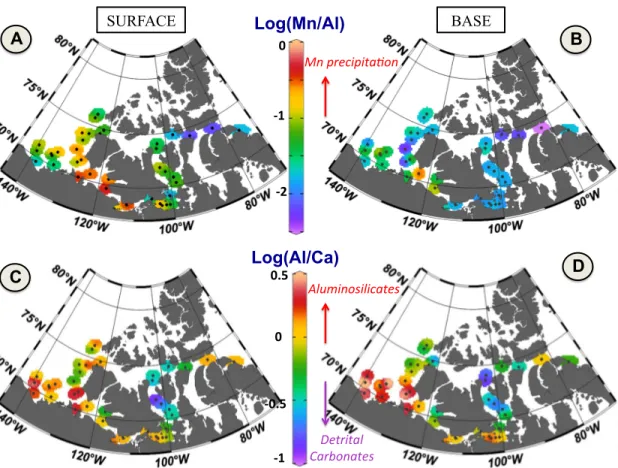
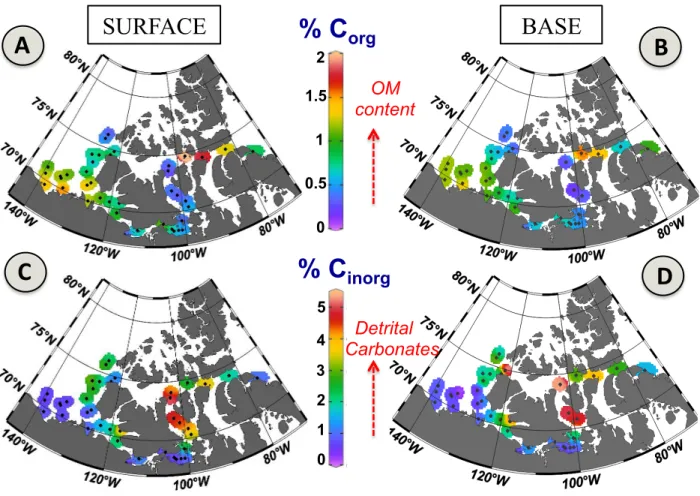
xx provinces. PCA for surface (C) and basal (D) sediments revealing the main geochemical assemblages influence. ... 30 Figure 8 Log(Mn/Al) distribution for surface (A) and base (B) showing Mn precipitation in surface samples located in the south of Banks Island, the entrance of the Amundsen Gulf and part of the Coronation Gulf. Log(Al/Ca) using as sediment sources and transport indicators on the surface (C) and basal (D) samples. ... 31 Figure 9 Maps of surface (A and C) and basal (B and D) organic carbon and inorganic carbon contents. ... 32 Figure 10 Relationship between C/N and δ13C values. Three distinctive clusters of C/N and δ13C values are highlighted and correspond to the three provinces previously identified. Amundsen = Amundsen Gulf; M’Clure= M’Clure Strait; Coronation= Coronation Gulf, Lancaster= Barrow Strait/Lancaster Sound; Mackenzie= Mackenzie Shelf/Slope; QMG= Queen Maud Gulf; Victoria= Victoria Strait and WBI= West Banks Island. ... 34 Figure 11 Spatial distributions of colour indices L* and a* for the surface and basal sediments. ... 35 Figure 12 (A) Magnetic stability (Maher and Thompson, 1999). Hysteresis loops and MDFNRM values for three representative cores: (B) 05BC (Coronation Gulf; West), (C)
407BC (Amundsen Gulf; IZ) and (D) Furze04-BC (Victoria Strait; East). ... 37 Figure 13 Spatial distribution of magnetic susceptibility (kLF) for the surface and the basal
sediments. ... 38 Figure 14 Day plot (Day et al., 1977) for the surface and basal samples. The mixing reference lines for single and multi-domain (SD and MD) are from Dunlop (2002). ... 39 Figure 15 Relationships between mean detrital grain size in phi scale, skewness, magnetic grain size (Mrs/Ms) and elemental geochemistry [log(Al/Ca)]. ... 41
Figure 16 Sedimentary processes over the CAA during the LIA and the recent periods where blue arrows represent the river supplies and purple triangles characterize coastal erosion. ... 44 Figure 17 Résumé des propriétés caractérisant chaque province sédimentaire accompagné des processus sédimentaires mis en place durant le PAG et l’actuel. ... 52
1
LISTE DES ABREVIATIONS, DES SIGLES ET DES ACRONYMES AAC Archipel arctique canadien.
AF Alternating field, champ alternatif.
AW Atlantic Water, eau Atlantique.
BC Baffin Current, courant de Baffin.
BG Beaufort Sea, mer de Beaufort.
CAA Canadian Arctic Archipelago, Archipel arctique canadien.
CAC Coastal Alaskan Current, courant côtier d’Alaska.
CCGS Coastal Canadian Guard Ship, navire de la garde côtière canadienne.
Corg Organic carbon, carbone organique.
Cinorg Inorganic carbon, carbone inorganique.
Ctot Total carbon, carbone total.
Hc Coercive Force, coercivité.
Hcr Remanent Coercive Force, coercivité rémanente.
IRD Ice Rafted Debris, vêlage d’iceberg.
IPCC Intergovernmental Panel on Climate Change, comité intergouvernemental sur le
changement climatique.
2 ISMER Institut des Sciences de la Mer.
IZ Intermediate Zone, zone intermédiaire.
kLF low field magnetic susceptibility, susceptibilité magnétique mesurée à champ
faible.
LIA Little Ice Age, Petit Âge Glaciaire.
MD Multi-domain, domaine multiple.
MDFNRM Median Destructive Field of the Natural Remanent Magnetization, champs
destructif médian de l’aimantation naturelle rémanente.
MSCL Multi-Sensor Core Logger, banc de mesure à senseurs multiples.
Mrs Saturation Remanent Magnetization, aimantation rémanente à saturation.
Ms Saturation Magnetization, aimantation à saturation.
Ntot Total nitrogen, azote total.
NRM Natural Remanent Magnetization, aimantation naturelle rémanente.
NWP Northwest Passage, passage nord-ouest.
OM Organic matter, matière organique.
PAG Petit Âge Glaciaire.
PCA Principal Component Analysis, analyse en composantes principales.
PML Polar Mixed Layer, couche mélangée polaire.
PSD Pseudo-single Domain, pseudo-mono-domaine.
3
SD Single Domain, domaine unique.
SIRM Saturation Isothermal Remanent Magnetization, aimantation rémanente
isothermale de saturation.
UQAR Université du Québec à Rimouski.
WGC West Greenland Current, courant ouest groenlandais.
XCT X-ray Computed Tomographic scanner, radiographie à rayons X.
4 INTRODUCTION GÉNÉRALE
Ce projet de maîtrise se concentre sur l’étude des propriétés physiques, sédimentologiques et magnétiques des sédiments de l’Arctique canadien afin de reconstituer les différents processus sédimentaires récents mais aussi ceux durant le Petit âge glaciaire L’introduction générale de ce mémoire présente la problématique globale qui constitue l’axe central du projet de recherche dans un contexte sédimentologique et paléoenvironnemental.
PROBLEMATIQUE: LE RECHAUFFEMENT CLIMATIQUE DANS L’OCEAN ARCTIQUE
C’est avec plus d’un siècle d’avance que l’explorateur norvégien Fridjof Nansen à son retour de la mission Fram (1893-1896), aborde pour la première fois l’influence des paramètres océanographiques de l’océan Arctique sur le climat global (Nansen, 1902). Il ne le savait pas encore, mais c’est à ce moment-là que Nansen touche du doigt l’une des principales raisons expliquant l’augmentation des expéditions scientifiques réalisées notamment dans l’Arctique canadien durant les dix dernières années (expéditions quasi annuelles de l’Amundsen depuis 2003). En effet, étant donné le contexte de réchauffement climatique actuel, il devient grandement important d’étudier ces différents paramètres impliqués afin de mieux comprendre les impacts passés mais aussi futurs sur le climat global.
En dépit de sa petite taille, l’océan Arctique est considéré comme un véritable thermostat climatique grâce à sa couverture de glace pérenne qui lui attribue un fort pouvoir d’albédo (Serreze et al., 2007). Mais, selon les modèles numériques du GIEC (Groupe d’experts
intergouvernemental sur l’évolution du climat ; Pachauri et al., 2014) les régions polaires seraient
celles qui se réchauffent le plus rapidement. Ce réchauffement se traduit notamment par une diminution du couvert de glace estival d’environ 13 % par décennie entre 1979 et 2014 (Serreze et Stroeve, 2015). Ceci va avoir des répercussions importantes sur la régulation du climat
5
mondial puisque la diminution de présence de glace va, de ce fait diminuer l’albédo et provoquer une boucle de rétroaction positive en permettant à l’océan d’emmagasiner davantage de chaleur (Manabe and Stouffer, 1980 ; Holland and Bitz, 2003 ; Comiso et al., 2008). En effet, les grandes variations du climat influencent de façon directe les processus sédimentaires via un changement des sources et des modes de transport des sédiments. Il devient alors important de documenter la dynamique sédimentaire des régions polaires réagissant aux variations climatiques actuelles et passées afin de mieux comprendre les possibles changements environnementaux dans le futur.
PRESENTATION DE LA ZONE D’ETUDE
L’archipel arctique canadien (AAC) est composé d’environ 36500 îles situées dans l’arctique Canadien et est considéré comme la seconde plus grande masse continentale arctique après le Groenland (Island et al., 2014). Ces nombreuses îles sont séparées par de multiples détroits, cours d’eau et chenaux. L’archipel s’étend d’est en ouest sur environ 2400 km et du nord au sud sur environ 1900 km (Island et al., 2014) où l’île d’Ellesmere (80° N, 79° O) représente la partie la plus septentrionale. Situé à l’ouest de l’archipel arctique canadien (AAC), le plateau du Mackenzie constitue une région côtière de la mer de Beaufort, appartenant aux côtes canadiennes de l’Océan Arctique (Mudie et Rochon, 2001 ; Wang et al., 2005). Il est large d’environ 100 km, bordé à l’Ouest par la pente du Mackenzie et à l’Est le golfe d’Amundsen (Fig. 1A). Le golfe d’Amundsen est, quant à lui, un large chenal de 400 km de long, 200 km de large, avec une profondeur d’eau d’environ 300 m (Stokes et al., 2005). Il a un rôle important puisqu’il permet la connexion entre sud-est de la mer de Beaufort et l’AAC. Finalement au nord de la mer de Beaufort, on retrouve le détroit de M’Clure qui représente le bras le plus à l’Est de la mer de Beaufort. Il fait environ 270 km de long et 90 km de large et constitue une voix d’entrée principale des eaux provenant du bassin canadien dans l’AAC. Le golfe de Coronation est, quant à lui, une zone de transition entre la partie Est et Ouest de l’AAC (Fig. 1A). Ce golfe fait 230 km
6 de long, 100 km de large et environ 150 m de profondeur (Pieńkowski et al., 2011). Les eaux arctiques de surface pénètrent dans cette zone via les détroits de Dolphin et d’Union (Ingram et Prinsenberg, 1998) où un seuil étroit va limiter l’advection des profondes de l’Atlantique (Beaudoin et al., 2004). Plus à l’est, on retrouve le passage nord-ouest qui traverse d’ouest en est les détroits de Victoria, Barrow et Lancaster (Fig. 1A). Ce chenal est l’un des principaux conduits d’exportation d’eau et de glace de mer venant de l’ouest de l’Arctique vers l’Atlantique Nord (Jones et al., 2003) avec des profondeurs bathymétriques augmentant graduellement d’ouest en est (Prinsenberg and Bennett, 1987).
Figure 1 (A) Map of the Canadian Arctic Archipelago showing studied regions forming part of the study area. The generalized modern circulation: dashed arrows represent surface currents (BG: Beaufort Gyre and CAC: Coastal Alaskan Current) whereas solid black arrows indicate deepest Atlantic Water circulation (BC: Baffin Current and WGC: West Greenland Current). Some important rivers are also identified: A=Mackenzie River; B= Coppermine River; C= Ellice River; D= Back and Hayes Rivers and E= Cunningham River. (B) Map of the geological setting and collected dot cores. The geographic provinces discussed later in the text are also represented: pink = west; blue = intermediate zone (IZ); green = east. Framed red stations correspond to 210Pb dated cores. Simplified geological units map of the CAA inspired from wheeler et al (1996), Harrison et al (2011) and modified from Alkire et al (2017). The color code represents the dominant facies: C*= dominant carbonate/evaporite; C = major carbonate unit; S = sedimentary
Beaufort
Sea Baffin Bay
Banks Island Victoria Island Prince of Wales Island Bylot Island Baffin Island A" B" C" D" E" 9" 8" 7" 6" 5" 4" 3" 2" 1" 1" 2" 3" 4" 5" 6" 9" Mackenzie)Shelf)/ Slope1 Amundsen)Gulf1 West)Banks)Island1 M’Clure)Strait1 Coronation)Gulf1 Queen)Maud)Gulf1 Victoria)Strait1 Barrow)Strait1 Lancaster)Sound1 8" 7" A" WGC" BC" BG" CAC" 575,BC" 20,BC" 01,BC" 585BC" 545,BC" 18,BC" 535,BC" 411,BC" 525,BC" 421,BC" BRG" BC" GSC,BC" 434BC" 472,BC" 482,BC" 435,BC" 408,BC" 1402,BC" 03,BC" 04,BC" 02,BC" 407,BC" 05BC" 316,BC" 314,BC" QMG4" BC" QMGM" BC" QMG2,BC"QMG3,BC" 312,BC" 311,BC" 310W,BC" 310E,BC" 07,BC" Furze04,BC" 307,BC" Furze07,BC" 304,BC" 301,BC" 165,BC" Legend" C*" C" S" Ip" M" SM" SV" G" Beaufort Sea B"
7
facies; Ip = plutonic; M = metamorphic; SM = sedimentary and metamorphic, SV = sedimentary and volcanic; G = unknown deposit influenced by the ancient glacier coverage.
VARIATION CLIMATIQUE DANS L’ARCHIPEL ARCTIQUE CANADIEN DEPUIS LE PETIT AGE GLACIAIRE (PAG)
Dans l’Archipel arctique canadien, le PAG a été daté entre 1550 et 1850 AD (Richerol et al., 2008) et a été généralement décrit comme une période plus froide et plus sèche (Anderson et al., 2007). En effet, ce serait à ce moment que les calottes glaciaires sur les îles de Devon et d’Ellesmere auraient atteint leurs maximas en termes d’épaisseur sur toute la période de l’Holocène (ex., Koerner et Paterson, 1974; Bradley, 1990; Koerner et Fisher, 1990). Ce refroidissement a également été observé sur le plateau du Mackenzie (Richerol et al., 2008 ; Bringué et Rochon, 2012), le golfe de Coronation (Pieńkowski et al., 2011 ; 2017), sur l’Île Victoria (Peros et Gajewski, 2008; 2009), la péninsule de Boothia (LeBlanc et al., 2004; Zabenskie et Gajewski, 2007), l’Île du Prince du pays de Galles (Gajewski et Frappier, 2001), l’Île Somerset (Gajewski et al 1995), l’île Prescott (Finkelstein et Gajewski, 2007), l’Île de Baffin (Wolfe, 1996) et l’Île d’Ellesmere (Hyvärinen, 1982). D’un autre côté, cette période a aussi été marquée comme plus chaude dans les détroits de Barrow et de Lancaster (Ledu et al., 2008 ; 2010) avec des températures plus chaudes qu’actuellement. Ceci a été expliqué dans un premier temps par une transition de la phase positive à négative de l’Oscillation arctique, qui a alors induit une diminution de l’advection des eaux atlantiques et donc une intensification des apports d’eaux douces plus chaudes au sein de l’Archipel arctique canadien, mais également par le délai de réponse à un changement climatique entre l’Ouest et l’Est de l’Archipel arctique canadien, comme il a déjà été observé lors de l’Optimum climatique de l’Holocène (Kaufman et al., 2004).
8
Table 1 Résumé des différentes datations du PAG retrouvées dans la bibliographie
Globalement, la période actuelle et plus particulièrement la dernière décennie est considérée comme étant la période la plus chaude du dernier millénaire, particulièrement dans l’Arctique Canadien (LeBlanc et al., 2004; Smol et al., 2005; Frankeltsein et Gajewski, 2007; Peros et Gajewski, 2008). Elle a été caractérisée comme étant plus humide (Peros et Gajewski, 2009) avec une diminution de la durée et de l’extension de couverture de glace (Lotter et Bigler, 2000). En effet, durant les derniers 100 -150 ans, un réchauffement d’environ 1°C de moyenne a été notamment observé sur le plateau du Mackenzie (Richerol et al., 2008; Bringué et Rochon, 2012; Durantou et al., 2012), l’Île Victoria (Podstrike et Gajewski, 2007, Porinchu et MacDonald, 2008; Peros et Gajewski, 2008; 2009) et la péninsule de Boothia (LeBlanc et al., 2004; Zabenskie et Gajewski, 2007; Peros et Gajewski, 2009). Ces variations climatiques vont donc représenter un enjeu primordial en modifiant notamment les agents de transport et les types de processus sédimentaires au sein de la zone d’étude. Il sera donc intéressant de les comparer à la fois de façon spatiale mais aussi de façon temporelle.
! !
Périodes!climatiques!
!!!!!!!Ouest!
Zone!intermédiaire!
Est!
! ! ! ! ! Petit!Age!Glaciaire! ! 7!Plateau!du!Mackenzie!:"1550!7!1850!AD""""""""""""""""""" (Loso,&2006)" " " #"Pente!du!Mackenzie!:"1560!71820!AD!!!!!!!!!!!! (Bringué&&Rochon,&2012)" & ! 7!Golfe!d’Amundsen!:!!~!!1850!AD!!!! &&&&&&&&&&&&&&&&&&&&&(Schell,&2008)! " " #"Golfe!de!Coronation!:!168071940!AD! &&&&&&&&&&&&&&&&&&&&&&&&&&&(Pienkowshi,&2011)& ! 7!Détroit!de!Victoria!:!150071900!AD!!! !!!!!!!!!!!!!!!!!!!!!!!!(Belt,&2010)! & 7!Lancaster!Sound/Baffin:!165071900!AD!!! !!!!!!!!!!!!!!!!!!!!!!!(Ledu.,&2010)! ! 7Devon!Ice!cap!/Maighen/!Ellesmere!:!!!!! 155071850!AD!(Koerner,&1974,&&1977&et&1990)& ! 7!Penny!Ice!Cap!:!181071890!AD!!! !!!!!!!!!!!!!!!!(Grummet,&2001)! ! ! Optimum! Climatique! Médiéval! ! ! 7!Mackenzie!:!1420!7!1550!AD! réchauffement"?!(Richerol,&2008b)! ! ! 7Golfe!de!Coronation!:!147071680!AD!!!!!!""" transition&PAGJOCM"""(Pienkowski,&2011)! !!!! !7Nord!île!Victoria!:!500!71200!AD!! !!!!!!!!!!!!(Fortin&&&Gajewski,&2010)! ! 7!Détroit!de!Victoria!:!1400!7!1600!AD!!! !!!!!!!!!!!!!!!!!!!!!!!!(Belt,&2010)! ! 7!Sud!Péninsule!de!Boothia!:! 800!7!1350!AD!!!!(LeBlanc,&2004)! 1050!7!1200!AD!(Zaberskie&Gajewski,&2007)" !
9
PROCESSUS ET TRANSPORTS SEDIMENTAIRES
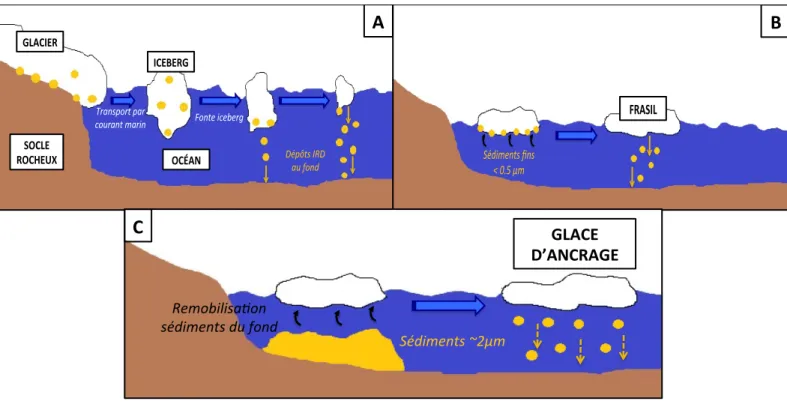
Les sédiments retrouvés dans l’Archipel arctique canadien sont pour la grande majorité détritiques. Ils sont dérivés des marges continentales alentours ayant des âges et des compositions géologiques très différentes (Fig. 2). Ces apports sédimentaires peuvent être acheminés par différents agents de transport tels que la glace de mer, les rivières, les eaux de fonte ainsi que par des panaches turbides de sédiments (Andrews et Eberl, 2012). Le plateau du Mackenzie est, pour sa part, alimenté par des apports fluviatiles détritiques dérivant de la décharge du fleuve Mackenzie. Ce dernier est la principale source de sédiment dans la mer de Beaufort canadienne (Gamboa et al., 2017) et représente le quatrième plus important fleuve de l’Arctique en termes de débit d’eau douce (~420 km3/an ; Wagner et al., 2011), mais le premier en terme d’apports sédimentaires (~127 mT/an ; Carson et al., 1998). Les sédiments en suspension déchargés par le Mackenzie forment une plume sédimentaire qui est ensuite soumise à la variation saisonnière du couvert de glace (Barber and Hanesiak, 2004; Galley et al., 2008 ; Schell et al., 2008 ; Bringué et Rochon, 2012), aux vents et aux courants (Carmack et Macdonald, 2002).
Environ 90% des côtes bordant l’océan Arctique sont affectées par la présence de glace saisonnière ou multi-annuelle (Forbes et Taylor, 1994). La glace est un agent important dans la dynamique sédimentaire de l’océan Arctique, notamment par la formation de vêlages d’icebergs (appelés également Ice Rafted Debris ; Fig. 2A) qui vont emprisonnés les décharges de sédiments grossiers provenant des continents, ou encore pour les transports de sédiments (Reimnitz et al., 1992). En effet deux formes de transport par la glace ont été identifiés : celui par le frasil (nommé
suspension freezing ; Reimnitz et al., 1992 ; Darby et al., 2011 ; Fig. 2B) ainsi que celui par les
glaces d’ancrages (anchor ice ; Reimnitz et al., 1992 ; Darby et al., 2003 ; 2011 ; Fig. 2C). Le premier consiste à une incorporation des sédiments fins en suspension par le frasil (glace adhérente) et requiert des zones de formation rapide de glace et peu profondes. Le second requiert quant à lui, des conditions de glace permanente et consiste à remobiliser les sédiments du fond marin. Il a également été montré que l’érosion par la glace est un facteur d’apport de
10 sédiment très localisé mais non négligeable dans certaines régions : cap de North Head (Rachold et al., 2000), le long de la côte alaskienne de la mer de Beaufort (Forbes et Taylor, 1994), au sud ouest de l’Île de Banks (O’Brien et al., 2006 ; Belliveau, 2007 ; Gamboa et al 2017), sur l’Île Lowther (détroit de Barrow ; St-Hilaire-Gravel et al., 2010 ; 2012), le Cap Charles Yorke (Île de Baffin ; St-Hilaire-Gravel, 2011). Ce phénomène est notamment dû à la présence de glace saisonnière sur des structures non consolidées et des falaises (Rachold et al., 2000) ainsi que la montée du niveau marin (Shaw et al., 1998).
Figure 2 Représentation schématique des différents types de transport par la glace. (A) Vêlage d’iceberg. (B) Frasil. (C) Glace d’ancrage.
OCÉAN& GLACIER& SOCLE& ROCHEUX& ICEBERG& Transport)par) courant)marin) Fonte)iceberg) Dépôts)IRD) au)fond) FRASIL' Sédiments*fins* <*0.5*μm*
A"
B"
GLACE&& D’ANCRAGE& Remobilisa*on, sédiments,du,fond, Sédiments,~2μm,C"
11
DEFIS ET ENJEUX POUR DATER AU 210PB DES SEDIMENTS DE L’ARCTIQUE
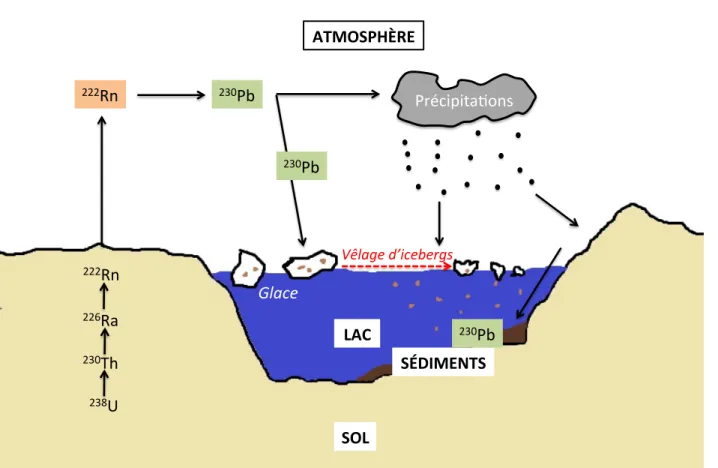
Dans l’océan, le radio-isotope 210Pb provient de la désintégration du 226Ra dissous dans
l’eau et de celle du radio-isotope gazeux 222Rn dans l’atmosphère (Fig. 3). Le 222Rn sera transformé en 210Pb dans l’atmosphère pour ensuite retomber via différentes formes de précipitations. Les taux de transfert de 210Pb venant de l’atmosphère sont généralement connus comme étant dépendants de la latitude (Turekian et al., 1977). En effet, la faible concentration de
222Rn dans les hautes latitudes suggère une production réduite de 210Pb (Hermanson, 1990), ce qui
est moins représentatif de l’environnement de dépôt.
De plus, les faibles vitesses de sédimentation (Darby et al., 1997 ; Polyak et al., 2004, Belt et al., 2010 ; Bringué et Rochon, 2012) additionnées aux conditions environnementales caractéristiques de l’Arctique vont rapidement soumettre les sédiments à des processus de redistribution. Comme vu précédemment, le couvert de glace représente le principal facteur causant cette redistribution par des processus de vêlage d’icebergs (Reimnitz et al., 1992 ; Fig. 4). La présence de glace va alors affecter les transferts directs des nucléides de plomb en suspension dans l’atmosphère vers les sédiments. Par exemple, si les particules sur lesquelles le 210 Pb s’est adsorbé, se déposent sur la glace puis sont remobilisées par le vent ou le mouvement des glaces, les datations obtenues sont à prendre avec précautions (Nichols, 1967 ; Hermanson, 1990). Néanmoins, les processus de remobilisation par des évènements physiques, biologiques, épisodiques extrêmes, périodiques ou mêmes par érosion des sédiments fins du plateau peuvent être identifiés selon le type de profil d’excès de 210Pb en fonction de la profondeur (Xu et al., 2015).
12
Figure 3 Cycle de formation du 210Pb. Modifiée à partir de Ghaleb et al (2017).
OBJECTIFS DE RECHERCHE
L’objectif principal de ce projet de maîtrise est de comparer les différentes propriétés des sédiments déposés durant le Petit âge glaciaire et l’actuel afin de déterminer les processus sédimentaires durant ces deux périodes de changement climatique. Des objectifs spécifiques ci-dessous ont été déterminés :
(1) Déterminer les propriétés physiques, sédimentologiques et magnétiques des sédiments de l’Archipel arctique canadien durant le Petit Age Glaciaire et l’actuel ;
LAC$ SÉDIMENTS$ ATMOSPHÈRE$ SOL$ Précipita)ons-238U -230Th -226Ra -222Rn -222Rn- 230Pb -Glace& 230Pb -230Pb -Vêlage&d’icebergs&
13
(2) Déterminer et comparer les processus sédimentaires associés au Petit âge glaciaire et l’actuel.
ORGANISATION DU MEMOIRE ET CONTRIBUTION
Ce mémoire est présenté sous la forme d’un article scientifique rédigé en anglais, qui sera soumis prochainement à la revue internationale Geochemistry, Geophysics, Geosystems sous cette référence :
Letaïef, S., St-Onge, G., Montero-Serrano, J-C, sera soumis prochainement. Modern and Little Ice Age sedimentary processes within the Canadian Arctic Archipelago. Geochemistry, Geophysics, Geosystems.
Je suis l’auteure principale de cet article qui a été rédigé sous la supervision des professeurs Guillaume St-Onge et Jean-Carlos Montero-Serrano de l’UQAR-ISMER. Je suis également responsable de la majeure partie des travaux de laboratoire à l’exception des analyses de carbone-azote élémentaires et des analyses de 210Pb.
AUTRES REALISATIONS
Au cours de ma maîtrise j’ai eu la chance de présenter les principaux résultats de mon projet de recherche au cours de quatre congrès internationaux: le congrès annuel d’ArcTrain à Brèmes (Allemagne) en septembre 2017 ; Arctic Change à Québec en décembre 2017 ; l’European Geoscience Union General Assembly à Vienne (Autriche) en avril 2018 et l’International Sedimentological Conference à Québec en août 2018 ; ainsi qu’à deux congrès nationaux du GEOTOP (mars 2017 et 2018). J’ai également eu l’opportunité de monter à deux
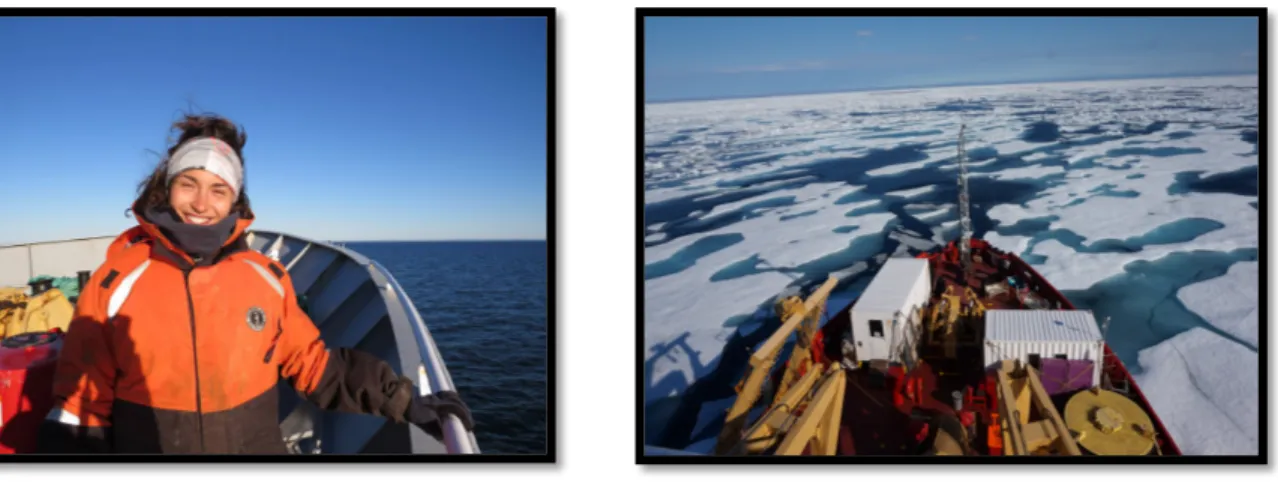
14 reprises, à bord du NGCC Amundsen (dans l’Archipel arctique canadien en août 2017 et le golfe du Saint-Laurent en février 2018) ainsi qu’à bord du Coriolis II (dans l’estuaire et le golfe du Saint-Laurent en octobre 2016 et 2017) afin d’offrir mon aide pour les opérations de carottage, de prélèvements d’eau et de glace.
15
CHAPITRE 1
MODERN AND LITTLE ICE AGE SEDIMENTARY PROCESSES WITHIN THE CANADIAN ARCTIC ARCHIPELAGO
Sarah Letaïef, Guillaume St-Onge, Jean-Carlos Montero-Serrano
Institut des sciences de la mer de Rimouski (ISMER), Canada Research Chair in Marine Geology and GEOTOP, Université du Québec à Rimouski, Rimouski, Québec, Canada
1. Introduction
Polar regions act as the world’s thermostat with their perennial ice cover and derived strong albedo. During the past decades, the Arctic region seems to be the most affected by climate warming: a decrease of 12.4% per decade of summer sea ice extent (Stroeve et al., 2011; Comiso et al., 2017) accompanied by a loss of more than 5 years old ice. Recently, less than 5% of the Arctic Ocean ice is older than 5 years old, compared to 20% in the 1980s (Serreze and Stroeve, 2015) were observed, responding to the increase of greenhouse gases emissions (Pachauri et al., 2014). The rapid loss of sea ice cover and thereby the albedo has played a role in amplifying Arctic warming (Holland and Bitz, 2003; Serreze and Francis, 2006; Serreze et al., 2008; Cohen et al., 2014). The magnitude of these changes around the Arctic show regional patterns and generally results in an increase in temperatures and precipitations due to an enhanced evaporation (Bintanja and Selten, 2014; Kopec et al., 2016), a northward transport of moisture (Zhang et al., 2013) and an intensification the hydrological cycle (Huntington, 2006; Peterson et al., 2006) depending on the regions.
Since the last decade, paleoclimatic studies have become more frequent for the Arctic region (Fennoscandinavia, Arctic Canada, Alaska, Greenland, etc.) using numerous proxies from
16
natural archives such as lakes (Gajewski, 2002; 2006; 2015), peat (Ruppel et al., 2013; Zhang et al., 2017), marine sediments (e.g., Stokes et al., 2005; Ledu et al 2010; Durantou et al., 2012, Bringué and Rochon, 2012; Pieńkowski et al., 2011; 2013; Deschamps et al., 2018 among others), ice cores (Paterson and Waddington, 1984; Mosley-Thompson et al., 2001) and tree rings (Helama and Lindholm, 2003; Linderholm and Chen, 2005; Pisaric et al., 2009). A recent review summarizes Arctic hydroclimate changes during the last two millennia (Linderholm et al., 2018) where hydroclimate simulations or proxies generally reveal that the Little Ice Age (LIA, 1550-1850 AD) tends to be drier (Ljungqvist et al., 2016) even if large regional differences are observed. During the last 2000 years, an increase in precipitation (Viau and Gajewski, 2009), river runoff (Wagner et al., 2011) and general colder reconstructed summer sea surface temperatures (e.g., Schell et al., 2008; 2009; Bringué and Rochon, 2012) has been shown in the western Canadian Arctic Archipelago (CAA), whereas a decrease in precipitation (Viau and Gajewski, 2009), an increase in sea ice cover and colder conditions were described in the eastern part (e.g., Ledu et al., 2008; 2010; Vare et al., 2009; Belt et al., 2010).
The comparisons between the different Arctic areas allow to reconstruct the climatic mosaic and the Arctic response to the ongoing global warming, but the lack of spatiotemporal analysis makes comparisons difficult. In this study, we use different proxies and a large spatial coverage of box cores from the CAA in order to compare the sediment properties from the surface (modern) and the base (LIA) of the cores to finally define sedimentary provinces and processes established during these two periods.
2. Regional settings
2.1.REGIONAL CHARACTERISTICS
The CAA is a complex array of islands covering an area of 2.9 million km2 that represents about 20% of the total shelf area in the Arctic (Jakobsson, 2002). Narrow channels
17
formed by glacial erosion during the Quaternary (England et al., 2006) play an interconnecting role with larger basins. Furthermore, the Northwest Passage (NWP) connects the eastern (Baffin Bay) and western (Beaufort Sea) Canadian Arctic through the CAA. The latter is considered to be a key area for mass and heat exchanges between the Arctic and Atlantic Oceans (Melling et al., 2001, 2002; Michel et al., 2006; Dickson et al., 2007). Consequently, the export of water through the Nares and Fram Straits and the NWP will influence the formation of Atlantic deep-waters (Aagaard and Carmack, 1989, 1994) and thereby impact the global thermohaline circulation (Proshutinsky et al., 2002).
2.2.SURROUNDING GEOLOGY
The Mackenzie River drains a basin of 1.78 x 10⁶ km2 (Aziz and Burn, 2006; Hill et al., 2001). The basin is characterized, in the western part by the North American Cordillera geological unit (Mackenzie and the Rocky Mountain Belts; Millot et al., 2003) composed of sedimentary and volcanic rocks (Fig. 1B) and in the eastern part by the Canadian Shield from the Slave Province, which comprises Archean granites and gneisses (Millot et al., 2003). In turn, Banks Island is mostly composed of Cretaceous to upper Paleozoic sedimentary rocks (Fig. 1B) and Quaternary dolomite-rich tills (Bischof et al., 1996; Bischof and Darby, 2000). Otherwise, most of the islands such as, the Victoria and Prince of Wales Islands are typically underlined by Ordovician and Silurian detrital carbonates (Fig. 1B; Stokes et al., 2009). Finally, eastern Lancaster Sound is defined by Cretaceous to Plio-Pleistocene geological units associated with rifting (MacLean et al., 1990; Li et al., 2011) and Bylot Island is characterized by plutonic igneous rocks belonging to the Canadian Shield.
2.3.HYDROLOGY
Nowadays, the CAA is covered by seasonal sea ice from September to April-June (spatially variable; Vare et al., 2009; Belt et al., 2010). Likewise, because of the large
18
freshwater inputs (including river discharges and summer sea ice melting), the Arctic water column is strongly stratified. Typically, a cold and low salinity surface layer named the Polar Mixed Layer (PML) is found in the upper 50 to 100 m depth and is mainly formed by summer meltwaters and river discharge. The PML (Fig. 1A) is underlain by warmer and low salinity Pacific waters (PW), from 100 to 300 m depth, with a contribution of the Mackenzie River and the Yukon River waters via the coastal Alaskan current (Jones et al., 2003). Finally, a strong halocline separates the PW from the Atlantic waters (AW) until 500 to 800 m depth and enters into the system through the west Spitsbergen and west Greenland currents (Woodgate et al., 2007). Due to the presence of shallow channels generally lower than 500 m depth, the water column is predominantly composed of Pacific waters (Jones et al., 2003) coming from the Canadian Basin via the M’Clure Strait and the Amundsen Gulf. The general water mass circulation (Fig. 1A) in the CAA is strongly influenced, in the western part, by the anticyclonic Beaufort Gyre (BG) and in the central CAA by a net southeastward circulation (Ingram and Prinsenberg, 1998).
2.4.SEDIMENT DYNAMICS
The mean annual discharge of the CAA rivers was recently estimated to ~ 202 km3/yr (Lammers et al., 2001; Alkire et al., 2017). Although the Mackenzie River discharge in the system is significant (~420 km3/yr; Wagner et al., 2011), many CAA small rivers exist, including the Coppermine River (~88 km3/yr), the Ellice and Back Rivers (respectively ~2.82 km3/yr and ~15.52 km3/yr; Déry, 2016) and finally the Cunningham River (~3.28 km3/yr). Their individual cumulative discharge is large enough to significantly impact the freshwater flowing through the CAA and the local sedimentation.
The most important sediment entrainment in the Beaufort Sea, the Northwest Passage and globally in the Arctic Ocean is known as suspension freezing by frazil (Fig. 2B) and anchor ice (Reimnitz et al., 1993; Darby et al., 2011; Fig. 2C). Frazil consists of sediment removal by sea ice transport and requires a rapid ice formation in open and shallow water area (Reimnitz
19
and Barnes, 1987; Reimnitz et al., 1993). Indeed, fine-grained sediments discharged from coastal erosion or river drainages within the first 25-30 m water depth are disseminated into the first year ice during freezing storms. Then, they are transported by ice until the ice motion is stopped for the duration of winter and finally deposited elsewhere during rapid summer melting (Reimnitz et al., 1993). By using Fe-oxide fingerprinting grains, Darby et al (2003) showed that western Canadian arctic sea ice floes drift west from the Laptev Sea to Beaufort Gyre via the transpolar drift oceanic current. Furthermore, aeolian transport in the CAA was identified as insignificant and very localized (Darby et al., 1974; Reimnitz and Maurer, 1979). Furthermore, seasonal sea ice cover combined with sea ice rising, ice-rich permafrost coasts, unlithified and low cliffs promote conditions for coastal erosion (Overduin et al., 2014). For instance, the prograded beach morphology on Cape Charles Yorke (Baffin Bay) is an excellent case which show a recent sedimentary process shift from deposition to erosion, resulted from lower sediment supply, increased wave energy and sea level rising (St-Hilaire-Gravel, 2011).
3. Materials and methods
3.1.CORING AND SAMPLING
A total of 42 box cores were collected at different depths in eight different regions (Fig. 1B): the Mackenzie Shelf/Slope, the Amundsen Gulf, the M’Clure Strait, the Coronation and the Queen Maud Gulfs, the Victoria Strait and the Barrow Strait on board of the Canadian Coast Guard Ship (CCGS) Amundsen as part of the ArcticNet program in 2016 (Table 2). All coring site were targeted using high-resolution seismic profiles that indicated high sediment accumulation which are not influenced by mass wasting events (Montero-Serrano et al., 2016). In each box core, two push cores were subsampled. Using the results from digital X-ray and continuous Multi-Sensor Core Logger (MSCL) measurements processed in the lab, one replicate push core was selected for subsequent analyses based on the absence of coring disturbance/artefacts and the absence of compaction visually confirmed on deck during the sampling. In order to study the sediment-water interface, surface sediment samples were
20
collected on board in the uppermost 5 mm of each box core using a spatula and stored in plastic bags. Furthermore, ounces split, the cores were also sampled with 1 cm3 cubes at the top (representing the first 1 cm) and the base (depending on the core length; Table 2) for grain-size, magnetic and sedimentological analyses.
Due to the influence of the Mackenzie River and the small Canadian Arctic rivers in the western part of the CAA (Scott et al., 2009; Belt et al., 2010; Bringué and Rochon., 2011; Durantou et al., 2012; Gamboa et al., 2017; Alkire et al., 2017) and the influence of sea ice in the eastern part of the study area (Pieńkowski et al., 2011, 2013; Ledu et al., 2010a, 2010b), the sedimentary processes that operate across the Canadian Arctic are different. As a result by using statistical analyses, sediment samples were divided into three main geographical areas (Fig. 1B): (1) West (M’Clure Strait, Banks Island Shelf and Mackenzie Shelf/Slope), Intermediate Zone (Amundsen and Coronation Gulfs), and (3) East (Central Canadian Arctic Archipelago and Northwest Passage).
21
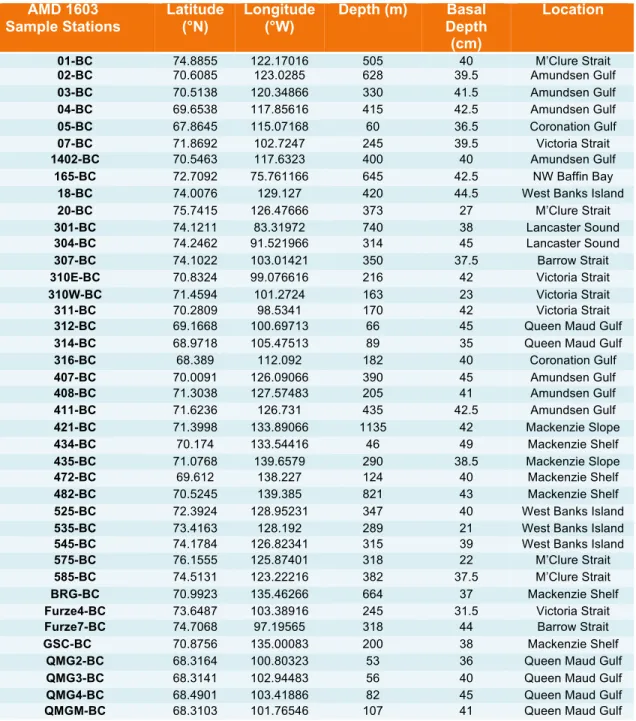
Table 2 Coordinates of the studied cores. See also Figure 1.
AMD 1603
Sample Stations Latitude (°N) Longitude (°W) Depth (m) Depth Basal
(cm) Location 01-BC 74.8855 122.17016 505 40 M’Clure Strait 02-BC 70.6085 123.0285 628 39.5 Amundsen Gulf 03-BC 70.5138 120.34866 330 41.5 Amundsen Gulf 04-BC 69.6538 117.85616 415 42.5 Amundsen Gulf 05-BC 67.8645 115.07168 60 36.5 Coronation Gulf 07-BC 71.8692 102.7247 245 39.5 Victoria Strait 1402-BC 70.5463 117.6323 400 40 Amundsen Gulf 165-BC 72.7092 75.761166 645 42.5 NW Baffin Bay
18-BC 74.0076 129.127 420 44.5 West Banks Island
20-BC 75.7415 126.47666 373 27 M’Clure Strait
301-BC 74.1211 83.31972 740 38 Lancaster Sound
304-BC 74.2462 91.521966 314 45 Lancaster Sound
307-BC 74.1022 103.01421 350 37.5 Barrow Strait
310E-BC 70.8324 99.076616 216 42 Victoria Strait
310W-BC 71.4594 101.2724 163 23 Victoria Strait
311-BC 70.2809 98.5341 170 42 Victoria Strait
312-BC 69.1668 100.69713 66 45 Queen Maud Gulf
314-BC 68.9718 105.47513 89 35 Queen Maud Gulf
316-BC 68.389 112.092 182 40 Coronation Gulf 407-BC 70.0091 126.09066 390 45 Amundsen Gulf 408-BC 71.3038 127.57483 205 41 Amundsen Gulf 411-BC 71.6236 126.731 435 42.5 Amundsen Gulf 421-BC 71.3998 133.89066 1135 42 Mackenzie Slope 434-BC 70.174 133.54416 46 49 Mackenzie Shelf 435-BC 71.0768 139.6579 290 38.5 Mackenzie Slope 472-BC 69.612 138.227 124 40 Mackenzie Shelf 482-BC 70.5245 139.385 821 43 Mackenzie Shelf
525-BC 72.3924 128.95231 347 40 West Banks Island
535-BC 73.4163 128.192 289 21 West Banks Island
545-BC 74.1784 126.82341 315 39 West Banks Island
575-BC 76.1555 125.87401 318 22 M’Clure Strait
585-BC 74.5131 123.22216 382 37.5 M’Clure Strait
BRG-BC 70.9923 135.46266 664 37 Mackenzie Shelf
Furze4-BC 73.6487 103.38916 245 31.5 Victoria Strait
Furze7-BC 74.7068 97.19565 318 44 Barrow Strait
GSC-BC 70.8756 135.00083 200 38 Mackenzie Shelf
QMG2-BC 68.3164 100.80323 53 36 Queen Maud Gulf
QMG3-BC 68.3141 102.94483 56 40 Queen Maud Gulf
QMG4-BC 68.4901 103.41886 82 45 Queen Maud Gulf
22
3.2.CONTINUOUS PHYSICAL AND GEOCHEMICAL ANALYSES
The whole cores were scanned with a Geotek XCT digital X-ray system at ISMER to visualize the sedimentary structures. The samples were then analyzed at 1 cm intervals with a GEOTEK MSCL to measure the physical properties, notably magnetic susceptibility (kLF) and the colorimetric indices L* and a* (St-Onge et al., 2007). All the box cores were successively opened, described, photographed and analyzed again with the MSCL in the split core mode at 0.5 cm intervals. With that setting, the following parameters were determined: diffuse spectral reflectance using a Konica Minolta CM2600d spectrophotometer, magnetic susceptibility using a point source sensor and the chemical composition and concentration using an Olympus Delta Professional X-ray fluorescence (XRF) sensor. The XRF data enable to calculate geochemical ratios in order to derive more information about sedimentological processes, such as Log(Al/Ca) and Log(Mn/Al) ratios which were previously used to reconstruct the changes in sediment provenance and transport (Croudace et al., 2006; Croudace and Rothwell, 2015). Log(Al/Ca) provides a straightforward proxy to reflect sediment sources where the Aluminum can be associated to alluminosilicate inputs (Nizou et al., 2010) and Calcium to detrital carbonates. Given that Mn is highly insoluble oxyhydroxyde when oxic conditions prevail (Burdige, 1993; Calvert and Pedersen, 2007), enrichment in Mn is associated with oxic conditions. Finally, Log(Mn/Al) is used as an indicator of redox conditions (Gamboa et al., 2017).
3.3.CARBON AND NITROGEN ANALYSES
Carbon and nitrogen analyses were performed for surface and basal sediments in order to determine the spatial variations of sediment sources. The first aliquot of 6-10 mg of bulk sediment was dried, crushed and encapsulated for total carbon (%Ctot) and total nitrogen
(%Ntot) contents. A second aliquot of 8-12 mg of sediments was acidified with 0.2 ml of HCl
(1 M) to dissolve carbonates in order to measure organic carbon (%Corg) contents. Both
23
Spectrometry) coupled with a COSTECH 4010 (Costech Analytical) elemental analyzer. δ13Corg content was analyzed in the acidified aliquot portion whereas δ 15Ntot content was
measured using the raw samples with a gas chromatograph coupled to a ThermoScientific Deltaplus XP mass spectrometer where the analytical error (n= 50) on measurement was 0.2 ‰ and 0.4‰ respectively. System suitability prior to analysis was evaluated using standards (caffeine, nannochloropsis and Mueller Hinton Broth). Inorganic carbon content (%Cinorg) was
calculated by subtracting the organic carbon from the total organic content. The Corg/Ntot ratio
is expressed as an atomic C/N ratio and used to distinguish between marine and terrestrial sources for the sedimentary organic matter (OM; Meyers, 1994; 1997).
3.4.GRAIN SIZE ANALYSIS
Approximately 1 g of sediment was moistened with H2O. Afterwards, 10 ml of
hydrochloric acid (1M HCl) and hydrogen peroxide (30% H2O2) were added to remove
biogenic carbonates and organic material in order to isolate the detrital fraction. Samples were then deflocculated by successive washing with distilled water and analyzed with the Beckman Coulter LS13320 laser diffraction grain-size analyzer, which has a detection range of 0.04-2000 µm. The statistical parameters (e.g., sorting, mean grain size) were computed with the GRADISTAT software (Blott and Pye., 2001) by using the method of moments in the logarithmic phi-scale.
3.5.DISCRETE MAGNETIC ANALYSES
The sampled cubes were analyzed with a 2G SRM-755 cryogenic magnetometer. The Natural Remanent Magnetization (NRM) was measured and then demagnetized at peak alternating field (AF) of 0 to 80 mT at 5 mT steps. The Anhysteretic Remanent Magnetization (ARM) was induced by an AF of 100 mT and a direct current (DC) biasing field of 0.05 mT. The Isothermal Remanent Magnetization and the Saturated Isothermal Magnetization (IRM
24
and SIRM) were respectively acquired using a 2G-pulse magnetizer in DC fields of 300 and 950 mT. Both ARM and IRM were then demagnetized at the same AF steps as the NRM. In the case of SIRM, the demagnetization steps were operated at 0, 5, 10, 30, 50 and 80 mT. In addition, the median destructive field (MDF) is the required field to remove half of the initial
remanence and is influenced by magnetic grain size and mineralogy.
Moreover, magnetic susceptibility was also measured on some samples using a Bartington MS2E meter to determine the frequency dependent magnetic susceptibility. The difference between these two measurements is used to indicate the presence of super paramagnetic minerals (e.g., Dearing, 1999). Superparamagnetic crystals are smaller than ~0.03 µm and show rapid changes over time in their magnetic behaviour (Dearing, 1999).
Finally, sediment samples were measured using a Princeton Measurement Corporation Alternating Gradient force Magnetometer (MicroMag 2900 AGM) in order to define hysteresis loops and determine the coercivity force (Hc), the coercivity of remanence (Hcr), the
saturation magnetization (MS) and the saturation remanence (Mrs). The resulting coercivity
(Hcr/Hc), remanence (Mrs/Ms) ratios and the shape of the hysteresis loops are indicative of the
magnetic mineralogy and grain size (Day et al., 1977; Dunlop, 2002).
3.6.210PB MEASUREMENTS
Recent sedimentation rates were derived from seven cores (05-BC, 165-BC, 304-BC, 316-BC, 408-BC, 535-BC and QMG4-BC) based on 210Pb measurements at GEOTOP (Montréal). Approximately 2 g of dried and crushed sediment were sampled at 1 cm intervals until 15 cm and at each 5 cm until reaching the core bottom. The 210Pb measurements were made after chemical treatment purification and deposition on a silver disk following routine procedures and using an EGG ORTEC model 576 alpha spectrometer. Excess 210Pb measurements were processed by counting the activity of the 210Po daughter isotope (Zhang, 2000) and the 209Po was used as a chemical yield.The counting error was evaluated at 1σ ~ 2-4%. To estimate the sedimentation rates, we firstly visually determined the 210Pbsupported and
25
secondly calculated the 210Pbexcess (210Pbexcess= 210Pb- 210Pbsupported). Then, using the CRS
model (constant rate of 210Pb supply; Appleby and Oldfield, 1983; Oldfield and Appleby, 1984), the slope of the linear regression between the ln (210Pbex) versus depth is used to
calculate the average sedimentation rate (SR) = -ln (2)/(slope*22.3) where 22.3 is the half-life of 210 Pb (e.g., Ghaleb, 2009). This SR allows us to estimate the age of oldest sediments (base) of the measured cores.
3.7.STATISTICAL AND SPATIAL APPROACH
The geochemical data are compositional, i.e. vectors of nonnegative values subjected to a constant-sum constraint (of 100%). This implies that relevant information is usually contained in the relative magnitudes and the statistical analysis must focus on the ratios between components (Aitchison, 1986). To detect elemental associations with similar relative variation patterns that may be interpreted from a paleoenvironmental standpoint (e.g., von Eynatten et al., 2003, 2016; Montero-Serrano et al., 2010), a principal component (PCA) and a clustering analysis were performed on the major surface geochemical elements (Ti-Mn-Fe-Al-Si-K-Ca) from the XRF core scanner data set. Prior to multivariate analysis, a log-centered (clr) transform was applied (Aitchison, 1990). This transformation first divides the elemental concentration by the geometric mean of the composition of the individual observations and then, uses the logarithm. Note that all the geochemical element ratios are expressed in a log-ratio in order to minimize the highest values and distribute the lowest one, which is most suitable for right-skewed distributions (van den Boogaart and Tolosana-Delgado, 2013). PCA was conducted using the “CoDaPack” software (Thió-Henestrosa and Comas, 2011) and clustering analysis by using the Ward’s method in “PAST” software. Finally, physical and magnetic properties, grain size and carbon-nitrogen data, as well as the score from the first principal component of the log-centered XRF data were used to produce interpolated maps using Ocean Data View (ODV) software (Schlitzer, 2018). The interpolated maps were generated using a weighted-average gridding algorithm with a quality limit of 1.5. Numerical data were summarized in Annexes 1, 2, 3.
26
4. Results
4.1.CHRONOLOGY
The chronology of seven box cores from the entire area (Fig. 1B) was established using the 210Pb measurements. Clear radioactive decays are observed and allow to visually determining the value of the supported 210Pb and finally the excess 210Pb (Fig. 5). Thus, the slope of the unsupported 210Pb decay has been used to calculate the sedimentation rates (SR; Fig. 5) and finally the basal ages of each dated cores. Generally, the sedimentation rates vary between ~82.3 and 370 cm/ka with basal ages from ~1550 to 1820 AD, suggesting a possibility to reconstruct the conditions since the last ~ 600 years and especially during the LIA.
These new sedimentation rate estimations are similar and complement the different data already obtained in the Mackenzie Shelf/Slope (Richerol et al., 2008; Schell, 2008; Bringué and Rochon, 2012; Durantou et al., 2012), the Amundsen Gulf (Schell et al., 2008), the Coronation Gulf (Pieńkowski et al., 2011; 2017) and the Victoria and Barrow Straits (Vare et al., 2009; Ledu et al., 2010a; 2010b; Belt et al., 2010; Pieńkowski et al., 2013). Finally, the age of the LIA in the CAA was already referenced between ~1550-1850 AD in the Mackenzie Shelf/Slope (Loso et al., 2006; Bringué and Rochon, 2011), ~1680-1940 AD in the Coronation Gulf (Pieńkowski et al., 2011; 2017) and ~1500-1900 AD in the Victoria Strait (Belt et al., 2010).
27
5355BC
"4085BC
"055BC
"3165BC
"QMG45BC
"3045BC
"1655BC
" Dep th &(cm) & 25" 20" 15" 10" 5" 0"53" 52" 51" 0" 1" 2" SR ~ 88 cm/ ky R = 0.98 R = 0.99 SR ~ 113 cm/kyBA:"1821"AD""
53" 52" 51" 0" 1" 2" 3" SR ~ 87 cm/ky R = 0.941547"AD""
52" 53" 51" 0" 1" 2" R = 0.94 R = 0.96 SR ~ 178 cm/ky SR ~ 276 cm/ky1823"AD""
53" 52" 51" 0" 1" 2" 3" R = 0.94 SR ~ 271 cm/ky R = 0.97 SR ~ 111 cm/ky1682"AD""
51.5" 50.5" 0.5" 1.5" R= 0.96 SR~ 164 cm/ky1744"AD""
51" 0" 1" 2" 3" 4" SR~ 184 cm/ky R= 0.981791"AD""
51" 0" 1" 2" R= 0.94 SR~ 370 cm/ky R= 0.96 SR~ 82 cm/ky1556"AD""
Ln&(210&Pbex)&& Ln&(210&Pbex)&& Ln&(210&Pbex)&& Ln&(210&Pbex)&& Ln&(210&Pbex)&& Ln&(210&Pbex)&& Ln&(210&Pbex)&&
0" 4" 8" 12" 0" 4" 8" 0" 4" 8" 4" 8" 12" 16" 0" 0" 2" 4" 6" 8" 2" 6" 10" 0" 2" 4" 6" 8" 0" 5" 10" 15" 20" 25" 210&Pb ex&acEvity&(dpm/g)&& Dep th &(cm) &
28
Figure 5 210Pb chronology of selected bow cores from the CAA. Total activity of the 210Pb (dpm/g) and vertical dashed lines characterized supported 210Pb was represented in the first row. Ln (excess of 210Pb activity) and basal age (BA) for each core were represented in the next ones.
4.2.SEDIMENTOLOGICAL AND PHYSICAL PROPERTIES
4.2.1. Grain size distribution
The mean surface and basal grain size in the study area do not depict great variability and are mainly composed of silts. Indeed, the mean surface sediment grain size (Fig. 6A) expressed in phi scale ranges from 9.0 (clay) to 7.0 (fine silt) where the minimum phi values are found in the Coronation Gulf. The surface samples grain size distribution shows a general West-East trend with finer grains (8-9 Φ) in the Western and coarser grains (< 8 Φ) in the Eastern part. The basal sample grain size shows a coarser grain size near to the Mackenzie mouth (~ 8.5 Φ), whereas the rest of the Western and Eastern parts generally become finer (7.5Φ).
Generally, sorting is better as the mean grain size decreases, especially in the West province surface sediments (Fig. 6B). The most poorly sorted sediments are found in the East and near to M’Clure Strait (545-BC and 20-BC). Moreover, surface sediments and basal East sediments are more widely dispersed suggesting spatial and temporal sedimentary processes variations.