Science Arts & Métiers (SAM)
is an open access repository that collects the work of Arts et Métiers Institute of Technology researchers and makes it freely available over the web where possible.
This is an author-deposited version published in: https://sam.ensam.eu
Handle ID: .http://hdl.handle.net/10985/9057
To cite this version :
Guochao GU, Raphaël PESCI, Eric BECKER, Laurent LANGLOIS, Régis BIGOT - Application of X-ray Microtomography to Quantify the Liquid Fraction of M2 Steel for Semi-solid Forming process - In: 16th annual ESAFORM CONFERENCE ON MATERIAL FORMING, Portugal, 2013-04-22 - ESAFORM 2013 - 2013
Any correspondence concerning this service should be sent to the repository Administrator : archiveouverte@ensam.eu
Application of X-ray Microtomography to Quantify the Liquid Fraction of
M2 Steel for Semi-solid Forming process
Guochao Gu
1, a, Raphaël Pesci
2,b, Eric Becker
1,c, Laurent Langlois
1,dand
Régis Bigot
1,e1Laboratoire Conception Fabrication Commande (LCFC – EA 4495), Arts et Métiers ParisTech, 4 rue
Augustin Fresnel 57078 Metz Cedex 03, France
2Laboratoire d’Etude des Microstructures et de Mécanique des Matériaux (LEM3), UMR CNRS
7239, Arts et Métiers ParisTech CER Metz, 4 rue Augustin Fresnel 57078 Metz Cedex 03, France
aguochao.gu@gmail.com, braphael.pesci@ensam.eu, ceric.becker@ensam.eu, dlaurent.langlois@ensam.eu, aregis.bigot@ensam.eu
Keywords: Semi-solid, steel, thixoforging, X-ray microtomography, SEM-EDS.
Abstract. Thixoforging, one variant of semi-solid metal processing in which the metallic alloys are
processed at low liquid fraction (0.1< Fl < 0.3), is used to produce complex parts with high mechanical properties. Steel thixoforging faces more challenges as compared to that of low melting point materials due to high processing temperature and lack of understanding of the thermomechanical behavior of materials in the given conditions. It is crucial to study the microstructure in the semi-solid state to improve the understanding of the thixoforging process since the material behavior strongly depends on main parameters: the liquid fraction, its distribution as well as the coherence of the solid skeleton. The microstructure has a great influence on the viscosity of the material, on the flows and finally on the final shape and mechanical properties of the thixoforged parts. Here, the characterization of the volume fraction and distribution of liquid in the semi-solid state with high energy 3D X-ray microtomography is investigated on M2 steel grade as a ‘model’ alloy. The obtained results are compared to 2D observations using EDS technique in SEM on heated and quenched specimens. They show a good correlation making both approaches very efficient for the study of the liquid zones in the semi-solid state.
Introduction
The microstructure of steel grades during heating up to the semi-solid state has been of great interest in recent years owing to the development of the thixoforging process which offers an opportunity to form complex parts with fewer forming steps and with near-net shaping abilities. It is essential to understand the microstructure evolution during heating to the semi-solid state such as grain size, shape factor, the volume fraction of liquid phase etc, since these parameters control the final material rheological properties [1] and therefore the material flow during processing [2]. The main parameter is the volume fraction of liquid since it has a strong effect on the final properties of the thixoforged parts [3]. Thus, it is necessary to have an accurate evaluation of the volume fraction of liquid for fundamental research and for the process control. Normally, it is evaluated by using thermal analysis techniques (DSC/DTA) [4, 5] or by 2D image analysis on the microstructures of the material quenched from the semi-solid state [5, 6]. However, the 2D image analysis may lead to high uncertainties and even errors in the evaluation of the liquid fraction and in the characterization of the microstructure of the material (grain size, shape factor, etc) due to 2D sections chosen at random, possible heterogeneity and texture in the material... The real microstructure information (contiguity, grain shapes, entrapped liquid, etc) can be obtained by 3D investigations using serial sectioning techniques [7, 8] as well as the non-destructive X-ray microtomography [9]. However, these experiments were mainly carried out on aluminum alloys.
This work presents the 2D and 3D microstructures of M2 steel grade in both as-received state and the semi-solid state obtained by various techniques. The microstructure evolution during the heating
process is analyzed and discussed. Finally, the former liquid zones are identified and quantified on the constructed 3D models of the semi-solid microstructures.
Experimental Methods
The M2 high-speed tool steel has been studied as a good candidate grade for steel thixoforging because of its large freezing range and low solidus temperature. It has been demonstrated that a thixoforging required microstructure can be obtained directly by heating the material from its as-received state to the semi-solid state [9, 10]. Moreover, a good absorption contrast between solid and liquid phases for X-ray microtomography can be obtained owing to its high content of alloying elements. Table 1 gives the chemical compositions of M2 steel.
Table. 1 Chemical composition of M2 steel
Weight % Fe C Mn Mo Si Cr V W
M2 Balance 0.85 0.25 5.0 0.035 4.1 1.9 6.4
An M2 slug with a diameter of 38mm and 35mm in height was subjected to a direct partial re-melting route to obtain the semi-solid material. During the heating process, part of the slug was inserted into the induction coil with a part sitting on a ceramic holder, resulting in a heterogeneous temperature field throughout the slug owing to the skin effect and the thermal exchange between the slug and the ceramic holder: the material at the top reached the semi-solid state, while the bottom stayed in the solid state. During heating, the temperature at point C was measured by a pyrometer. When it reached 1250°C (heating time: ~120s), the slug was directly quenched in a water tank in order to preserve the former microstructure in the semi-solid state. After that, several samples with a diameter of 1.2mm were electrodischarge-machined from the quenched slug in both axial and radial directions for the X-ray microtomography investigations. Fig. 1 presents a schematic view of the induction heating and the positions of the samples.
Fig. 1. Set-up for remelting experiments and positions of the samples analyzed.
X-ray microtomography experiments were carried out on these samples at room temperature on the ID15A beamline at the ESRF in Grenoble, France. Before testing, a translation-rotation stage was used to achieve a good alignment of the sample with the X-ray beam. During the tests, X-rays went through the rotating (360°) samples with a high constant energy (~60keV). The transmitted beam was
recorded by a fast DALSTAR Pantera 1M60 CCD. The exposure time with this camera was ~25ms. For one scan, 3600 projections with the effective pixel size of 1.2µm were obtained. After the reconstruction of the slices, the 3D representation of the microstructure was processed and analyzed with the image analysis software ImageJ. The reconstructed volume stacks were cropped to a final size of 500*500*1000µm in order to be able to perform 3D calculations. After reducing the image noise by a 3D median filter, different phases with various grey levels could be calculated by adjusting threshold..
The microstructure observations and analyses on the quenched slug were conducted by using a Jeol 7001FLV Scanning Electron Microscope (SEM) equipped with an Energy Dispersive Spectroscopy (EDS) system from Oxford Instruments. 2% Nital (2 ml HNO3 + 98ml ethanol) was
used to etch the quenched slug and reveal the microstructure.
Results and discussion
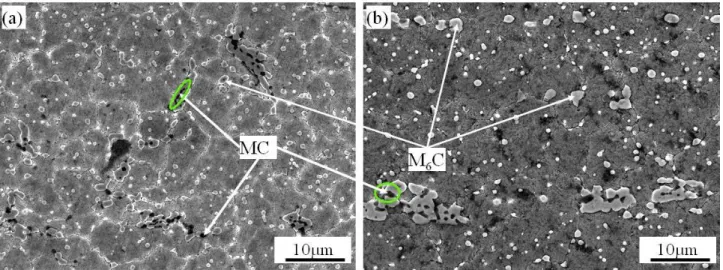
Since the evolution of the microstructure is relatively similar along each sample, the results of sample 1 are mainly discussed. SEM micrographs of as-received M2 steel grade on both transversal and longitudinal directions are shown in Fig. 2. Two types of carbides which are distributed in the martensite matrix and along grain boundaries were observed in the SEM micrographs. In addition, segregation carbides bands (Fig. 2 (b)) were observed parallel to the working direction. The whiter and darker carbides present in the as-received material were examined and confirmed using EDS. They were M6C carbides rich in W and Mo, and MC carbides rich in V, W and Mo, respectively. The
average grain size was 10µm measured by the lineal intercept method as illustrated in ASTM E 112-96. The separated carbides size was ~1µm.
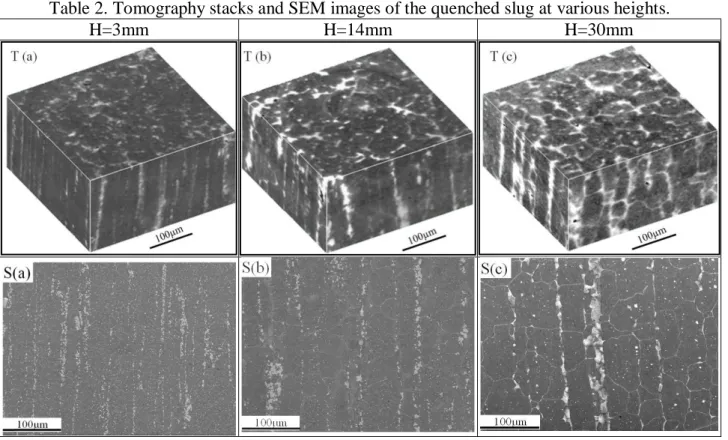
Fig. 2. SEM micrographs of as-received M2 steel on (a) transversal and (b) longitudinal directions. After quenching, the slug was investigated by SEM-EDS (2D) and X-ray microtomography (3D). Table 2 compares the microstructures at various heights obtained by these two techniques. Figures marked with a "T" are X-ray microtomography stacks while those marked with a "S" come from SEM. White zones were carbides, dark ones were pores while dark gray zones corresponded to the matrix. When looking at SEM images or stacks, it can be found that the microstructure at various heights is different. As illustrated in Fig. 1, due to the relative positions of the slug and induction coil as well as the effect of penetration depth during induction heating, the temperature distribution throughout the slug was heterogeneous, therefore resulting in different microstructures at various heights. The bottom of the slug remained in the solid state owing to a deficit of heat source in this area, thus a similar microstructure to that of the as-received M2 was observed (Table 2: H = 3mm). The temperature increased with height. For example, at the height of 14mm, the temperature was higher; some of the original carbides were dissolved and the alloying elements such as V, Mo and W in carbides along the microsegregation bands started diffusing into the liquid zones where the
solubility was higher. New carbides were created at the grain boundaries after quenching as presented in the tomographic stacks and SEM micrographs. The diffusion process was enhanced with increasing temperature or height, the original carbides were gradually dissolved with the diffusion of the alloying elements to the liquid zones; the latter formed very large new interconnected carbides after quenching as illustrated in the images at the height of 30mm in Table 2. In addition, compared to that as-received state, the microstructure in the semi-solid state was much different in grain size, carbides morphologies, etc. The newly formed interconnected carbides made the definition of the grain size obvious (average grain size: ~40µm * 65µm). Although there was a significant growth in grains, the average grain size was relatively small owing to the carbide pinning effect.
Table 2. Tomography stacks and SEM images of the quenched slug at various heights.
H=3mm H=14mm H=30mm
When comparing the images obtained by these two techniques, the correspondence was good, although there were some small differences in grain size and carbides distribution. These differences may have been caused by the resolution of X-ray microtomography. As presented in Fig. 2, many carbides were smaller than 1µm, which made them impossible to be distinguished. Furthermore, if the distance between the isolated carbides was less than 3µm, the carbides may have been considered as one large particle. However, the carbides and the segregation bands could be observed in the X-ray microtomography results (Table 2). By 2D and 3D image analysis, the total volume fraction of carbides as a function of height was obtained, Fig. 3. The difference in the results obtained by these two techniques may have been due to the resolution of the X-ray microtomography and the number of 2D images considered. However, the difference was relatively small. The carbides fraction curve obtained by 3D microtomography (more than 800 slices were analyzed for 1mm in height) is discussed below.
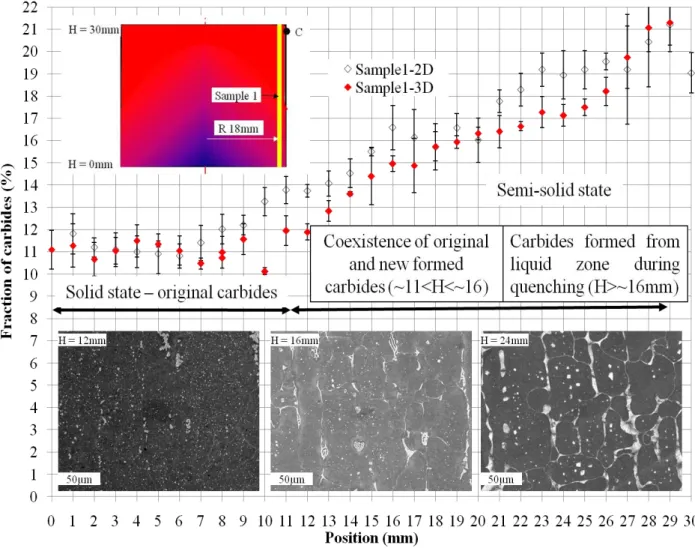
It was found that the carbides fraction remains stable (11±1%) over the height interval from 0mm to ~11mm. With a rapid growth from 11±1% to 15±1% which covered the height from ~11mm to 17mm, the fraction of carbides increased slowly until reaching the value of 21±1%. The material from the bottom up to the height of ~11mm was assumed to be in the solid state, because the microstructure (small separated carbides are distributed in the matrix and along grain boundaries) and the volume fraction of carbides (11±1%) were similar to those in the as-received state. With increasing height, some of the carbides were dissolved; the material contained liquid zones, original carbides and austenite grains. The new carbides were formed instead of liquid zones during subsequent quenching
process as shown in the micrograph at the height of 12mm in Fig. 3. Using SEM, it was found that at the height of ~16mm (Fig. 3), the original carbides were completely dissolved and new ones were formed from the liquid zones during quenching. In fact, in the zones higher than 16mm, the temperature was maximum, the carbides were dissolved with the diffusion of the alloying elements to the liquid zones; in this case, the volume fraction of new carbides was equal to the former liquid volume fraction.
Fig. 3. Fraction of liquid as a function of the height for Sample 1 obtained by 2D and 3D image analyses.
Conclusion
The microstructure evolution of the M2 steel after induction heating from the as-received state to the semi-solid state was analyzed with both 2D and 3D techniques. The as-received material showed different types of carbides (MC-type and M6C-type), they were identified by EDS, while X-ray
microtomography illustrated their 3D distribution with microsegregation bands parallel to the working direction. After being induction-heated and water-quenched, the microstructure was totally different with new large interconnected carbides corresponding to the former liquid zones in the semi-solid state. A grain growth was also observed during heating. The volume fraction of carbides was calculated from 3D X-ray microtomography results and SEM-EDS; they showed a good agreement that proved that both techniques were as efficient in characterizing high-alloyed steels in the semi-solid state. If the high energy X-ray microtomography has proven to be a powerful tool for this study, SEM and EDS techniques were easy to use in a laboratory and could also lead to a precise determination of the volume fraction of liquid at the semi-solid state after quenching.
Acknowledgement
The authors warmly thank Luc Morhain and Marc Wary (Arts et Métiers ParisTech CER Metz) for their technical support. The authors are also grateful to ESRF for providing beam time on the ID15 beamline and to all staff members of the line for their help and discussion during the experiments.
References
[1] R. Bigot, V. Favier, C. Rouff. Characterisation of semi-solid material mechanical behavior by indentation test. J. Mater. Process Tech. 160 (2005) 43-53.
[2] E. Becker, V. Favier, R. Bigot, P. Cezard, L. Langlois. Impact of experimental conditions on material response during forming of steel in semi-solid state. J. Mater. Process. Tech. 210 (2010) 1482-1492.
[3] L.S. Turng, K.K. Wang. Rheological behavior and modeling of semi-solid Sn-15% Pb alloy. J. Mater. Sci. 26 (1991) 2173-2183.
[4] S.J. Qu, A.H. Feng, L. Geng, Z.Y. Ma, J.C. Han. DSC analysis of liquid volume fraction and compressive behavior of the semi-solid Si3N4w/Al-Si composite. Scripta Mater. 56 (2007) 951-954.
[5] M.Z. Omar, E.J. Palmiere, A.A. Howe, H.V. Atkinson, P. Kapranos. Thixoforming of a high performance HP9/4/30 steel. Mater. Sci. Eng., A. 395 (2005) 53-61.
[6] A. Neag, V. Favier, R. Bigot, M. Pop. Microstructure and flow behavior during backward extrusion of semi-solid 7075 aluminium alloy. J. Mater. Process. Technol. 212 (2012) 1472-1480. [7] D.J. Rowenhorst, A. Gupta, C.R. Feng, G. Spanos, 3D crystallographic and morphological analysis of coarse martensite: Combining EBSD and serial sectioning, Scripta Mater. 55 (2006) 11-16.
[8] M.Z. Omar, A. Alfan, J. Syarif, H.V. Atkinson. Microstructural investigations of XW-42 and M2 tool steels in semi-solid zones via direct partial remelting route. J. Mater. Sci. 46 (2011) 7696-7705. [9] G.C. Gu, R. Pesci, E. Becker, L. Langlois, R. Bigot, M. Scheel. Quantification and localization of the liquid zone of partially remelted M2 tool steel using X-ray microtomography and scanning electron microscopy. Acta. Mater. 60 (2012) 948-957.
[10] M.Z. Omar, H.V. Atkinson, A.A. Howe, E.J. Palmiere, P. Kapranos, M.J. Ghazali. Solid-liquid structural break-up in M2 tool steel for semi-solid metal processing. J. Materi. Sci. 44 (2009) 869-874.