HAL Id: hal-02648711
https://hal-mines-albi.archives-ouvertes.fr/hal-02648711
Submitted on 6 Jul 2020
HAL is a multi-disciplinary open access
archive for the deposit and dissemination of sci-entific research documents, whether they are pub-lished or not. The documents may come from teaching and research institutions in France or abroad, or from public or private research centers.
L’archive ouverte pluridisciplinaire HAL, est destinée au dépôt et à la diffusion de documents scientifiques de niveau recherche, publiés ou non, émanant des établissements d’enseignement et de recherche français ou étrangers, des laboratoires publics ou privés.
Toward an Aggregate Approach for Supporting
Adaptive Sales And Operations Planning
Jean Vidal, Matthieu Lauras, Jacques Lamothe, Romain Miclo
To cite this version:
Jean Vidal, Matthieu Lauras, Jacques Lamothe, Romain Miclo. Toward an Aggregate Approach for Supporting Adaptive Sales And Operations Planning. ICIEA 2020 - 7th International Con-ference on Industrial Engineering and Applications, Apr 2020, Bangkok, Thailand. pp.1031-1038, �10.1109/ICIEA49774.2020.9102060�. �hal-02648711�
Toward an Aggregate Approach for Supporting Adaptive Sales And Operations
Planning
Jean Vidal, Matthieu Lauras, Jacques Lamothe Centre Genie Industriel
IMT Mines Albi Albi, France
e-mail: { jean.vidal, matthieu.lauras, jacques.lamothe}@mines-albi.fr
Romain Miclo AGILEA Toulouse, France e-mail:[email protected]
Abstract—The Demand-Driven Adaptive Enterprise (DDAE)
model introduced by the Demand Driven Institute (DDI) few years ago becomes of prime interest for both scholars and practitioners. This research work is investigating the rarely studied strategic part of this DDAE model called Adaptive Sales and Operations Planning (AS&OP) process. One of the main issues regarding this strategic process is to determine how to model it through product family aggregates. Actually, literature analysis demonstrated that no solution exists to support such a process. This research work intends to solve this issue by designing a first AS&OP model allowing an aggregate reasoning. This proposal has been successfully tested on a illustrative but realistic example.
Keywords-component; S&OP; AS&OP; DDAE; DDMRP; aggregate production planning; decision support system
I. INTRODUCTION
Market globalization and industrial competition have led companies to maximize their profitability while better considering uncertainties and variabilities. Regarding Supply Chain Management (SCM) practices, experts and scholars have developed methods and techniques able to handle the stakes of profitability such as JIT, TOC, KANBAN, MRP2, … [1]. The objective is systematically to respond to the customers’ demand while reducing costs by optimizing resources’ utilization. But as demonstrated by [2], most of these methods failed to manage properly the increasing uncertainties and variabilities that companies have to cope with nowadays. In a context where supply chain disruptions are becoming the norm, a recent innovation stands out: the Demand Driven Adaptive Enterprise (DDAE) [3].
Since 2011, DDAE attempts to make a synthesis of good practices from previous material management methods and adds some valuable innovations [3]. It has shown its ability to be agile and robust in disrupted context when compared to Kanban and MRP2 [2] However, despite the increasing interest from both practitioners and scholars for DDAE, it is still in its infancy and needs additional contributions to consolidate both the method itself and the associated decision support systems [2]. The Demand Driven Institute (DDI) spent a lot of effort during the last decade on the operating model (Demand Driven Operating Model or Demand-Driven Material Requirement Planning) while staying more vague on the tactical and strategical levels of DDAE. In particular, the strategic layer of DDAE, called
Adaptive Sales and Operations Planning (AS&OP) has rarely been studied and, would benefit a lot from additional studies to support concrete implementations. Among all potential improvements, one key issue is about the granularity level that should be used to complete the AS&OP decision making. Ones indicate that it should be managed by aggregating elementary calculations made at the product (variant A) level while others indicate that the process must directly be modeled as aggregated (through families of products) (Variant B) to support the analysis and the associated decisions. For long time, it has been demonstrated that Variant B allows major benefits such as minimizing staffing fluctuations, reducing overheads or increasing production efficiency [4]-[6]. However, it has also been demonstrated that such a Variant is not trivial to be implemented in real context [7]-[9].
This research work focuses on this problem statement and attempts (i) to demonstrate the feasibility of using an aggregated model (Variant B) to support the AS&OP process and (ii) to discuss benefits and limits of following such an approach.
The remainder of the paper is composed of 4 main sections. First, a literature analysis is developed in order to position the research question and the expected contribution. Second, an aggregated AS&OP model is proposed for supporting decision making. Third, an illustrative case is depicted in order to validate the proposal and to discuss its benefits and limits. Fourth, a quick conclusion is given and avenues for future research are described.
II. BACKGROUND AND PROBLEM STATEMENT
A. DDAE Model
Since 2011, the Demand Driven Institute (DDI) has designed, developed and popularized the DDAE model through trainings, conferences, implementations and publications [1],[3],[10],[11]. Basically, the DDAE model follows a classic planning hierarchical structure (figure 1.), as for MRP2 [12]. Typically, it includes three planning levels dedicated to respectively operational (Demand Driven Operating Model DDOM), tactical (Demand Driven Sales and Operations Planning DDS&OP) and strategic (Adaptive Sales and Operations Planning AS&OP) issues. The basic mechanics of the DDOM consists in identifying buffered items and replenish buffers (figure 2.) to a top of green zone anytime they (similar to inventory position) falls into a green zone. One of the specificities of DDOM is that Green and Yellow zones change over time according to a forecasted Average Daily Usage. Another one is to deal differently with usual and spike buffer consumption.
Figure 2. Principle of a stock buffer in DDOM [13].
For full detail on the DDAE mechanism, the reader cans refer to [1],[3],[10],[11].
More recently, scholars have started to study the DDAE paradigm [2],[13]-[16] notably by focusing on the DDOM, previously called Demand Driven Materials Requirement Planning (DDMRP). They demonstrated ([2],[13]-[16]) the agility of DDMRP , especially in disrupted and uncertain environments, for maintaining performances (costs, lead times and inventories). DDMRP model behaviors have also been exhibited by studying its variables and by challenging the empirical elements of the model. Martin et al., 2018 [11], for instance, introduced a formal process modeling of DDS&OP and AS&OP.
Martin et al., 2018 [11] underlined that AS&OP features are very close to the usual S&OP ones but highlighted some specificities: buffer positioning at strategic level, capability to deal with strategic opportunities. Vidal et al., 2018 [17] made an empirical comparison of S&OP and AS&OP. They shew, among others, that an ambiguity remains regarding the granularity level that has to be considered to support the AS&OP process. The DDI ([3], [10]) indicates that, as for usual S&OP best practices [18]–[20],[22]–[24], the process should consider aggregates as a reference to make calculations and analyses. Because of the simplicity of the DDAE order generation process, the accessibility to DDOM simulation and management software, practitioners work directly with elementary end items as the DDAE model does
not include a clear and formal method to do it differently. In this paper, aggregated products are define as a Family : A
group of end items whose similarity of design and manufacture facilitates their being planned in aggregate, whose sales performance is monitored together, and (occasionally) whose cost is aggregated at this level [21].)
One of the strengths of the DDAE model is to focus on the use of relevant data at each level of decision-making. Typically, product sales forecasts at the operational level are used for designing buffers but not for order generation. For AS&OP, DDI trainings and publications[1] recommend to respect this practice of using relevant data, but no proposal for modeling operations at this level is given. In addition, the few examples on the DDS&OP subject aggregate data (Variant A) what seems to go against the best practices on the subject (Variant B)
B. Research Question
Based on the previous statements, the following research question can be formulated: Is it possible to support an
AS&OP process through a pure aggregated perspective? If yes, how this approach can be technically supported?
The objective is finally to develop a solution that consider only families of products at the strategic level (Variant B) instead of a simple aggregation of elements resulting from the simulation of the operational DDOM to elementary end items (Variant A).
The following section will develop such a model. III. PROPOSAL
A. Notation
Table I defines the notations used in this research work.
TABLE I. NOTATIONS Notations
General notation Specific notation from DDAE
Fi : Product Family i FCm : Component Family m FPCp : Purchased Family p Pij : Product j of Family i Cmn : Component n of Family m PCpq : Purchased Component q of Purchased Family p WOCr : Work Center r WOCrit : Critical Work Center capaWOCrit : Capability of WOCrit
WH : Wharehouse
αij : Mixte Product, % Pij in family i
βFi : Family mix, % Fi in total θFI : Family mix i of ADUcri; %contribution Fi in total
BOMjm : Bill of Material of Pij and component m
AvIi or k: Average Inventory of Family I OR component k PRj: Aggregate Price of Product of Family i
PRCm : Aggregate Price of Component of Family m
SBij: Stock Buffer of Product j of Family i
ADUij: Average Daily Usage of Product j of Family i
DLTij: Decoupled Lead Time of Product j of Family i
MOQij: Minimum Order Quantity of Product j of Family I
GZij: Green Zone of Product j of Family i
YZij: Yellow Zone of Product j of Family i
RZij: Red Zone of Product j of Family i
LTFij: Lead Time Factor of Product j of Family i
VFij: Variability Factor of Product j of Family i
OCij: Order Cycle of Product j of Family i
SBFi, ADUi, DLTi, GZi, YZi, RZi, LTFi same notions to aggregate (family product level i).
Notations
General notation Specific notation from DDAE
PRPCp : Aggregate Price of Purchased Component of Family p
CMi : Contribution Margin of one product of Family WK : Working Capital CM : Contribution Margin
i by Cm or PCp in order to obtain correct notation necessary about component and purchased component (exemple : ADUij give ADUCmn, ADUPCpq)
DAFi: Demand Adjustment Factor of ADUi
ADUCrit: Average Daily Usage Aggregate Family Product or Component on the flow of WCri
B. Assumptions
To develop an aggregate planning approach, the following assumptions have been made:
(A1) Be able to provide an average daily usage ADUi to the product family reference over the required horizon;
(A2) Be able to provide αij, βFi and calculate θFi; (A3) All considered buffers are managed within a DDOM approach;
(A4) Product families are elaborated with a production perspective (same production process within a family);
(A5) buffers’ location are the same for all items of a given family.
(A6) DLTij and LTFij are similar for any item j of a same family Fi..
(A7) FCm families are built as Fi families, i.e. considering workflow similarities and FCm as a finished product. FPCp families are constituted by supplier.
(A8) Critical resources are known.
(A9) Spikes’ management is not considered in this version of the model.
C. Aggregate DDOM model at product family level
Figure 3. Four Elementary Brick of an Aggregate model at product family in DDOM environment.
Our main objective is to develop generic DDOM elementary bricks at the product family level in order to be able to build a specific “bricks assembly” for each industrial situation. The following three-step approach (figure 3.) has been set up to reach this goal:
(1) Define a SBFi model of a buffer aggregated to the any family Fi;
(2) Determine how ADUi is propagated, calculate ADUCm and ADUPCp and then derive from (1) and (2) the possibility of managing SBFCm and SBFPCp like SBFi;
(3) Calculate strategic Key Performance Indicators (KPI) recommended by the DDAE model: Working Capital, Margin Contribution and Load Ratio of Critical Resources.
In the following, each step of the proposed method is described in detail.
1) Step1: Family Buffer SBFi definition
At the DDOM level, each buffer SBij is linked to two groups of data: (i) Individual Part Properties and (ii) generic Buffer Profiles (Figure 4.).
Figure 4. Buffer Profiles and Individual Part Properties of Stock Buffer[13].
Each buffer SBij is therefore specific to its product Pij. To have information usable at the AS&OP level, we could aggregate this specific information to obtain the data useful for quantifying the key performance indicators. But ADUij knowledge is not relevant over a long projection horizon. ADUi information being relevant, we propose to include it as basic data of our SBFi brick. In order to develop our AS&OP Model (Variant B), we propose to integrate two elements at the level of the basic calculation formulas (figure 2.) for the parts of an SBFij in DDOM Model:
(1) The characteristics LTFij and DLTij are similar to the family i (Assumption (A6)) denoted LTFi and DLTi.
(2) Each Pij has its own ADUij (example: a seasonal product within a family product) and it is desirable to keep the impact of this at the aggregate level. By integrating the mixed predictive product αij, we can
from ADUi (Assumption (A1)(A6)) reach an image of the impact of each component of the family via its own buffer characteristics at the desired level. We use ADUij = αij x ADUi.
Concerning the green zone GZi, a partial aggregation results of assumption (A1) on ADUi but a transition to the product reference via αij takes into account specificities such as Minimal Order Quantity MOQij or OCij.
Concerning the tallow zone YZi, an aggregation to the family of products with the use of DLTi and ADUi (assumption (A2))..
Concerning red zones RZi, a partial aggregation results of assumption (A1) and the use of ADUi and LTFi but a transition to the product reference via αij to take into account the impact of variability VFij.
Our proposal is summarized in figure 5. and constitutes a tradeoff allowing an aggregate model.
Figure 5. Characterization of a Aggregate Stock Buffer SBFi
The same approach can be applied for SBFCm and SBFPCp. However, ADUCm and ADUPCp must be determined from ADUi.
2) Step 2: Calculation of ADUCm and ADUPCp
Regarding ADUCm and ADUPCp, the DDAE methodology does not propose a clear calculation step [1], [3]. and especially when the decoupled lead time DLT between two buffers is long (greater than a month).
We therefore propose to calculate ADUCm at time T (and similarly ADUPCp) by performing a bill-of-material explosion that considers decoupled lead times as indicated in the following formula:
∑ (∑
)
Figure 6. illustrates this principle that can be integrated in each link between SBFi, SBFCm and SBFPCp to compute ADUs adequately and to specify the relevant buffers’ parameters.
Figure 6. Buffer Profiles and Individual Part Properties of Stock Buffer [13].
Figure 7. Total Average Inventory per month for calculating Working Capital.
3) Step 3: KPI to make a decision
In this step, the KPIs recommended by [3] are instantiated for financial perspective on one hand through working capital and contribution margin and for capability perspective on the other hand through load of critical resource.
a) Working Capital (WC)
Figure 7. shows the calculation of the overall average stock over a period studied with the following logic:
Total Average Inventory = Total Average Inventory Buffer Family + Work in Progress
For a stock buffer associated to a given product Pij, he average stock is
, the in production is
. We then propose the following formula at the aggregate product family level:
∑ ∑ ∑
b) Contribution Margin (CM)
This KPI is used to make choices in case of saturation of the critical resource WOCrit by prioritizing the ratio βFi which has the largest contribution margin in money. This is an important criterion that allows the main services (Portefolio, Demand, Production, Purchasing…) participating in the AS&OP process to find the most profitable compromise. Therefore, we defined the parameter
θFi as being the percentage of participation of each family Fi to the ADUcri corresponding to the critical resource. We finally propose the following formula principle at aggregate product family level:
∑
c) Load of critical ressource
As the maximum capacity of the critical resource CapaWOCrit is known, it is easy to compare it with the load ADUCrit for each period studied throughout the AS&OP process. As for the contribution margin, we used appropriate ADUi, ADUCm or ADUPCp depending on WOCrit position. This approach also makes it possible to check resources like operator, work-center or storage capacity.
IV. EXPERIMENT AND DISCUSSION
A. Illustrative Case Presentation
In order to validate our proposal, we consider a flow production workshop consisting of WOCr work-centers with r {1,3}, a unique WH warehouse with products Pij divided into Families Fi with i{1,3} and j {1,2} as well as components purchased Ck with k{1,3}. The critical resources are the following ones: WOCr2 and WH. Each Pij and Ck are individually managed by a stock buffer.
This illustrative case respects all the assumptions discussed in section III. Figure 8. describes the data set used for this experiment.
B. Implementation of Our Aggregate Model in Our Use Case
In the DDAE logic, rather than working on the basis of a single data set, including bias and uncertainties, the method suggests to always consider "roughly right" decision making process rather than "precisely wrong" decision making process [4]. Table II. Represents an anthology of opportunities and risks that a company must manage in an S&OP process. We will use them to create a scenario to test and validate our aggregate approach.
Figure 8. Principal data of our theoretical data
TABLE II. EXAMPLE OF OPPORTINITIES/RISKS ADRESSED DURING
AS&OP
Notation
OPPORTUNIY RISK
Expand to a new market Consumer demand change, incorrect forecast, Lost Sales New Product Introduction Price Changes
Unique exceptional sale
Lack capacity (human, technology, process, business process, development problem…) Change technology Incorrect Inventory
TABLE III. EXAMPLE OF DECISION IN AS&OP INSPIRED BY [22]
AREA DECISION Example
OPERTATION STRATEGY
DECISION
CAPACITY Concernes how capacity and facilities in geneal should be
configured
Adjust/Change Capacity (human
or process)
SUPPLY NETWORK Includind Purchasing and
Logistics
Concerns how operations relate to the interconnected network of
other opérations" "Make or Buy product Change supplier contract" PROCESS TECHNOLOGY
Concerns to convert resources into finished goods or services
Integrate new technology ORGANIZATIONNAL
IMPROVEMENT Concerns to convert organization
in an better one
Kaizen
INVENTORY MANAGEMENT Concerns how operations manage the management of
production flows Change operating model parameters MARKETING STRATEGY PORTEFOLIO, NEW
AREA DECISION Example
Concerns how the market should be configured
activities accelerate the sale
of a product"
FINANCE STRATEGY
FINANCE concerns the management of
financial objectives
change / adapt the level of financial
objectives to be achieved over a given period
Using the three-step methodology developed in section III, we obtain the aggregate model shown on figure 9.
The context for this AS&OP iteration is the following: an opportunity on market 2 concerning F3 is possible from the 10th month, with a 300% increase of volume. The decision-makers want to assess the potential impacts of such an increase and the associated decisions which can be made. The constraints are the following ones: not to exceed the maximum capacity of the critical resources WC2 and WH, not to exceed the working capital limit per month fixed by the finance department (1,600,000 $), to realize profits greater than without this increase, improvements may be considered subject to not exceeding the limit set by the finance department.
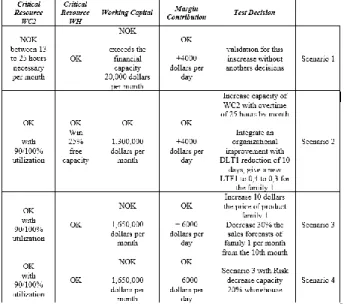
TABLE IV. SYNTHESIS OF FOUR SCENARIOS TESTED VIA OUR MODEL ON OUR USE CASE
Figure 9. Specific Use Case Model Aggregate with the use of generic bricks of our aggregate model developed in section III
Four example scenarios have been successfully tested, mixing actions related to different possible decisions (Table IV.). With the use of a good level of information to the aggregate family product level, it is easy to build a scoreboard quickly interpretable by AS&OP stakeholders as shown on figure 10.
C. Discussions and Limit
Firstly, the proposed model and the previous illustrative case demonstrate that using an aggregate perspective to execute an AS&OP process is possible. The model suggested in this paper also gives a first concrete and
generic technical support to do this. However, this result has been done under specific conditions that must be discussed.
Secondly, concerning the assumptions made, it appears that some are questionable regarding real business cases. The assumption (A2) that consists in knowing αij might be difficult to validate. In some situation, gathering the volume estimate by family can be really difficult on a long-time range and would need a sensitivity analysis of the effects of estimation errors. The assumption (A3) considering that each stock is managed by a buffer is strong. The set of experience feedback presented during the various events organized for several years by the DDI [10] show i. taking into account time buffer and capacity buffer in addition to the stock buffer ii. rather hybrid solutions with some items managed through a DDOM, while others are managed through a MRP2. Our model does not yet integrate this hybrid situation. The assumption (A7) which consist in defining aggregates or families is sensitive. Actually, most of the companies which work with MRP2 and the associated S&OP process are normally used to do so. But, as indicated by [23], [24] often, the aggregates are simple aggregations of elementary end items data sets implying loss of information. This is typically the trap that consist in thinking in a “precisely wrong” perspective instead of reasoning in a “roughly right” dynamic[3]. Our solution which combines DDOM model with an aggregate planning production approach provides interesting alternative for practitioners.
Figure 10. Simple Excel Scoreboard with relevant KPI inspired by DDAE on our model.
Thirdly, in the context of our illustrative case, we tested only few parameter changes. In a real context, the combinatory would be much larger and would imply more
variability and sensitivity in the decision-making process. In order not to miss out on a set of appropriate decisions, an automatic generation of several decision sets able to yield the most plausible results would be a real plus for supporting end users.
Fourthly, changes in the DDOM model, a tested scenario led us imagining an increase in demand on a family for a short time but with a high rate of demand variability (risk), as an exceptional opportunity to seize or not. This scenario involved modifying the forecast parameters of the DDOM at the same time as the increase in demand. This is an unusual approach in MRP2, linking strategic decisions at the S&OP level to parameterization decisions of the operating model in place. It is a specificity of the DDAE which multiplies the possibilities of actions. We sought to find out more about this on the basis of practitioner interview, the following decisions specific to the DDOM model may require the level of responsibility AS&OP: (i) change the strategic position of a buffer, (ii) the type of buffer (Time, Stock or Capacity), (iii) the calculation formula of ADU, (iv) horizon of detection of a spike, (v) the membership of an article to a profile of buffer but also to implement requests demand adjustment factor (DAF) or planning adjustment factor (PAF) of ADU in long period. Our model has challenged some of these elements, but not all. In particular, the following elements are not taken into account: time and capacity buffer, spike detection horizon, and will have to be taken into account to apply our approach to cover a wider spectrum of corporate reality.
V. CONCLUSION
In a context where the DDAE model is becoming more and more important to manage material flow in Supply Chains, we studied in this paper the following research question: Is it possible to support an AS&OP process
through a pure aggregate perspective? If yes, how this approach can be technically supported? Our research work
demonstrated that such an approach is possible and developed a concrete model able to support this in practice.
However, this work is its infancy and has still important limits, particularly regarding some assumptions made that are only partially validated by current real DDAE business cases.
Although this proposal has great potential for future DDAE implementations, it is also allowed identifying numerous rooms for future research among which:
Firstly, we have demonstrated that it is possible to achieve a holistic approach to support the AS&OP process, but it remains to demonstrate that it is an improvement over the direct use of the DDOM model and its simple data aggregation. A robust comparative study of these two approaches is needed to determine the best option for AS&OP.
Secondly, the experiment is quite poor at this stage and extensions seem to be mandatory. Notably, more complex
use cases included the following features would be interesting to study:
- Different types of buffer (Min/Max, Time Buffer, Capacity Buffer);
- Integrate peak demand variable as the DDAE manages it at the DDOM level;
- Environment with hybrid material management methods (KANBAN, CONWIP, DDOM, MRP2…)
Thirdly, our intention was to use aggregates to support the AS&OP process rather than an aggregated reference. Our model does this only partially. Seeking to eliminate steps using aggregated references is a way to go.
REFERENCES
[1] C. Ptak et C. Smith, Demand Driven Material Requirements Planning (DDMRP), Version 3. Industrial Press, Incorporated, 2019.
[2] R. Miclo, M. Lauras, F. Fontanili, J. Lamothe, et S. A. Melnyk, «Demand Driven MRP: assessment of a new approach to materials management », Int. J. Prod. Res., vol. 57, no 1, p. 166‑181, janv. 2019. [3] D. Smith et C. Smith, Demand Driven Performance. McGraw Hill
Professional, 2014.
[4] G. R. Bitran et D. Tirupati, « Chapter 10 Hierarchical production planning », in Handbooks in Operations Research and Management Science, vol. 4, Elsevier, 1993, p. 523‑568.
[5] A. C. Hax et H. C. Meal, « Hierarchical Integration of Production Planning and Scheduling. », MASSACHUSETTS INST OF TECH CAMBRIDGE OPERATIONS RESEARCH CENTER, TR-88, sept. 1973.
[6] H. ANDERSSON, S. AXSÄTER, et H. JÖNSSON, « Hierarchical material requirements planning », Int. J. Prod. Res., vol. 19, no 1, p. 45‑57, janv. 1981.
[7] C. T. Maravelias et C. Sung, « Integration of production planning and scheduling: Overview, challenges and opportunities », Comput. Chem. Eng., vol. 33, no 12, p. 1919‑1930, déc. 2009, doi: 10.1016/j.compchemeng.2009.06.007.
[8] M. Kremer, C. Schneeweiss, et M. Zimmermann, « On the validity of aggregate models in designing supply chain contracts », Int. J. Prod. Econ., vol. 103, no 2, p. 656‑666, oct. 2006, doi: 10.1016/j.ijpe.2005.12.007.
[9] A. Cheraghalikhani, F. Khoshalhan, et H. Mokhtari, « Aggregate production planning: A literature review and future research directions », Int. J. Ind. Eng. Comput., vol. 10, no 2, p. 309‑330, 2019. [10] «Demand Driven Adaptive Enterprise (DDAE) », The Demand Driven Institute - World Leader in Demand Driven Education. Demanddriveninstitute.com, 2019. [Online]. Available:
https://www.demanddriveninstitute.com/demand-driven-adaptive-enterprise-m. [Accessed: 11- Dec- 2019].
[11] G. Martin, P. Baptiste, J. Lamothe, R. Miclo, et M. Lauras, «A process map for the demand driven adaptive enterprise model: towards an explicit cartography », 2018.
[12] O. Wight, Manufacturing Resource Planning: MRP II: Unlocking America’s Productivity Potential. John Wiley & Sons, 1995. [13] R. Miclo, Challenging the «Demand Driven MRP » Promises : a
Discrete Event Simulation Approach. Ecole nationale des Mines d’Albi-Carmaux, 2016.
[14] L. Ducrot et E. Ahmed, «Investigation of potential added value of DDMRP in planning under uncertainty at finite capacity », 2019. [15] L. Meinzel, «DDMRP: presentation of a new solution of stock
management and master production scheduling », juill. 2019. [16] A. P. V. Acosta, C. Mascle, et P. Baptiste, «Applicability of
Demand-Driven MRP in a complex manufacturing environment », Int. J. Prod. Res., vol. 0, no 0, p. 1‑13, août 2019.
[17] J.-B. Vidal, M. Lauras, J. Lamothe, et R. Miclo, «Adaptive Sales & Operations Planning: Innovative Concept for Manufacturing Collaborative Decisions? », in Collaborative Networks of Cognitive Systems, 2018, p. 362‑374.
[18] A. M. Tavares Thomé, L. F. Scavarda, N. S. Fernandez, et A. J. Scavarda, «Sales and operations planning: A research synthesis », Int. J. Prod. Econ., vol. 138, no 1, p. 1‑13, juill. 2012.
[19] N. Tuomikangas et R. Kaipia, «A coordination framework for sales and operations planning (S&OP): Synthesis from the literature », Int. J. Prod. Econ., vol. 154, p. 243‑262, août 2014.
[20] J. Kristensen et P. Jonsson, «Context-based sales and operations planning (S&OP) research: A literature review and future agenda », Int. J. Phys. Distrib. Logist. Manag., vol. 48, no 1, p. 19‑46, janv. 2018.
[21] P. Pittman et J. B. Atwater, APICS Dictionary, 15th Edition. APICS, 2016.
[22] N. Slack et M. Lewis, Operations Strategy. Pearson Education, 2002. [23] R. C. Ling et W. E. Goddard, Orchestrating Success: Improve Control
of the Business with Sales & Operations Planning. Wiley, 1989. [24] «CPIM - Certified in Production and Inventory Management |
APICS », 2019, [Online]. Available sur: http://www.apics.org/credentials-education/credentials/cpim. [Accessed: 11-Dec-2019].
![Figure 1. DDAE model [10].](https://thumb-eu.123doks.com/thumbv2/123doknet/12246332.319674/2.918.471.811.822.1027/figure-ddae-model.webp)
![Figure 4. Buffer Profiles and Individual Part Properties of Stock Buffer[13].](https://thumb-eu.123doks.com/thumbv2/123doknet/12246332.319674/4.918.484.831.360.737/figure-buffer-profiles-individual-properties-stock-buffer.webp)
![Figure 6. Buffer Profiles and Individual Part Properties of Stock Buffer [13].](https://thumb-eu.123doks.com/thumbv2/123doknet/12246332.319674/5.918.89.443.410.574/figure-buffer-profiles-individual-properties-stock-buffer.webp)