Seasonal Variations In Groundwater Quality Of Valsad District Of South Gujarat (india)
6
0
0
Texte intégral
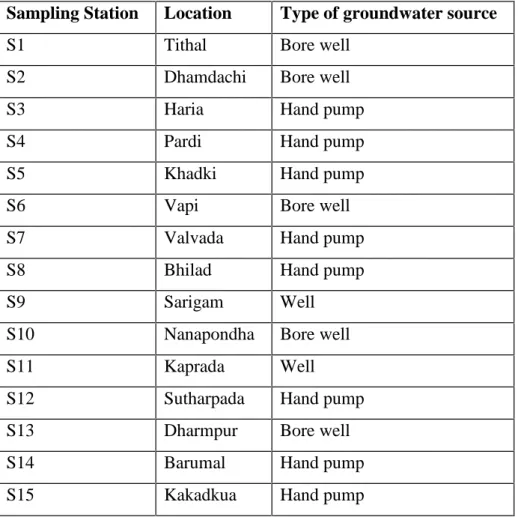
(2) R. T.Vashi et al.. J Fundam Appl Sci. 2015, 7(2), 163-168. 164. Water quality assessment generally involves analysis of physicochemical, biological and microbiological parameters and reflects on abiotic and biotic status of the ecosystem. This, in turn, helps in planning exploitation, antipollution or conservation strategies. Further, due to their open nature and constant change of matter and energy goes on between ecosystem and its surroundings thus making water quality a dynamic entity. The present paper assesses the groundwater quality in some villages of Valsad district and studies the effect of seasonal variations on the groundwater quality.. 2. MATERIALS AND METHODS Valsad district is laid between 200 8’ to 210 9’ N latitudes, and 620 39’ to 730 30’ E longitudes. The district has 74.10 km long sea belt. Average rainfall in this region is 1500 to 2200 mm. The district has four main rivers named Auranga, Par, Damanganga and kolak. Total fifteen sampling stations are selected for study of groundwater of Valsad district. Details of sampling station is given in Table 1.. Table 1: Sampling stations, locations and type of ground water sources Sampling Station. Location. Type of groundwater source. S1. Tithal. Bore well. S2. Dhamdachi. Bore well. S3. Haria. Hand pump. S4. Pardi. Hand pump. S5. Khadki. Hand pump. S6. Vapi. Bore well. S7. Valvada. Hand pump. S8. Bhilad. Hand pump. S9. Sarigam. Well. S10. Nanapondha. Bore well. S11. Kaprada. Well. S12. Sutharpada. Hand pump. S13. Dharmpur. Bore well. S14. Barumal. Hand pump. S15. Kakadkua. Hand pump.
(3) R. T.Vashi et al.. J Fundam Appl Sci. 2015, 7(2), 163-168. 165. The climate of the Valsad district is neither hotter nor cooler, it is temperate. It has three distinct seasons viz., Winter – from middle of October to February, Summer - from March to middle of June and Monsoon - from middle of June to middle of October. The groundwater samples were collected in two litre polythene bottles which were thoroughly washed twice with the water to be analyzed. The physico-chemical parameters like pH, Colour, Total hardness (TH), Calcium (Ca), Magnesium (Mg), Total Alkalinity (TA), Chloride and Sodium were estimated as per APHA [3].. 3. RESULTS AND DISCUSSION Seasonal variation among parameters of groundwater samples of Valsad district are presented in fig. 1 and 2. It should be noted that precipitation as rainfall over Valsad district has been highly variable over the past several years. This together with the local weather conditions dominated by the high temperatures, dry climate and unpredictable monsoon pattern, makes it difficult to conclusively quantity the water quality as could be otherwise found in a normal monsoon year. Also, the results of water quality might be highly influenced by such drastic weather conditions and hence mask the effect of any other factor affecting the water quality of this region [4]. A pH value of water is an important index of acidity, alkalinity and resulting value of the acidic-basic interaction of a number of its mineral and organic components [5]. A pH level of three seasons were shown in decreasing order: winter (7.4) > summer (7.3) > monsoon (7.3). Seasonwise distribution of data indicates no significant change in pH value. Colour level of three seasons were shown in decreasing order: summer (4 hazen) > winter (3 hazen) > monsoon (3 hazen). Seasonwise distribution of data indicates no significant change in colour value. TH level of three seasons were shown in decreasing order: summer (377 mg/l) > winter (364 mg/l) > monsoon (363 mg/l). Seasonwise distribution of data indicates little higher values in TH in summer. Ca level of three seasons were shown in decreasing order: summer (89 mg/l) > winter (88 mg/l) > monsoon (88 mg/l). Seasonwise distribution of data indicates no significant change in Ca in summer. Mg level of three seasons were shown in decreasing order: summer (38 mg/l) > winter (35 mg/l) > monsoon (35 mg/l). Seasonwise distribution of data indicates little higher values in Mg in summer..
(4) R. T.Vashi et al.. J Fundam Appl Sci. 2015, 7(2), 163-168. 166. TA level of three seasons were shown in decreasing order: summer (272 mg/l) > winter (265 mg/l) > monsoon (258 mg/l). Seasonwise distribution of data indicates little higher values in TA in summer. In the main land scenario, the groundwater quality in terms of salinity and hardness is generally better during monsoon and gets deteriorated in summer or pre-monsoon [6]. Total alkalinity was high during summer and low during rainy season on account of dilution of water. A similar opinion has been expressed by Jain et al. [7,8]. Chloride level of three seasons were shown in decreasing order: summer (186 mg/l) > monsoon (183 mg/l) > winter (181 mg/l). Seasonwise distribution of data indicates little higher values in chloride in summer. The higher value during summer may be due to evaporation of water and mixing of organic waste of animal origin [7]. Sodium level of three seasons were shown in decreasing order: summer (129 mg/l) > winter (125 mg/l) > monsoon (122 mg/l). Seasonwise distribution of data indicates little higher values in summer. SAR level of three seasons were shown in decreasing order: summer (2.62) > winter (2.51) > monsoon (2.42). Seasonwise distribution of data indicates little higher values in SAR in summer.. Seasonal variation : Valsad District 8.0. pH, Colour, SAR. 7.0 6.0 5.0. pH. 4.0. Colour. 3.0. SAR. 2.0 1.0 0.0 Monsoon. Winter. Summer. Season. Fig. 1. Seasonal variation in Valsad district for pH, Colour, SAR.
(5) R. T.Vashi et al.. J Fundam Appl Sci. 2015, 7(2), 163-168. 167. Seasonal Variation : Valsad District 400.0 350.0. TH. mg/l. 300.0. Ca. 250.0. Mg. 200.0. TA. 150.0. Chloride. 100.0. Sodium. 50.0 0.0 Monsoon. Winter. Summer. Season. Fig. 2. Seasonal variation in Valsad district for TH, Ca,Mg,TA, Chloride, Sodium.. 4. CONCLUSIONS It can be observed that the groundwater quality in Valsad district as reflected by the physicochemical characteristics of groundwater samples from selected sampling stations varies widely. On the basis of above discussion, it may be concluded that majority of parameters are marginally higher in summer season.. 5. ACKNOWLEDGEMENTS The authors are grateful to Department of chemistry, Navyug Science College, Surat for providing the laboratory facility required to carry out the present work.. 6. REFERENCES [1]. Mheshwaran G.and Elangovan K., J. Envi. Sci.and Engg., 2010, 52(1), 47-52.. [2]. LeninSunder M. and Saseetharan M. K., J. Envi. Sci.and Engg., 2008, 50(3), 187-190.. [3]. Patel S. R., Physico-chemical and microbiological characterization of potable waters used in villages of Surat district, Thesis submitted to Veer Narmad South Gujarat University 2005.. [4]. American Public Health Association, Standard Methods for the Examination of Water and Wastewater, 20th edition, Washington D.C. , 1998.. [5]. Anamika, Asian J. Chem., 2008, 20(6), 4659-4663.. [6]. Narasimha Prasad N. B. and Mansoor O. A. , J. Envi. Sci. and Engg., 2005,47(4) ,69-74..
(6) R. T.Vashi et al.. J Fundam Appl Sci. 2015, 7(2), 163-168. 168. [7]. Chaudhary P., Dhakad N. K. and Parveen S., J. Env. Res. and Develop. , 2006, 1(2).. [8]. Jain S. M., Sharma M. and Thakur R., Indian Ecobiol., 1996, 8(3),181-188.. How to cite this article Shroff P, Vashi T. Seasonal variations in groundwater quality of valsad district of south Gujarat (INDIA). J Fundam Appl Sci. 2015, 7(2), 163-168..
(7)
Figure


Documents relatifs
The seasonal restitution of the areas of inundated rice and other irrigated crops from multi-temporal high resolution satellite remote sensing is thus a promising method for
The low phytoplankton biomass of open Arctic surface waters during summer 2008 could be attributed to nutrient depletion (NO 3 <0.2 µM, Si ∼ 1.0 µM, Fig. 12e) throughout the
A better estimation of present-day trends in ITV and DTR, e.g., through data homogeneization and/or detection and attribution studies [Hanlon et al., 2013; Lewis and Karoly, 2013],
Three simulations utilizing the HTAPv2, REASv2 and MACCity anthropogenic emission inventories were conducted and compared with satellite and ground-based measurements to assess
Protein and fibre concentrations, condensed tannin concentration, in vitro digestibility (enzymatic method), and dry matter (DM) and nitrogen in sacco effective ruminal
angustifolia was observed in four sites (i.e. excelsior was predominant in the others sites.. The global site decline index, hereafter called “ash dieback severity”, was computed
For calculating the WQI, groundwater samples were analyzed for seventeen physico-chemical parameters like pH, Colour, Electrical Conductivity EC, Total Hardness TH, Calcium
Class 1 applications permit users to try Internet based services without switching their primary telephony service provider.. Trialability is more important to early adopters
