HAL Id: hal-01717493
https://hal.archives-ouvertes.fr/hal-01717493
Submitted on 6 Nov 2019
HAL is a multi-disciplinary open access
archive for the deposit and dissemination of sci-entific research documents, whether they are pub-lished or not. The documents may come from teaching and research institutions in France or abroad, or from public or private research centers.
L’archive ouverte pluridisciplinaire HAL, est destinée au dépôt et à la diffusion de documents scientifiques de niveau recherche, publiés ou non, émanant des établissements d’enseignement et de recherche français ou étrangers, des laboratoires publics ou privés.
Characterization of mixing in a stirred tank by planar
laser induced fluorescence (PLIF)
A Fall, Olivier Lecoq, R David
To cite this version:
A Fall, Olivier Lecoq, R David. Characterization of mixing in a stirred tank by planar laser induced fluorescence (PLIF). Chemical Engineering Research and Design, Elsevier, 2001, 79 (A8), pp.876-882. �10.1205/02638760152721073�. �hal-01717493�
CHARACTERIZATION OF MIXING IN A STIRRED TANK
BY PLANAR LASER INDUCED FLUORESCENCE (P.L.I.F.)
A. FALL, O. LECOQ and R. DAVID
‘Laboratoire de Ge´nie des Proce´de´s des Solides Dirise´s’ – UMR CNRS 2392, Ecole des Mines d’Albi-Carmaux (E.M.A.C.), Campus Jarlard, 81013 ALBI CT cedex 09, France.
T
he mixing of two water feedstreams is investigated in a 0.02 m3continuous stirred tank,from concentration measurements. These measurements are carried out with a laser sheet in a very thin vertical plane through the vessel tangent to the impeller. The proportionality between the grey level obtained by planar laser induced èuorescence and the local concentration has been previously determined. The éelds of instantaneous concentration, temporal variance and mixing index are processed from the grey level images.
Keywords: mixing; mixing index; laser sheet; èuorescence; stirred tank.
INTRODUCTION
Solid particles obtained in industry by precipitation (reac-tion crystalliza(reac-tion) are generally produced in mechanically stirred tanks, or in jet mixers. In these processes, two liquid streams come into contact, but the process is more or less controlled.
Precipitation supersaturations originate from a chemical reaction and thus are very high1. Furthermore, the effects of
contacting and mixing conditions of reactants play an essential role on the nucleation and crystal size distribution2.
Indeed, if the mixing of both reactants is imperfect in the stirred tank, the concentration pattern will not be homo-geneous and supersaturation heterogeneities will be created. Consequently, nucleation and crystal growth rates will vary in the mixer from one point to another.
As a mixing model, the èuorescence properties of a solution mixed with pure water in a transparent tank are used, which is crossed by a planar laser sheet. During the érst moments of mixing, the mixing of the two tracers is similar to the mixing of two reagents in ionic precipitation. Indeed, there is no signiécant consumption of the reactants during the érst seconds of mixing, owing to the small size of nuclei produced and to the time scales of the crystal growth, which are much larger than those of nucleation3.
As a result, mixing in ionic precipitation can be character-ized by studying the mixing of two inert tracers, or the mixing of a single tracer in solution with pure solvent, each èuid being injected by two separate feed tubes. The laser sheet visualization method has been used by Mahouast4, and
developed in a 0.02 m3 mechanically stirred tank by
Houcine et al.5and adapted at the pilot scale by Marcant
et al.6. The laser induced èuorescence technique (L.I.F.),
which is non-intrusive like tomography7, can help to
opti-mize the geometry of the mixers, the feed rates or the positions and shape of the injectors. It is based on the stimulation of èuorescence by laser and the measurement of
the emitted light. For low tracer concentrations the èuor-escent intensity is proportional to the local concentration and to the power of the incident laser light. Previous workers have used a CCD camera4–6,8, a photomultiplier9, and a line
scan camera10. They measured the èuorescent light
inten-sity, respectively in a plane, at a point, and along a line. The planar laser induced èuorescence technique (P.L.I.F.) allows characterizing mixing in any plane crossing the èow deéned by the laser sheet. This technique is based on the èuores-cence of organic substances induced by a laser sheet and coupled with image analysis. The originality of this study, compared to previous works4–6, lies (a) in the fact that the
laser sheet is very thin (down to 100 mm); (b) the camera is much more sensitive and énally; (c) more powerful tools are used for image processing.
The aim of this paper is to describe and validate the PLIF set up designed for fast and precise characterization of contacting and mixing of one inert tracer and pure water.
MEASUREMENT TECHNIQUE AND EXPERIMENTAL SET-UP
Principle
Several organic molecules in solution, like èuoresceine or rhodamine B exhibit a èuorescence phenomenon when they are stimulated by laser light. For low tracer concentrations the intensity of èuorescence is proportional to the local concentration of tracer and to the power of the incident laser light. The èuorescence is emitted with a wavelength (about 590 nm) higher than that of the laser (520 nm). Its intensity is éltered and monitored by a high sensitive camera.
Procedure
The érst set measurements are performed to establish the grey level images in the following cases:
the tank is élled with water. It provides for the grey level éeld of the background: NGob(x, y, t);
the stirred tank is élled with a èuorescent tracer solution. Its concentration is the mixing concentration during the experiment in the completely homogeneous state Cmp. It yields the grey level éeld corresponding to the perfect mixing images;
énally, two water feedstreams (one containing the èuor-escent tracer) supply the stirred tank, yielding the grey level éeld: NG(x, y, t).
For a diverging laser sheet Houcine et al.5 derived the
relations between:
the instantaneous local concentration of tracer and the grey level NG(x, y, t) of the image:
C x; y; t NG x; y; t NGob x; y
NGCmp x; y NGob x; y Cmp 1
between the grey level NG(x, y, t), the power of laser source Poand the tracer local concentration C(x, y, t):
NG x; y; t KPoC x; y; t exp eiL eeL Cmp 2
Where NGob x; y and NGCmp x; y are the average grey
levels of the background and the perfect mixing, respectively, ei and ee are the extinction coefécients of incident laser light and emitted èuorescence light, L is the depth of penetration of the laser beam into the tracer solution, L is the optic path of the èuorescent light in the tracer solution, K is a constant grouping physical and geometrical parameters
Equation (1) takes into account the attenuation of the intensity along the optical path, approximately identical for
NGC
mp x; y; t and NG(x, y, t). Equation (2) is intended to
determine the operating conditions of tracer concentration and power favourable to obtaining a proportionality and a
great sensitivity between the grey level and èuorescent dye concentration. Thus, it was possible to determine the inten-sity of èuorescence emission as a function of:
(a) the tracer concentration: the tank is élled with different solution of homogeneous concentration, varying bet-ween 0 and 40 10 6kg m 3;
(b) the laser intensity: the tank is irradiated at Poincreasing, varying between 0 and 2 W.
Experimental
The scheme of the apparatus used in this work is shown in Figure 1. The experiments are carried out in a standard type stirred tank of 0.02 m3. The cylindrical vessel of internal
diameter T 0.29 m is placed inside a square vessel élled with water in order to reduce problems associated with refraction by curved surfaces. Both vessels are made of a transparent material of optical quality Altuglass (PMMA). Four bafèes of width T=10 and thickness T=100 are provided at intervals of 90 against the wall of the inner tank. The six-bladed Rushton turbine in Altuglass is coupled to a stainless steel shaft which has an external diameter of 10 mm. The impeller diameter and bottom clearance are equal to H=3, where H represents the height of the liquid in the tank. The other dimensions of the stirred tank are represented in Figure 2. The stirring speed is éxed at
N 110 rpm. The optical device includes a laser diode, with an emission wavelength of 520 nm and with a maxi-mum power Po 2 W. When crossing the diaphragm, the laser beam is focused by a mirror and is spread out into a very thin sheet (down to 100 mm) using a POWELL lens. A CCD camera, of total exposure time 35 ms, étted with a sharp cut-off high pass élter takes 9 images per second. It gives high resolutions down to ten micrometers, since it provides for images of 1280 1024 pixels encoded on 4096 grey levels. The camera and the laser are jointly assembled
Figure 1.Experimental set-up: (1) storage tanks; (2) feed tanks; (3) pumps; (4) valve; (5) outlet; (6) reservoirs; (7) taps; (8) èow meter; (9) feed tubes; (10) motor; (11) stirrer; (12) mixing tank; (13) laser sheet; (14) Powell lens; (15) mirror; (16) diaphragm; (17) 2 W diode-pumped laser millennia IIs (Nd: YVO4): excitation wavelength at 520 nm; (18) control module; (19) internal diode power supply; (20) displacement remote control; (21) computer; (22) displacement system; (23) processor; (24) video power supply; (25) DANTEC CCD-camera: HiSense1PIV=PLIF; (26) high-pass élter: Sharp-cut glass élter (570 nm) placed on the lens of the camera to remove reèections of the laser light from the èuorescent signal to achieve a high signal-to-noise ratio.
on a vertical and horizontal displacement system. This device is controlled by a computer with a total displacement of 0.54 m and a repeatability of 0.1 mm. Two reservoirs continuously supply the tank with equal èow rates (QA QB 1.45 10 3m3min 1) by two incoming feed tubes. The tubes have an internal diameter of 6 mm and their axis are separated by a distance of 19.2 mm. The feed point locations are at a height of 2H=3 and are situated on the tangential vertical plane to the impeller. In this plane, there is no signiécant orthogonal average velocity11. The
tracer concentration (40 10 6kg m 3) is selected in the
range of linearity between concentration and grey level (see Figure 3). The èuorescence images are recorded with FlowManager1-Dantec software and then processed in
Aphelion1-Adcis images analysis software with speciéc
developed macros.
RESULTS
Before starting the experiments in the continuous stirred tank, the range of the linear response between the grey level and the tracer concentration were determined. This was done at four points in Figure 2. It can be seen in Figure 3 that the linearity is observed up to 40 10 6kg m 3 (8.35
10 5mol m 3) with linear regression coefécient R2> 0.99
(least square method). For larger concentrations the response of the grey level becomes non-linear because of the expo-nential term of the equation (2). This result is in agreement with those obtained by Houcine et al.5, who used a laser
power of 1.4 W. The linear response between the laser and èuorescence intensity is given on the Figure 4 (linear regression coefécient R2>0.99). In the range of
Figure 2.Mixing tank.
the tracer concentration (0–40 10 6kg m 3) and in the
laser power range (0–2 W), there are no saturation problems. An example of the instantaneous dye concentration éeld is shown in Figure 5 for the case of a continuously fed tank reactor: èuorescent tracer injected at 40 10 6kg m 3 appears white, whereas pure water appears black. The mean concentration éeld CC x; y is obtained by averaging
a number n 100 of successive instantaneous concentration éelds C(x; y; t). The reduced concentration CC x; y = C
Cmp x; y , Figure 6, represents the relative deviation to
perfect mixing. Along a line AB (see Figure 6), the ratio varies between 0 (black) and 2 (white): Figure 7, corre-sponding to the feed stream of water and èuorescent tracer, respectively. Perfect mixing is reached for the value 1.
The temporal variance is expressed by the following equation: s2x; y; t 1 n n k 1 C x; y; t CC x; y 2 3
This equation characterizes the mixing dynamics. Figure 8 shows the éeld of the temporal variance corresponding to the mixing layers of both jets. A white area means high variance, while black means low variance. The persistence of two zones of intensive mixing can be observed around the injection cones at the exit of the feed point locations. The rest of the tank is well homogenized. There is almost no deviation of concentration from the mean.
All the previously shown éelds characterize different aspects of the mixing process from the tracer concentration éeld. It is also interesting to have comparison tools to study various mixing situations. Thus, a mixing index is deéned. In the case of two species A and B, Ablitzer12proposed:
aAB x; y; t 1
CA x; y; t CB x; y; t
CA x; y; t CB x; y; t 4
In the case of a tracer water solution (A) and pure water (B), the equation (4) becomes (see appendix), with the tracer concentration CA(x, y, t):
Figure 4.Grey level variation with laser intensity.
Figure 5.Instantaneous concentration éeld C(x, y, t).
aAB x; y; t 1
CAx; y; t CA0
CA x; y; t 2 f 1 CA0 5
where: ff QB= QA QB
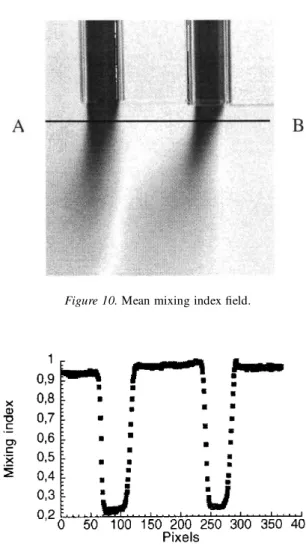
Examples of the instantaneous and average mixing index éelds are shown in Figures 9 and 10, respectively. This index varies from 0 (black), in the feed streams jets corresponding to no contact up to a value close to 1 (white) in the rest of the tank. Figure 11 illustrates the evolution of this contacting parameter along the straight line AB (shown in Figure 10).
CONCLUSION
This work describes a powerful non-intrusive technique based on the èuorescence spectroscopy using a very thin static laser plane (down to 100 mm). The technique is validated for the case of a standard stirred tank reactor of 0.02 m3volume, continuously fed with a tracer solution and
pure water. Images of instantaneous and average concentra-tion, éelds of temporal variance, and mixing index are very precise and illustrate the investigative power and resolution of the PLIF technique. Thus, this device can be used to study contacting and mixing èuid patterns. This will allow, the study of inèuence of parameters, like feed rate13, feed
position in the tank, and also allow more sophisticated mixing devices to be characterized.
APPENDIX
The aim of this appendix is to derive the mixing index a (given by equation (5)) in this case, from the one deéned by Ablitzer12.
Consider the mixing of two inert tracers, without consumption, shown in Figure A1. If f represents the instantaneous fraction of molecule coming from the inlet B, at point M of coordinates (x, y), the instantaneous concentrations of species A and B are respectively:
Figure 7.Reduced concentration variation along a line AB (in Figure 6).
Figure 8.Field of the instantaneous temporal variance s2x; y; t :
Figure 9.Instantaneous mixing index éeld.
Figure 10.Mean mixing index éeld.
CA CA0 1 f A1 and:
CB CB0f A2
Thus, at the outlet:
CA0 CA0 1 f A3
CB0 CB0f A4
where
f QB
QA QB A5
In the case of stoichiometry:
QACA0 QBCB0 A6
When equation (A6) is divided by QA QB; it becomes:
CA0 1 f f CB0 A7
Addition of equations (A1) and (A2) leads to:
CA CA0 CB CB0 1 A8 averaging gives: CA CA0 CB CB0 1 A9
For two species A and B, Ablitzer12proposed the following
mixing index:
aAB 1
CA CB
CA CB A10
Taking into account the equation (A8), gives:
aAB 1 CA CB0 1 CA CA0 CA CB0 1 CA CA0 A11
When CB0is substituted from equation (A7), equation (A11) leads to: aAB 1 CA CA01 f f 1 CA CA0 CA CA01 f f 1 CA CA0 A12
After simpliécation, equation (A12) becomes:
aAB 1
CA 1 f CA0
CA2 f 1 CA0 1 f A13
Finally taking into account equation (A3), gives: aAB 1
CA CA0
CA2 f 1 CA0 A14
NOMENCLATURE
C local concentration of the èuorescent dye, mol m 3
CX tracer concentration in the feedstream X mol m 3
CX0 concentration coming in the feedstream X at outing of the tank, mol m 3
CX0 initial concentration in the feedstream, mol m 3
Cmp tracer concentration in the stirred tank in the completely
homo-geneous state, mol m 3
NG grey level
Po power of the laser source, W
ei, ee extinction coefécient of incident laser light and emitted
èuor-escence light, m2mol 1
K constant taking into account physical and geometrical para-meters
L depth of penetration of the laser beam into the tracer solution, m
L optic path of the èuorescent light in the tracer solution, m
QX feed rate of feedstream X entering the tank, m3s 1
(x, y) pixel coordinates, m, m
t time, s
REFERENCES
1. Villermaux, J. and David R., 1988, Effet du microme´lange sur la pre´cipitation, Journal de Chimie Physique, 85(2): 273–279.
2. Marcant, B. and David, R., 1991, Experimental evidence for and prediction of micromixing effects in precipitation, AIChE J, 37(11): 1698–1710.
3. David, R. and Marcant, B., 1994, Prediction of micromixing effects in precipitation: Case of double-jet precipitators, AIChE J, 40(3): 424–432. 4. Mahouast, M., 1993, Mesure des champs de concentration et de temperature dans un re´acteur agite´ par traitement des images de la èuorescence induite par une nappe laser, Re´cent Progre`s en Ge´nie des
Proce´de´s, 24: 57–60.
5. Houcine, I., Vivier, H., Plasari, E., David, R. and Villermaux, J., 1996, Planar laser induced èuorescence technique for measurements of concentration éelds in continuous stirred tank reactor, Experiments in
Fluids, 22: 95–102.
6. Marcant, B., Seidlitz, F., Plasari, E. and Villermaux, J., 1997, Direct measurement of the generalized mixing model parameters by laser sheet visualization, Re´cent Progre`s en Ge´nie des Proce´de´s, 11(51): 349–356. 7. Buchmann, M. and Mewes, D., 1998, Measurement of the local intensities of segregation with the tomographical dual wavelength photometry, Can J Chem Eng, 76: 626–630.
8. Van Cruyningen, I., Lozano, A. and Hanson, R. K., 1990, Quantitative imaging of concentration by planar laser-induced èuorescence,
Experi-ments in Fluids, 10: 41–49.
9. Gaskey, S., Vacus, P., David, R., Villermaux, J. and Andre´, J. C., 1990, A method for study of turbulent mixing using èourescence spectroscopy,
Engineering in Fluid, 9: 137–147.
10. Distelhoff, M.F.W. and Marquis, A. J., 2000, Scalar mixing in the vicinity of two disk turbines and two pitched blade impellers, Chem Eng
Sci, 55: 1905–1920.
11. Kemoun, A., 1995, Caracte´risation Expe´rimentale de la structure de
l’e´coulement dans une cuve agite´e: Me´lange, PhD Thesis (INPL, Nancy, France).
12. Ablitzer, C., 1999, Etude de la Formation de Poudre Dans des Jets
coaxiaux re´actifs, PhD Thesis (INPG, Saint-E´tienne, France).
13. Fall, A., Lecoq, O. and David, R., 2001, Variation of the feed location and impeller speed in a stirred tank using Planar Laser Induced Fluorescence (P.L.I.F.), Re´cents Progre`s en Ge´nie des Proce´de´s, 15: 25–32.
ADDRESS
Correspondence concerning this paper should be addressed to R. David, Ecole Mines Albi-Carmaux, Campus Jarlard, Route de Teilet, 81013 Albi, Cedex 09, France. E-mail: rene.david@enstimac.fr