1
Effect of pH on glucose and starch fermentation in batch
1and sequenced-batch mode with a recently isolated strain
2of hydrogen-producing Clostridium butyricum CWBI1009
34
Julien Masset
a*, Serge Hiligsmann
a, Christopher Hamilton
a, Laurent
5Beckers
a, Fabrice Franck
b, Philippe Thonart
a 6a Walloon Centre of Industrial Biology, B40 – P70, University of Liege, 4000 Liege, Belgium 7
b
Laboratory of Vegetal Biochemistry, B22, University of Liege, 4000 Liege, Belgium
8 9 *Corresponding author: 10 Tel.: +32 43663999 11 fax: +3243662862 12
E-mail address: j.masset@ulg.ac.be 13
14
15
*Manuscript- revised version
2 Abstract
16
This paper reports investigations carried out to determine the optimum culture conditions for 17
the production of hydrogen with a recently isolated strain Clostridium butyricum CWBI1009. 18
The production rates and yields were investigated at 30 °C in a 2.3 l bioreactor operated in 19
batch and sequenced-batch mode using glucose and starch as substrates. In order to study the 20
precise effect of a stable pH on hydrogen production, and the metabolite pathway involved, 21
cultures were conducted with pH controlled at different levels ranging from 4.7 to 7.3 22
(maximum range of 0.15 pH unit around the pH level). For glucose the maximum yield (1.7 23
mol H2 mol-1 glucose) was measured when the pH was maintained at 5.2. The acetate and 24
butyrate yields were 0.35 mol acetate mol-1 glucose and 0.6 mol butyrate mol-1 glucose. For 25
starch a maximum yield of 2.0 mol H2 mol-1 hexose, and a maximum production rate of 15 26
mol H2 mol-1 hexose h-1 were obtained at pH 5.6 when the acetate and butyrate yields were 27
0.47 mol acetate mol-1 hexose and 0.67 mol butyrate mol-1 hexose. 28
29
Keywords: Clostridium butyricum; starch; hydrogen production; pH; batch; sequenced-batch
3 31
1. Introduction 32
Dependence on fossil fuels as our primary energy source is a significant cause of global 33
warming, environmental degradation, and health problems [1, 2]. Hydrogen (H2) is a 34
promising energy vector for the future since CO2 is not released during its combustion [3-5]. 35
At present hydrogen is produced by chemical methods, such as steam reforming or partial 36
oxidation of fossil fuels, which involve the release of large quantities of greenhouse gases into 37
the atmosphere. Biological hydrogen production by "dark-fermentation" of organic waste or 38
effluent is a promising means of producing renewable energy from waste products [6]. The 39
main means of producing hydrogen via dark-fermentation involve either facultative anaerobic 40
enterobacteriaceae or strict anaerobic bacteria of the geni Clostridium and Ruminococcus. 41
Enterobacteriaceae use formate, an intermediate of glucose metabolism, to produce hydrogen 42
through catalytic action of the formate hydrogen lyase complex with a theoretical yield of two 43
mol of hydrogen per mol of glucose consumed. The alternative metabolic pathway involving 44
strict anaerobic bacteria has a maximum yield of four mol of hydrogen per mol of glucose [4]. 45
Clostridia can extract energy from carbohydrates using various different metabolic pathways 46
which are promoted or inhibited by the prevailing culture conditions. Each pathway is 47
characterized by a specific metabolite such as acetate, butyrate, ethanol, lactate or formate. 48
The acetate and butyrate pathways are the only ones which involve the release of molecular 49
hydrogen, i.e. 4 mol hydrogen per mol glucose with acetate production and 2 mol hydrogen 50
per mol glucose with butyrate production. Thus the butyrate/acetate ratio can be used as a 51
reliable indicator of the efficiency of fermentative hydrogen production and of the metabolic 52
pathways used during glucose fermentation [7]. 53
4 Although the Clostridium genus is promising for fermentative hydrogen production, few 54
investigations have used pure strains to make a detailed study of the optimal conditions for 55
hydrogen production [8-11]. 56
Many authors have reported that initial pH has a marked effect on hydrogen production from 57
carbohydrate substrates. However, since most of these studies investigated mixed cultures of 58
microorganisms or pure cultures without pH control, little is known about the precise impact 59
of a stable pH on the metabolic pathways and hydrogen production rates and yields of specific 60
strains. Various studies have indicated that the optimal pH for the degradation of simple 61
substrates is between 4.5 and 7 [8, 10, 12-18]. In the investigations reported here a pure 62
Clostridium butyricum strain was cultured in a 2.3 l bioreactor at different controlled pH
63
levels. The hydrogen production rate and yield and the proportions of the soluble products 64
resulting from the fermentation of glucose and starch were studied. In addition the bioreactor 65
was operated in batch and sequenced-batch mode in order to study the effect of a large 66
inoculum and inhibition by metabolites such as volatile fatty acids (VFA) or alcohols. 67
68
2. Materials and Methods
69
70
2.1. Media and reactor setup 71
72
To ensure a viable culture for a long time, 1 ml of culture was transferred weekly in 25 ml 73
hermetically stoppered tubes completely filled with sterile MDT medium and incubated at 30 74
°C. The MDT medium contained, per litre of deionised water : glucose monohydrate (5 g), 75
casein pepton (5 g), yeast extract (0.5 g) Na2HPO4 (5.1 g), KH2PO4 (1.2 g), MgSO4.7H2O (0.5 76
g), cysteine hydrochloride (0.5 g). 77
5 The PCA (Plate Count Agar) medium for the aerobic purity check contained, per litre of 78
deionised water : glucose monohydrate (1 g), casein pepton (5 g), yeast extract (2.5 g), agar 79
(15 g). 80
Pre-cultures for bioreactor experiments were obtained by transferring 5 ml of inoculum into 81
250 ml serum bottles with 200 ml of sterile MDT medium, degassed with nitrogen, and 82
incubated for 24 hours at 30 °C. 83
Batch and sequenced-batch fermentations were carried out in a laboratory-scale bioreactor 84
(Biolafitte manufacture) composed of a 2.3 l glass vessel with double envelope and a 85
stainless-steel lid equipped with septum, shaft with blades, 0.20 µm (Midisart, Sartorius) gas 86
filters and tubing for sampling, gas inlet, gas outlet and medium removal or addition. The 87
bioreactor containing 1.5 l of water and the ingredients for the MDT medium (except cysteine 88
and glucose) was autoclaved at 120 °C for 20 minutes, and then cooled under nitrogen gas, 89
prior to injection of 200 ml of the inoculum. Autoclaved cysteine and glucose solutions were 90
added sterilely during inoculation. Needles placed through the septum were used to control 91
the pH level (METTLER TOLEDO combined probe) by automatic addition of sterile 1.5 N 92
sodium hydroxide (maximum range of 0.15 pH unit around the pH level). During 93
fermentation the bioreactor was maintained at 30 ° C and stirred at 60 rpm. 94
95 96
2.2. Isolation and identification test 97
The strain was isolated from a culture in serum bottles with MDT medium in which glucose 98
had been replaced by non-sterile rice starch for laundry (Remy, Belgium). The additional 99
inoculum provided by this substrate led to high H2 production. The culture at the completion 100
of gas production was treated at 80 °C for 10 min. One ml of inoculum was successively 101
diluted in 25 ml stoppered glass tubes containing 24 ml of sterile TSC (Tryptose Sulfite 102
6 Cycloserine) agar medium (Merck) and maintained in molten state at 43 °C. This medium 103
was used in order to grow isolated colonies in anaerobic conditions. The tubes were closed 104
hermetically and then incubated at 30 °C. After one week the tubes were broken at convenient 105
points in order to sample black colonies (due to precipitation of iron sulfide). Single colonies 106
were selected and placed in a 5 ml tube containing the liquid TSC culture medium for 3 days 107
and then transferred to 250 ml serum bottles for BHP (Biochemical Hydrogen Potential) tests 108
[7]. Since the hydrogen production by the different samples was similar, i.e. 132 ± 11 ml, the 109
cultures were considered to contain pure strains. Strain identification was carried out by 110
examination under a transmitted light microscope (Olympus, CH-2) and by 16S rDNA/ITS 111
(Internal Transcribed Spacer) gene sequencing. The genomic DNA was extracted from the 112
cells using the Promega extraction kit (Madison, USA) and the 16S rDNA and ITS gene were 113
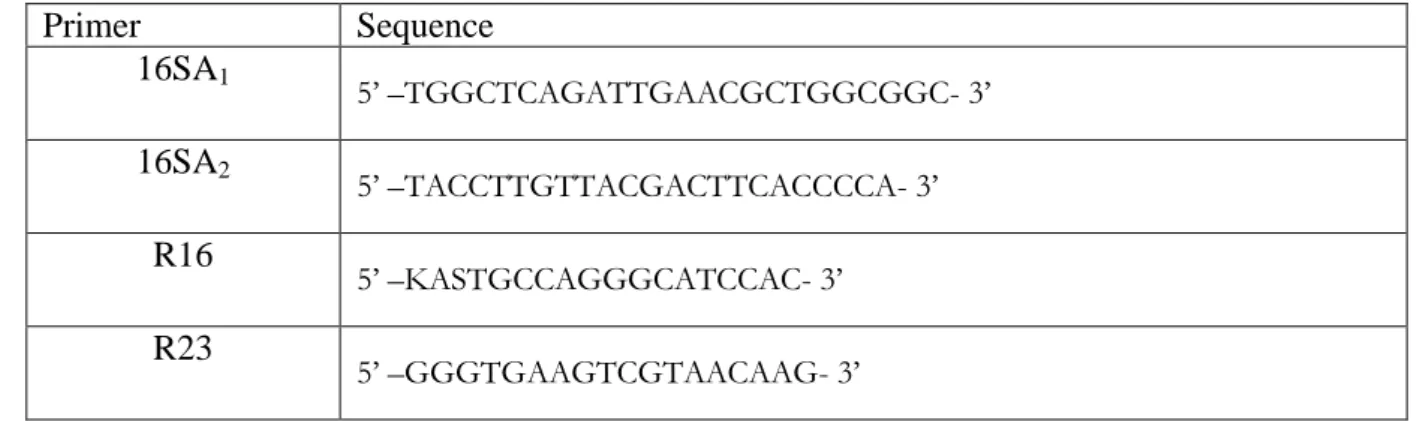
amplified by PCR. Bacterial cell lysates were used to amplify the 16S rDNA Eurogentec 114
(Seraing, Belgium) primers 16SA1 and 16SA2 (Table 1) under the following temperature 115
profile: initial denaturation at 95 °C during 5 min, followed by 25 cycles with denaturation at 116
95 °C for 30 sec, annealing at 55 °C for 30 sec and elongation at 72 °C for 2 min. For ITS 117
universal bacterial primers R16 and R23 from Eurogentec (Seraing, Belgium) (Table 1) were 118
used under the following temperature profile: initial denaturation at 95 °C during 5 min, 119
followed by 30 cycles with denaturation at 95 °C for 1 min, annealing at 50 °C for 1 min and 120
elongation at 72 °C for 2 min. Amplification of 16S rDNA was performed in a volume of 50 121
µl containing: 5 µl of bacterial genomic DNA solution obtained as above, 5 µl of 10 x PCR 122
reaction buffer (50 mM KC1, 10 mM Tris-HCl (pH 9 at 25 °C), 0.5 % (w/v) triton® X-100), 123
1 µl of each dNTP (Deoxynucleotide triphosphates) 10 µM, 5µl of MgC12 25 mM, 1 µl of 124
each primer 10 µM and 0,2 µl of Taq polymerase (Promega). The PCR products obtained in 125
this way were purified with the Microcon® YM-100 (Millipore) Kit. Sequences were 126
7 determined by ABI Prism BigDye Terminator v3.1 Cycle Sequencing kit (Applied 127
Biosystems). 128
129 130
The ARDRA (Amplified Ribosomal DNA Restriction Analysis) test was carried out by 131
restriction digestion of the amplified 16S rDNA and the ITS rDNA fragments for 1 h at 37 °C 132
in 20 µl reaction mixture containing 15 µl of the PCR product solution, 2 µl of incubation 133
buffer and 15 U of one of the following restriction enzymes, EcoRI, CfoI, MboI, AccII 134
(Eurogentec). Restriction digests were subsequently analysed by 2 % (w/v) agarose gel 135
electrophoresis. The gel was stained in a solution containing ethidium bromide and 136 photographed in UV light. 137 138 2.3. Analytical methods 139
Cell concentration was determined by microscopic observations on a Bürker counting 140
chamber (mean of 10 counts) after dilution and cell settlement in a 0.4 % (final concentration) 141
fresh formaldehyde solution. 142
Absence of aerobic contaminants during fermentation was verified by spreading 0.1 ml of 143
culture on PCA medium plates and incubating for 48h at 30 °C. The absence of bacterial 144
growth confirmed the absence of aerobic contaminants. 145
Collected liquid samples were centrifuged at 13000 g for 10 min and the supernatants 146
obtained were filtered through a 0.2 µm cellulose acetate membrane (Minisart Sartorius) and 147
analysed by HPLC for glucose, ethanol, lactate, acetate, formate and butyrate. The HPLC 148
analysis was carried out using an Agilent 1110 series (HP Chemstation software) with a 149
Supelcogel C-610H column preceded by a Supelguard H pre-column (oven temperature 40 150
°C), 0.1 % H3PO4 (in milliQ water) as the isocratic mobile phase at a flow rate of 0.5 ml min-1 151
8 and a differential refraction index detector (RID, heated at 35 °C). The process lasted for 35 152
min at a maximum pressure of 60 bars. The data for the glucose and metabolite concentrations 153
were used to calculate the mass balance (MB) of the glucose conversion using the equation: 154
155
where Ni is the number of carbon atoms in a molecule of metabolite i; ∆Ci is the concentration 156
of metabolite i effectively produced (i.e. the difference between the final and initial 157
concentrations for a given culture sequence); NG is the number of carbon atoms in the glucose 158
molecule (i.e. 6) and ∆CG is the concentration of the glucose consumed during the culture 159
sequence (Eq.(1)). 160
The proportion of hydrogen gas was determined using a gas chromatograph (GC) (Hewlett-161
Packard 5890 Series II) fitted with a thermal conductivity detector (TCD) and a 30 m x 0.32 162
mm GAS PRO GSC capillary column (Altech) in series with a 20 m x 0.25 mm CarboPLOT 163
P7 column (Chrompak). The temperatures of the injection, TCD chambers and the oven were 164
maintained at 90°, 110° and 55 °C respectively. Nitrogen was used as the carrier gas in the 165
column at a flow rate of 20 mL min-1. Water supplemented with 9 N KOH was used in 166
replacement equipment to monitor the biogas production of the batch and sequenced-batch 167
bioreactors. 168
169
3. Results and discussion
170 171
3.1. Isolation and identification of the hydrogen-producing strain
172
The strain was isolated following the isolation procedure described in Material and Methods. 173
The bacteria were mobile and rod shaped and approximately 0.5-2 x 2.5-8 µm in size. Long 174
filaments were occasionally present. Endospores, when observed, were central or 175
9 subterminalis as described in Bergey’s Manual of Systematic Bacteriology[19]. The bacteria 176
grew anaerobically in presence of organic carbon source and produced hydrogen in presence 177
of carbohydrates. To further characterize the strain, sequencing of the 16S rDNA and ITS was 178
carried out (accession number in Genbank GU395290). The sequences obtained were 179
compared with others available using Gene Runner® and the strain was identified as 180
Clostridium butyricum. ARDRA genotyping of the 16S rDNA was also performed and
181
confirmed the identification. The strain is kept at -80 °C in the laboratory culture collection. 182
183
3.2. Determination of optimal pH for H2 production from a glucose substrate in
184
batch reactor mode 185
The effect of pH on fermentative H2 production by the pure Clostridium butyricum strain was 186
investigated in a 2.3 l batch bioreactor equipped with pH regulation (as described in Materials 187
and Methods). Tests were conducted at eight different pH levels ranging from 4.7 to 7.3 while 188
keeping other operating conditions constant (stirring, temperature, pressure, initial culture 189
medium). The test at pH 5.2 ± 0.15 provided the most promising results: figure 1 illustrates 190
the related profiles for the intake of the glucose substrate and the production of hydrogen, 191
VFA and ethanol. The results show that the various VFAs and H2 are all primary metabolites 192
of the glucose intake. Similar profiles of the first order were recorded at 4.85±0.1 and 5.4±0.1. 193
194
The hydrogen production rates, plotted against time, for the eight different pH tests are 195
indicated in figure 2. A lag phase of about 3 to 5 hours was observed at all pH levels. 196
Subsequently the production rate increased exponentially reaching a maximum level which 197
was maintained, for all the tests except those at pH 6.3 and 6.7, until substrate depletion. 198
10 In figure 3 maximum H2 production yields are indicated for different pH conditions with the 200
related final VFA and ethanol concentrations. The maximum hydrogen production yield and 201
production rate, i.e. 1.69 mol H2 mol-1 glucose or 211 ml H2 g-1 glucose and 9.59 mmol H2 h-1 202
or 126 ml H2 h-1 l-1 respectively, were obtained at a pH of 5.2. These optimum pH and yields 203
are in accordance with other studies with pure or mixed cultures [13, 15, 20-22]. Since at this 204
pH level butyrate and acetate concentrations also peaked, overall performance for the process 205
was at a maximum. 206
Ethanol was released at lower amounts than the other metabolites. At pH levels below 6 207
ethanol production tended to occur during the stationary growth phase as already noted by 208
other authors [23, 24]. Therefore the negligible amounts of ethanol production in these 209
experiments indicate that the Clostridium population consisted mainly of vegetative cells. 210
For all the pH levels investigated the final concentrations of lactate, acetate and butyrate were 211
in relatively narrow ranges, i.e. 8±1.5; 10.5±1.8 and 15±2 mM respectively. However formate 212
production increased from 6 mM to 31 mM with pH rising from 4.7 to 7.3. Although Wang et 213
al [25] obtained similar hydrogen and total VFA yields with a C. butyricum strain in a 1.5 l
214
bioreactor with pH maintained at 6.5, the main metabolite they analysed was lactate (60 mM), 215
followed by acetate (22 mM) and then butyrate (15 mM). Similar results for ethanol and VFA 216
concentration ranges at different pH levels were reported by Chen [21] with acetate as the 217
main metabolite followed by butyrate and ethanol. 218
219
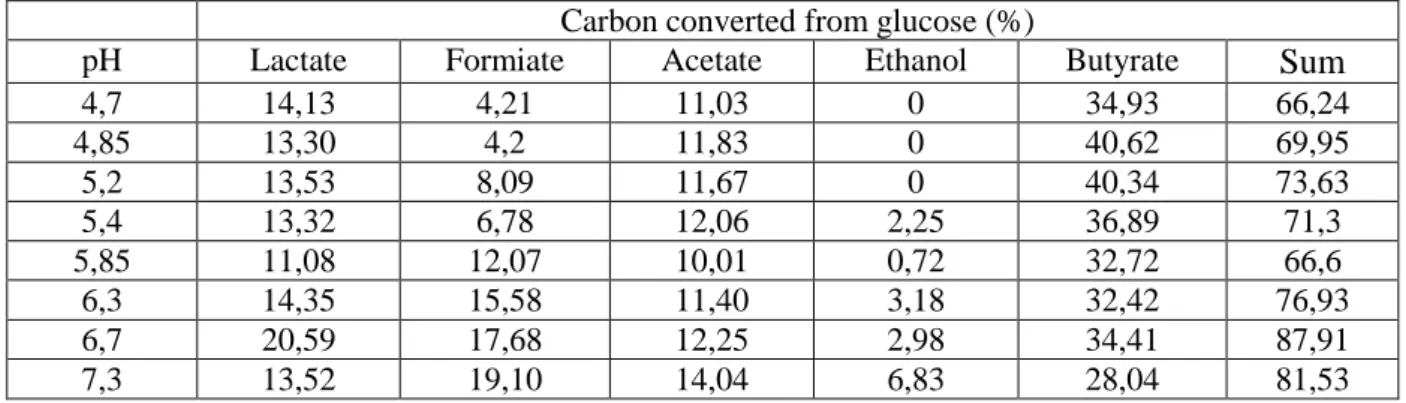
As shown in Table 2, the mass balance of glucose conversion into soluble metabolites is 220
limited to 70% ± 3% for the cultures carried out at pH levels below 6. This indicates that 221
about 30% of the glucose is converted into CO2 and biomass. Assuming a mean 35% CO2 222
content in the biogas [26], the CO2 contribution in the mass balance would be about 13%. 223
11 Therefore the biomass yield would account for 17% of the glucose consumed. Similar results 224
were obtained at pH levels higher than 6, in which the mass balance reached about 80% and 225
the CO2 contribution was estimated to be 5 %. These results are in accordance with the 12% 226
calculated from Wang’s data [25]. In addition biomass stabilisation was also apparent during 227
our experiments from the counts on a Bürker chamber : at the end of the cultures the biomass 228
population ranged, independently of pH, from 1.2 x10⁸ to 2.5 x 10⁸ cells per ml. 229
In the glucose metabolic pathways ethanol, formate and lactate productions indicate a lack of 230
potential hydrogen production. Therefore the potential for additional H2 production can be 231
stoichiometrically estimated from the quantity of metabolite that was not converted in the 232
bioreactor [27], e.g. for lactate, 850 mL at pH 5.2 and 1200 mL at pH 6.7. Investigations into 233
ways of realizing this potential would advance the prospects for industrialization. 234
235
3.3. Investigation of H2 production from glucose in sequenced-batch reactor mode
236
Industrial application of this biological process requires the use of a continuous or sequenced-237
batch mode. Therefore a sequenced-batch reactor (SBR) mode was investigated in order to 238
optimize the process by testing different culture conditions while using the same methodology 239
as described above for the batch tests. The SBR mode was studied at pH 5.2 ± 0.15 after 240
running the culture in batch mode under the same conditions. A former series of tests 241
involved a simple addition of 5g of glucose at the end of the batch culture. Since no further 242
hydrogen was produced under these conditions, even at pH 4.85 and 5.3, the results are not 243
reported here. Additional hydrogen production only took place when the pH level was 244
increased to 7. A second series of experiments involved 4 sequences of removal-addition of 245
20 % (450 ml) of the culture medium and addition of glucose up to the standard initial 246
concentration, i.e. 5 g l-1 glucose monohydrate. These 4 sequences followed the batch culture 247
12 and each sequence was started after complete depletion of the glucose added previously. 248
Finally a third series of 3 sequences was carried out with removal-addition of 40 % of the 249
culture medium and, as before, addition of glucose monohydrate to 5g l-1. 250
Mean values were calculated for the H2 production rates and yields during the active period of 251
each series, i.e. while hydrogen production was effective. The results of the 8 sequences, 252
including the batch culture (referred to as sequence 1), are shown in figures 4. Sequence 1 253
achieved similar results to those mentioned in figure 1. The duration of the active period when 254
H2 production was effective increased progressively from sequence 1 through sequence 5 255
going from 26 hours to 36, 48, 71, and finally 74 hours. So although the mean H2 production 256
yield did not change markedly, the production rates decreased sharply. By contrast the 257
conditions tested in sequences 6 to 8 were favourable for H2 production since the active 258
period stabilized at about 46 h. Also H2 production rates increased again reaching levels 259
similar to those measured during sequence 1 and yields increased by about 50 %. The 260
maximum yield, i.e. 2.3 mol H2 mol-1 glucose, was twice as high as the yield per mole hexose 261
reported by Chen et al. [21] in SBR with a sucrose substrate. 262
263
The major cause for the decrease of production rate would be VFA inhibition. In fact as 264
indicated in figure 4, the total VFA concentration measured at the end of sequence 5 was 265
twice as high as the value measured after the batch culture (sequence 1). The increase can be 266
mainly attributed to acetate and butyrate release that approaches a total of 90mM. The results 267
are consistent with the conclusions of Wang [25] who investigated the inhibitory effect of 268
metabolites on fermentative H2 production in mixed cultures. They showed that performance 269
tends to decrease with increasing ethanol and VFA concentrations. Moreover acetate had the 270
13 highest inhibitory effect since H2 production rate and yields dropped by 50% when the initial 271
concentration was increased from 50 to 100 mM and from 100 to 200 mM, respectively. 272
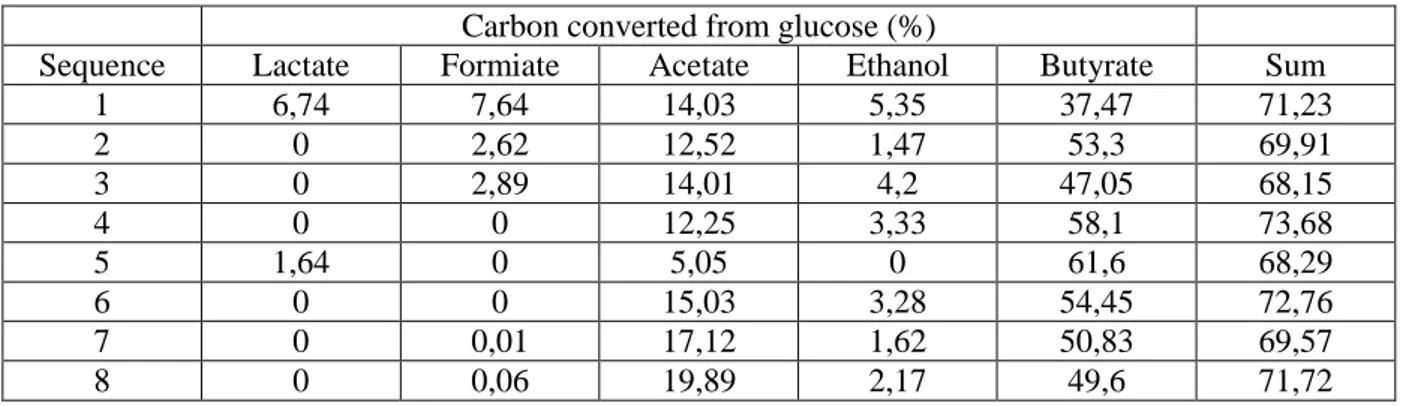
To better understand how each sequence contributed to the production of VFAs and ethanol, 273
the mass balance of glucose conversion into metabolites has been plotted in Table 3. The 274
results show a similar 70% level for all sequences meaning that biomass formation is 275
stabilized. In addition the metabolite distribution analyzed for sequences 1 to 5 confirms the 276
literature trends since both increasing of acetate and butyrate initial concentration induced 277
change in metabolite distribution with decrease of acetate proportion and increase of butyrate 278
proportion [25]. The trends are less obvious in sequences 6 to 8 where acetate and butyrate 279
production correlate with the related metabolite concentrations in culture medium. It should 280
be noted that the higher H2 production performance observed in sequences 7 and 8 are related 281
to higher butyrate and acetate yields and a lower butyrate/acetate ratio. These results are in 282
close agreement with metabolic studies reporting higher H2 yields with the acetate pathway. 283
284
3.4. Effect of pH on H2 production from starch in sequenced-batch reactor mode
285
Many industrial activities involve the discharge of large volumes of effluent loaded with 286
starch. Yokoi has shown the feasibility of producing H2 from starch using Clostridium strains 287
in association with an Enterobacter strain [28, 29]. More recently Chen studied H2 production 288
from starch using pure strains of C. butyricum and C. pasteurianum and mixed cultures [9]. 289
They achieved higher H2 yields with pure C. but. strains. However pH was not controlled 290
(initial pH was 7.5) and H2 production rates were low compared to those of mixed cultures. In 291
our investigations C. but. was cultured in a 2.3 l SBR with soluble starch as the sole 292
carbohydrate source (starch concentration calculated as half the COD of the glucose added in 293
MDT medium in order to avoid starch settlement during sterilization). Then using the 294
14 previous methodology a batch culture with glucose was followed by four sequences carried 295
out successively at pH 5.2, 5.4, 5.6 and 5.8. The hydrogen production yields, presented in 296
figure 5, are similar to those indicated for sequences 7 and 8 in figure 4. The optimal pH level 297
for hydrogen production from starch by Clostridium butyricum CWBI1009, as well as the 298
optimal pH for H2 production from glucose, are comparable to those found in the literature 299
and vary depending on the substrate [9-11]. By comparison with the yields recorded for the 300
glucose substrate, the H2 yields for the starch substrate seem less affected by pH than those 301
for the glucose substrate. By contrast the H2 production rate from starch decreased sharply at 302
pH levels below 5.6. Moreover, at this optimal pH the hydrogen production rate was about 5 303
times lower than that recorded for glucose substrate. These results highlight the impact of pH 304
on starch hydrolysis and are consistent with the work of Chen showing that the activity of 305
amylases strongly decreases when the pH is close to 5 [30]. Therefore it seems reasonable to 306
suggest that starch hydrolysis could be the rate-limiting step for H2 production and that pH 5.6 307
is optimum for the overall enzymatic and metabolic kinetics. This is in close agreement with 308
earlier works [18, 31, 32]. 309
310 311
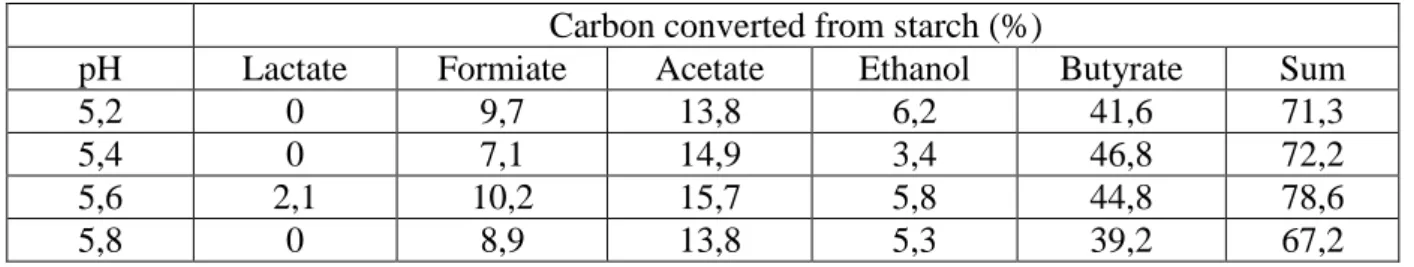
The metabolites released during each sequence at different pH levels are shown in figure 5 312
and the carbon balance in Table 4. When determining the VFA concentrations at the end of 313
starch fermentation, maximum acetate (6mM) and butyrate (8.3mM) concentrations were 314
observed at pH 5.4. It was also at this pH level that lactate (0mM), formate (4.9mM) and 315
ethanol (1.4mM) were at their lowest concentration. Likewise for H2 production from glucose 316
substrate (sequences 7 and 8 in table 4), butyrate and acetate are the major metabolites and 317
about 70 % of the starch is converted into VFAs or ethanol . Whereas lactate and formate 318
were not produced with the glucose substrate at optimal pH, 10 % of the starch was converted 319
15 into formate whatever the pH level. The butyrate/acetate ratio, i.e. about 1.3, mentioned by 320
Chen et al. [9] is similar to those calculated from the data in figure 5, but it was lower than 321
those obtained during the glucose fermentation (1,8). In addition they also analyzed propionic 322
and valeric acids that were not detected in our cultures. 323 324 325 326 4. Conclusions 327
In this study the strain Clostridium butyricym CWBI1009 was characterized as a new 328
hydrogen-producing strain and some culture conditions (pH, substrates and operation mode) 329
were optimized to maximize production of hydrogen. The first step was to determine the 330
optimal pH for cultures using glucose or starch as the substrate. The results confirm that low 331
pH variations caused large variations in the activity of hydrogenases and metabolic pathways 332
[14, 33]. For glucose the maximum yield (1.7 mol H2 mol-1 glucose) was measured at pH 5.2. 333
For starch a maximum yield of 2.0 mol H2 mol-1 hexose and a maximum production rate of 15 334
mol H2 mol-1 hexose h-1, were obtained at pH 5.6 These results are relevant to the prospects 335
for using effluents from agro-food industries as an organic substrate for fermentative H2 336
production. However since such effluents often contain various different substrates, 337
determining and maintaining an optimum intermediate pH level will be crucial to achieve 338
efficient fermentation of the substrate mixture. For instance a sharp decrease (80%) in the 339
hydrogen production rate for starch occurred when the pH decreased from 5.6 to 5.2, while 340
the yield only declined by 14%. 341
Carrying out the investigations with a pure strain at various different controlled pH levels 342
while tracking all the potential metabolites (i.e. formate, acetate, ethanol, lactate and 343
butyrate), provided a better understanding of the metabolic pathways involved and the factors 344
16 affecting them. The results highlight the important role of parameters such as pH, the nature 345
of the carbohydrate substrate, the growth phase, VFA concentrations and inoculum. Indeed 346
for instance, significant differences in metabolite distribution have been evidenced by 347
comparing our results and those of Wang [25] obtained with another Clostridium butyricum 348
strain cultured under similar conditions. In our experiments H2-producing glucose 349
fermentation at optimum pH 5,2 released acetate and butyrate at respectively 11.2 and 17.1 350
mM meaning that about 12 % and 40 % of the initial glucose carbon content were converted 351
in these compounds, respectively. Bearing this in mind tests in a sequenced-batch bioreactor 352
were designed to promote the metabolic pathways which release butyrate and acetate, since 353
these pathways are the only ones producing H2 from carbohydrates.As a result, a 50 % 354
increase in H2 yield was obtained with removal-addition of 40 % of the culture medium and 355
15 % more glucose was converted in acetate and butyrate. In conclusion an analysis of the 356
mass balance of the various metabolites converted from the carbohydrate substrate should be 357
considered in any future studies. 358
359
5. Acknowledgements
360
J. Masset et S.Hiligsmann contributed equally to the paper. J. Masset is recipient of a FRIA 361
fellowship (Fonds de la Communauté française de Belgique pour la Formation à la Recherche 362
dans l’Industrie et l’Agriculture) and L. Beckers is recipient of a FRS-FNRS fellowship, 363
(Fonds de la Recherche Scientifique). F. Franck is senior research associate of the FRS-364
FNRS. This work was also supported by an ARC project (Action de Recherches Concertées 365
ARC-07/12-04) and the Walloon Region. 366
367
6. References
17 [1] Sivaramakrishna D, Sreekanth D, Himabindu V,Anjaneyulu Y, Biological hydrogen 369
production from probiotic wastewater as substrate by selectively enriched anaerobic 370
mixed microflora, Renew. Energ. (2009) 937-40 371
[2] Levin DB, Pitt L,Love M, Biohydrogen production: prospects and limitations to practical 372
application, Int. J. Hydrogen. Energ. 29 (2004) 173-185 373
[3] Lee M-J, Song J-H,Hwang S-J, Effects of acid pre-treatment on bio-hydrogen production 374
and microbial communities during dark fermentation, Bioeressour. Technol. 100 375
(2009) 1491-1493 376
[4] Kraemer JT,Bagley DM, Improving the yield from fermentative hydrogen production, 377
Biotechnol. Lett. 29 (2007) 685-695 378
[5] Jo JH, Lee DS,Park JM, The effects of pH on carbon material and energy balances in 379
hydrogen-producing Clostridium tyrobutyricum JM1, Bioeressour. Technol. 99 (2008) 380
8485-8491 381
[6] Gomez X, Cuetos MJ, Prieto JI,Moran A, Bio-hydrogen production from waste 382
fermentation: Mixing and static conditions, Renew. Energ. 34 (2009) 970-975 383
[7] Lin P-Y, Whang L-M, Wu Y-R, Wei J, Hsiao C-J, Li S-L,Chang JS, Biological hydrogen 384
production of the genus Clostridium: metabolic study and mathematical model 385
simulation, Int. J. Hydrogen. Energ. (2007) 1728-35 386
[8] Skonieczny MT,Yargeau V, Biohydrogen production from wastewater by Clostridium 387
beijerinckii: Effect of pH and substrate concentration, Int. J. Hydrogen. Energ. 34 388
(2009) 3288-3294 389
[9] Chen SD, Lee KS, Lo YC, Chen WM, Wu JF, Lin CY,Chang JS, Batch and continuous 390
biohydrogen production from starch hydrolysate by Clostridium species, Int. J. 391
Hydrog. Energy. 33 (2008) 1803-1812 392
[10] Pan C-M, Fan Y-T, Zhao P,Hou H-W, Fermentative hydrogen production by the newly 393
isolated Clostridium beijerinckii Fanp3, Int. J. Hydrogen. Energ. 33 (2008) 5383-5391 394
[11] Liu Y, Yu P, Song X,Qu YB, Hydrogen production from cellulose by co-culture of 395
Clostridium thermocellum JN4 and Thermoanaerobacterium thermosaccharolyticum 396
GD17, Int. J. Hydrogen. Energ. 33 (2008) 2927-2933 397
[12] Zhao QB,Yu HQ, Fermentative H-2 production in an upflow anaerobic sludge blanket 398
reactor at various pH values, Bioeressour. Technol. 99 (2008) 1353-1358 399
[13] Chen WM, Tseng ZJ, Lee KS,Chang JS, Fermentative hydrogen production with 400
Clostridium butyricum CGS5 isolated from anaerobic sewage sludge, Int. J. 401
Hydrogen. Energ. 30 (2005) 1063-1070 402
[14] Ying Z,Yang ST, Effect of pH on metabolic pathway shift in fermentation of xylose by 403
Clostridium tyrobutyricum, J. Biotechnol. 110 (2004) 143-157 404
[15] Fang HHP,Liu H, Effect of pH on hydrogen production from glucose by a mixed culture, 405
Bioeressour. Technol. 82 (2002) 87-93 406
[16] Kataoka N, Miya A,Kiriyama K, Studies on hydrogen production by continuous culture 407
system of hydrogen-producing anaerobic bacteria, Water. Sci. Tech. 36 (1997) 41-47 408
[17] Chen CC,Lin CY, Using sucrose as a substrate in an anaerobic hydrogen-producing 409
reactor, Adv. Environ. Res. 7 (2003) 695-699 410
[18] Van Ginkel S, Sung SW,Lay JJ, Biohydrogen production as a function of pH and 411
substrate concentration, Environ. Sci. Tech. 35 (2001) 4726-4730 412
[19] Bergey’s, Bergey’s manual of systematic bacteriology, London, 1984 413
[20] Wang JL,Wan W, Experimental design methods for fermentative hydrogen production: 414
A review, Int. J. Hydrogen. Energ. 34 (2009) 235-244 415
[21] Chen WH, Sung S,Chen SY, Biological hydrogen production in an anaerobic sequencing 416
batch reactor: pH and cyclic duration effects, Int. J. Hydrogen. Energ. 34 (2009) 227-417
234 418
18 [22] Kim JK, Nhat L, Chun YN,Kim SW, Hydrogen production conditions from food waste 419
by dark fermentation with Clostridium beijerinckii KCTC 1785, Biotechnol. Bioproc. 420
Eng. 13 (2008) 499-504 421
[23] Kapdan IK,Kargi F, Bio-hydrogen production from waste materials, Enzym. Microb. 422
Tech. 38 (2006) 569-582 423
[24] Hawkes FR, Dinsdale R, Hawkes DL,Hussy I, Sustainable fermentative hydrogen 424
production: challenges for process optimisation, Int. J. Hydrogen. Energ. 27 (2002) 425
1339-1347 426
[25] Wang XY, Jin B,Mulcahy D, Impact of carbon and nitrogen sources on hydrogen 427
production by a newly isolated Clostridium butyricum W5, Int. J. Hydrogen. Energ. 33 428
(2008) 4998-5005 429
[26] Chong ML, Rahim RA, Shirai Y,Hassan MA, Biohydrogen production by Clostridium 430
butyricum EB6 from palm oil mill effluent, Int. J. Hydrogen. Energ. 34 (2009) 764-431
771 432
[27] Matsumoto M,Nishimura Y, Hydrogen production by fermentation using acetic acid and 433
lactic acid, J. Biosci. Bioeng. 103 (2007) 236-241 434
[28] Yokoi H, Maki R, Hirose J,Hayashi S, Microbial production of hydrogen from starch-435
manufacturing wastes, Biomass & Bioenergy. 22 (2002) PII S0961-9534(02)00014-4 436
[29] Yokoi H, Tokushige T, Hirose J, Hayashi S,Takasaki Y, H-2 production from starch by a 437
mixed culture of Clostridium butyricum and Enterobacter aerogenes, Biotechnol. Lett. 438
20 (1998) 143-147 439
[30] Chen SD, Shen DS, Chen WM, Lo YC, Huang TI, Lin CY,Chang JS, Dark hydrogen 440
fermentation from hydrolyzed starch treated with recombinant amylase originating 441
from Caldimonas taiwanensis On1, Biotechnol. Lett. 23 (2007) 1312-1320 442
[31] Lay JJ, Modeling and optimization of anaerobic digested sludge converting starch to 443
hydrogen, Bioeressour. Technol. 68 (2000) 269-278 444
[32] Khanal SK, Chen WH, Li L,Sung SW, Biological hydrogen production: effects of pH 445
and intermediate products, Int. J. Hydrogen. Energ. 29 (2004) 1123-1131 446
[33] Dabrock B, Bahl H,Gottschalk G, Parameters affecting solvent production by 447
clostridium-pasteurianum, Appl. Environ. Microbiol. 58 (1992) 1233-1239 448
449 450
451
Figure 1. Hydrogen production (ml H2), and glucose, ethanol and VFA concentration (mM) 452
plotted against time (hours) in 2.3 l batch cultures with C. butyricum CWBI1009 at pH 5.2. 453
Glucose Lactate Formate Acetate Ethanol Butyrate
454
Hydrogen volume 455
Figure 2. Hydrogen production rate per litre of culture medium (ml H2 h-1 l-1) plotted against 456
time (hours) in 2.3 l batch cultures at different pH levels. pH 7.3 pH 6.7 pH 457
6.3 pH 5,85 pH 5,4 pH 5,2 pH 4,85 pH 4,7
19 Figure 3: Metabolite analysis of Clostridium butyricum CWBI1009 glucose fermentation at 459
different pH levels in a 2.3 l batch bioreactor. Hydrogen production yield (mol H2 mol-1 460
glucose), hydrogen production rate (mmol H2 mol-1 gluch-1) and final VFA concentrations 461
(mM) Lactate Formate Acetate Ethanol Butyrate Hydrogen
462
yield Hydrogen production rate. 463
Figure 4 : Metabolite analysis of Clostridium butyricum CWBI1009 glucose fermentation in a 464
2.3 l sequenced-batch bioreactor. Hydrogen production yield (mol H2 mol-1 glucose), 465
hydrogen production rate (mmol H2 mol-1 gluc h-1) and final VFA concentrations (mM) 466
Lactate Formate Acetate Ethanol Butyrate Hydrogen yield 467
Hydrogen production rate. 468
Figure 5: Metabolite analysis of Clostridium butyricum CWBI1009 starch fermentation at 469
different pH levels in a 2.3 l sequenced-batch bioreactor. Hydrogen yield (mol H2 mol-1 470
hexose), hydrogen production rate (mmol H2 mol-1 hexose h-1) and final VFA concentrations 471
Lactate Formate Acetate Ethanol Butyrate Hydrogen yield 472
Hydrogen production rate. 473
474
Table 1: Sequence primer used to amplify 16S rDNA and ITS 475
Table 2: Metabolite analysis of Clostridium butyricum CWBI1009 glucose fermentation at 476
different pH levels in a 2.3 l batch bioreactor 477
Table 3: Metabolite analysis of Clostridium butyricum CWBI1009 glucose fermentation in a 478
2.3 l sequenced-batch bioreactor. 479
Table 4: Metabolite analysis of Clostridium butyricum CWBI1009 starch fermentation at 480
different pH levels in a 2.3 l sequenced-batch bioreactor. 481
Figure 1
Figure 2
Figure 3
Figure 4
Figure 5
Table 1: Sequence primer used to amplify 16S rDNA and ITS Primer Sequence 16SA1 5’ –TGGCTCAGATTGAACGCTGGCGGC- 3’ 16SA2 5’ –TACCTTGTTACGACTTCACCCCA- 3’ R16 5’ –KASTGCCAGGGCATCCAC- 3’ R23 5’ –GGGTGAAGTCGTAACAAG- 3’ Table 1
Table 2: Metabolite analysis of Clostridium butyricum CWBI1009 glucose fermentation at different pH levels in a 2.3 l batch bioreactor
Carbon converted from glucose (%)
pH Lactate Formiate Acetate Ethanol Butyrate Sum
4,7 14,13 4,21 11,03 0 34,93 66,24 4,85 13,30 4,2 11,83 0 40,62 69,95 5,2 13,53 8,09 11,67 0 40,34 73,63 5,4 13,32 6,78 12,06 2,25 36,89 71,3 5,85 11,08 12,07 10,01 0,72 32,72 66,6 6,3 14,35 15,58 11,40 3,18 32,42 76,93 6,7 20,59 17,68 12,25 2,98 34,41 87,91 7,3 13,52 19,10 14,04 6,83 28,04 81,53 Table 2
Table 3: Metabolite analysis of Clostridium butyricum CWBI1009 glucose fermentation in a 2.3 l sequenced-batch bioreactor.
Carbon converted from glucose (%)
Sequence Lactate Formiate Acetate Ethanol Butyrate Sum
1 6,74 7,64 14,03 5,35 37,47 71,23 2 0 2,62 12,52 1,47 53,3 69,91 3 0 2,89 14,01 4,2 47,05 68,15 4 0 0 12,25 3,33 58,1 73,68 5 1,64 0 5,05 0 61,6 68,29 6 0 0 15,03 3,28 54,45 72,76 7 0 0,01 17,12 1,62 50,83 69,57 8 0 0,06 19,89 2,17 49,6 71,72 Table 3
Table 4: Metabolite analysis of Clostridium butyricum CWBI1009 starch fermentation at different pH levels in a 2.3 l sequenced-batch bioreactor.
Carbon converted from starch (%)
pH Lactate Formiate Acetate Ethanol Butyrate Sum
5,2 0 9,7 13,8 6,2 41,6 71,3
5,4 0 7,1 14,9 3,4 46,8 72,2
5,6 2,1 10,2 15,7 5,8 44,8 78,6
5,8 0 8,9 13,8 5,3 39,2 67,2