The Portugal coastal counter current off NW Spain:
new insights on its biogeochemical variability
X.A. A
´ lvarez-Salgado
a,∗, F.G. Figueiras
a, F.F. Pe´rez
a, S. Groom
b,
E. Nogueira
a,c, A.V. Borges
d, L. Chou
e, C.G. Castro
a, G. Moncoiffe´
f,g,
A.F. Rı´os
a, A.E.J. Miller
h, M. Frankignoulle
d, G. Savidge
f, R. Wollast
eaCSIC, Instituto de Investigacio´ns Marin˜as, Eduardo Cabello 6, 36208 Vigo, Spain bPlymouth Marine Laboratory, Prospect Place, Plymouth PL1 3DH, UK
cIEO, Centro Oceanogra´fico de Gijo´n, Avda. Prı´ncipe de Asturias 70 bis, 33212 Gijon, Spain dUnite´ d’Oce´anographie Chimique, Mare, University of Lie`ge, Sart Tilman B5, B-4000 Liege, Belgium
eLaboratoire d’Oce´anographie Chimique et Ge´ochimie des Eaux, Universite´ Libre de Bruxelles, Campus de la Plaine—CP 208, B-1050 Brussels, Belgium
fQueen’s University of Belfast, School of Biology and Biochemistry, Marine Laboratory, Portaferry, Co. Down, BT22 1PF, UK gBODC, Bidston Observatory, Bidston Hill, Prenton CH43 7RA, UK
hSAMS, Dunstaffnage Marine Laboratory, University of the Highlands and Islands project, Oban, Argyll PA34 4AD, UK
Abstract
Time series of wind-stress data, AVHRR and SeaWiFS satellite images, and in situ data from seven cruises are used to assemble a coherent picture of the hydrographic variability of the seas off the Northwest Iberian Peninsula from the onset (September–October) to the cessation (February–May) of the Portugal coastal counter current (PCCC). During this period the chemistry and the biology of the shelf, slope and ocean waters between 40°and 43°N have previously been undersampled. Novel information extracted from these observations relate to:
1. The most frequent modes of variability of the alongshore coastal winds, covering event, seasonal and long-term scal-es;
2. The conspicuous cycling between stratification and homogenisation observed in PCCC waters, which has key impli-cations for the chemistry and biology of these waters;
3. The seasonal evolution of nitrite profiles in PCCC waters in relation to the stratification cycle;
4. The Redfield stoichiometry of the remineralisation of organic matter in Eastern North Atlantic Central Water (ENACW)—the water mass being transported by the PCCC;
5. The separation of coastal (mesotrophic) from PCCC (oligotrophic) planktonic populations by a downwelling front along the shelf, which oscillates to and fro across the shelf as a function of coastal wind intensity and continental runoff; and
6. The photosynthetic responses of the PCCC and coastal plankton populations to the changing stratification and light conditions from the onset to the cessation of the PCCC.
∗ Corresponding author. Tel.:+34-986-231-930; fax:+34-986-292-762. E-mail address: xsalgado@iim.csic.es (X.A. A´ lvarez-Salgado).
0079-6611/03/$ - see front matter2003 Elsevier Science Ltd. All rights reserved. doi:10.1016/S0079-6611(03)00007-7
2003 Elsevier Science Ltd. All rights reserved.
Contents
1. Introduction . . . 283
2. Materials and methods . . . 285
2.1. The hydrographic cruises . . . 285
2.2. Wind-stress and offshore–onshore Ekman transport calculations . . . 288
2.3. Geostrophic flow calculations . . . 288
2.4. AVHRR and SeaWIFS images . . . 288
2.4.1. Sea-surface temperature . . . 288
2.4.2. Ocean colour . . . 290
2.5. Plankton counts and estimation of primary production from P–E curves . . . 290
3. Results and discussion . . . 291
3.1. Wind-stress patterns off NW Spain . . . 291
3.1.1. Seasonal variability: extension and intensity of the downwelling season . . . 291
3.1.2. Decadal change of⫺QXand its effect on the development of the PCCC . . . 292
3.1.3. Event scale variability . . . 293
3.2. A physical framework for the PCCC off NW Spain . . . 295
3.2.1. Intensity of the PCCC deduced from the geopotential anomaly fields . . . 295
3.2.2. Oceanic and coastal boundaries of the PCCC . . . 301
3.2.3. Vertical structure of the PCCC: a seasonal cycle of stratification/mixing . . . 303
3.3. New insights on the effects of the PCCC on the distributions of chemical parameters . . . 304
3.3.1. Chemistry of surface and central waters transported by the PCCC . . . 305
3.3.2. Seasonal development of nitrite profiles in relation to the stratification/mixing sequence of PCCC waters . . . 307
3.4. New insights on the effects of the PCCC on the distributions of biological parameters . . . 308
3.4.1. Effect of the PCCC on the Chl-a distributions . . . 308
3.4.2. Isolation of PCCC from coastal plankton species . . . 314
3.4.3. Primary production rates in PCCC and coastal waters . . . 315
4. Summary and major conclusions . . . 316
1. Introduction
A poleward flowing slope undercurrent centred at depths of 150–300 m, which is compensating for the equatorward flows in the surface circulation, is a feature common to the coastal upwelling systems off California/Oregon, Peru/Chile, Namibia/Benguela and Canary/Iberian Peninsula (Smith, 1989). There is evidence for the existence of poleward undercurrents from tropical to polar latitudes along the eastern boundaries of all the major oceans (Pingree, 1994), which are primarily being forced by large-scale geopot-ential gradients and topography (Frouin, Fiu´za, Ambar, & Boyd, 1990; Huthnance, 1995; McCreary, Shetye, & Kundu, 1986). Surface countercurrents also commonly feature in major coastal upwelling sys-tems, either as the surface manifestations of trapped waves or as a result of undercurrents surfacing (Mooers, 1989). Such surfacing by undercurrents occurs in those latitudes that are affected by marked seasonal reversals in wind-stress and curl. Examples of such surfacing occur in the Hiada Current off Western
Nomenclature
aB photosynthetic efficiency of P–E relationships (gC(gChl)⫺1 h⫺1) (µmol m⫺2 s⫺1)⫺1
AOU apparent oxygen utilisation (µmol kg⫺1) AVHRR advanced very high resolution radiometer CT total inorganic carbon (µmol kg⫺1)
CTZ coastal transition zone
DCM deep chlorophyll maximum
Ek light saturation parameter of P–E relationships (µmol m⫺2 s⫺1) ENACW Eastern North Atlantic Central Water
ENACWsp ENACW of subpolar origin ENACWst ENACW of subtropical origin
NAO ‘North Atlantic Oscillation’ index
NCT CTnormalised to salinity 35.0 (µmol kg⫺1)
NTA TA normalised to salinity 35.0 (µmol kg⫺1)
PAR photosynthesis available radiation
PNM primary nitrite maximum
PB
m maximum photosynthetic rate of P–E relationships (gC(gChl)⫺1 h⫺1)
PCCC Portugal coastal counter current
P–E photosynthesis–irradiance relationships
PP primary production (mgC m⫺2 d⫺1)
⫺QX offshore Ekman transport (m3 s⫺1 km⫺1)
R continental runoff (m3 s⫺1)
S[NAO] cumulative sum function of the NAO index S[⫺QX(t)] cumulative sum function of ⫺QX
SC[⫺QX] seasonal cycle of ⫺QX
SeaWiFS sea-viewing Wide Field-of-view Sensor
SSS sea surface salinity
SST sea surface temperature (°C)
TA total alkalinity (µmol kg⫺1)
Canada (Freeland, 1989), the Davidson Current in the California Current System (Huyer, Kosro, Lentz, & Beardsley, 1989), and the Portugal coastal counter current (PCCC) off Portugal (Ambar & Fiu´za, 1994). All these surface countercurrents manifest during autumn and winter, when local winds blow from the S– SW, forcing poleward displacement of the surface wind-mixed layer so that a convergent front developed in the coastal waters. An extreme case of a surface countercurrent is found in the Leeuwin Current, off Western Australia (Cresswell & Golding, 1980; Smith, Huyer, Godfrey, & Church, 1991). The largest alongshore geopotential gradients ever observed anywhere in eastern boundary regions prevent the develop-ment of a steady equatorward flow, despite the favourable wind-stress conditions during the spring and summer (Church, Cresswell, & Godfrey, 1989; McCreary et al., 1986).
The dynamics (fronts, centres and filaments) and biogeochemistry (primary production, recycling and shelf-ocean exchange) of coastal upwelling systems have been the subject of research conducted recently off California (Brink & Cowles, 1991), NW Africa (Barton et al., 1998) and NW Iberia (Joint et al., 2001) carried out under the auspices of the ‘Coastal Transition Zone’ programmes. Much less attention has been paid to the surface countercurrents that develop during prolonged downwelling-favourable periods lasting up to 6 months each year at temperate latitudes (Huyer et al., 1989; Wooster, Bakun, & Mclain, 1976).
The surface countercurrent regime not only transports salt, heat, dissolved substances and plankton assem-blages from subtropical to temperate/subpolar latitudes along the slope but also prevents, or even reverses, the off-shelf export of materials that is normally characteristic of coastal upwelling systems (Pingree, Sinha, & Griffiths, 1999).
Ambar and Fiu´za (1994) have reviewed the surface circulation off the Western Iberian Peninsula. This is an area dominated by the Portugal Current System, which is composed of the slow, equatorward, Iberian basin-scale flow of the Portugal Current proper in the open ocean (Arhan, Colin de Verdie`re and Memery, 1994; Krauss and Ka¨se, 1984; Richardson, 1983); and the fast, seasonally reversing, Iberian slope scale flow of the Portugal Coastal Current near the coast. During summer, the Portugal Coastal Current is 30– 40 km wide and 50–100 m deep and flows southward in the vicinity of the shelf break, being driven by upwelling-favourable northerly winds. It then transports recently upwelled, cold and nutrient-rich Eastern North Atlantic Central Water of subpolar origin (⬎45°N; ENACWsp) in the north, and warmer and nutrient-poor ENACW of subtropical origin (⬍40°N, ENACWst) in the south (Fiu´za, 1984; Rı´os, Pe´rez, & Fraga, 1992; Pe´rez, Mourin˜o, Fraga, & Rı´os, 1993). In September–October the surface circulation reverses becom-ing the well-defined PCCC that is 30 km wide and 200 m deep flowbecom-ing off the NW Iberian Peninsula, which is the subject of the present study. This mode of the PCCC persists until March–April (Ambar, Fiu´za, Boyd, & Frouin, 1986; Frouin et al., 1990; Wooster et al., 1976), transporting ENACWst from at least 39°N (off Lisbon)—where it appears to be considerably wider—to the Armorican Shelf off SW France at 47°N (Pingree & Le Cann, 1990). Following Pingree, Sinha and Griffiths (1999), the coastal current system off NW Spain is considered to be a component of the predominantly density and topographically driven European ‘Poleward Slope Current’.
The dynamics of the PCCC have been studied using AVHRR satellite images (Ambar et al., 1986; Pingree & Le Cann, 1990; Frouin et al., 1990), in situ hydrographic data accompanied by geostrophic calculations (Fiu´za et al., 1998; Haynes & Barton, 1991; Maze´, Arhan, & Mercier, 1997), current meter records (Ambar et al., 1986; Swallow, Gould, & Saunders, 1977), and surface drifters (Haynes & Barton, 1990). However, little attention has been paid to the biogeochemical implications of the poleward surface flows either in the Portugal Current System or in the eastern boundary current systems in other oceans. Indeed, it appears that the studies by Bode, Ferna´ndez, Botas, and Anado´n (1990) off N. Spain in April 1987 and Castro, A´ lvarez-Salgado, Figueiras, Pe´rez, and Fraga (1997) off NW Spain in September 1986 are unique in focusing on the biogeochemistry of these systems. Both studies found isolated communities of organisms associated with particular chemical (low NO⫺3, high NO⫺2) and physical conditions. More
recently, Pelı´z and Fiu´za (1999) analysed coastal zone colour scanner (CZCS) images and found evidence for a wedge of southern oligotrophic water penetrating northward over the western Iberian continental margin during the autumn and winter, between the pigment-rich shelf zone and the zone of moderate concentrations further offshore.
Data from some of the seven research cruises involved in this study have previously been used to describe the thermohaline (Fiu´za et al., 1998; Pe´rez, Rı´os, King, & Pollard, 1995; Rı´os, Pe´rez & Fraga, 1992) and chemical (Pe´rez, Castro, A´ lvarez-Salgado, & Rı´os, 2001a,b; Pe´rez et al., 1993) characteristics of ENACW in the oceanic waters off NW Spain, the rapid ageing of ENACW on the shelf (A´ lvarez-Salgado, Castro, Pe´rez, & Fraga, 1997; Prego & Bao, 1997), the behaviour of surface waters as a source-sink for atmospheric CO2(Borges & Frankignoulle, 2002; Pe´rez, Rı´os, & Roso´n, 1998), and the estimates of primary production
in NW Iberian shelf, slope and open ocean waters derived from satellite imagery (Joint et al., 2002). Consequently, this work will essentially focus on those aspects that have not yet been studied, namely: 1. A statistical approach to the recurrent modes of variability of coastal winds, covering from long-term
to daily time-scales (Section 3.1);
2. The seasonal cycle of stratification and mixing of PCCC waters, which have key implications for the chemistry and biology of the area (Section 3.2.3);
3. The O2/C/N/P/Si stochiometry of the mineralisation of organic matter in oceanic ENACW being
trans-ported by the PCCC (Section 3.3.1);
4. The seasonal evolution of nitrite profiles in PCCC waters in relation to the stratification conditions (Section 3.3.2);
5. The species composition of the phytoplankton communities in NW Iberian waters during the PCCC-favourable season (Section 3.4.2); and
6. The photosynthetic response of these species under contrasting conditions of the upper water column being either well-mixed or stratified (Section 3.4.3).
We will base our analyses on wind-stress and offshore Ekman transport calculations, AVHRR and SeaW-iFS satellite images and a set of data from hydrographic cruises covering the onset of the PCCC (September–October), through the period of maximum winter convection to the cessation of the PCCC (April–May). The study will be restricted to latitudes between 40° and 43°N.
2. Materials and methods
2.1. The hydrographic cruises
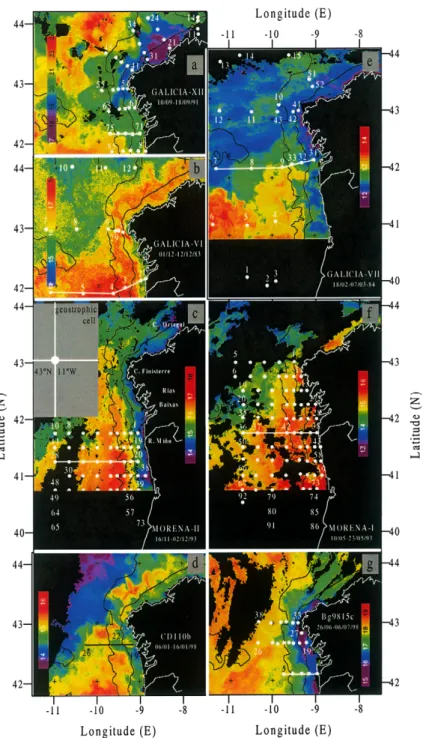
Mapping of relevant thermohaline, chemical and biological variables was undertaken during seven hydro-graphic cruises conducted off the NW Iberian Peninsula between 1983 and 1998 (Fig. 1). Cruise GALICIA-XII (10–18 September 1991) coincided with the onset of the PCCC in the period of maximum stratification when there was the transition from upwelling- to downwelling-favourable winds. Cruises GALICIA-VI (1–12 December 1983) and MORENA-II (15 November–2 December 1993) took place when the develop-ment of the PCCC was in an advanced state of developdevelop-ment in late autumn. The first of these two cruises
was sampled between 42° and 44°N (off NW Spain), whereas the other extended the sampling further
south from 42°to 40°N off Northern Portugal. Cruises CD110b (6–16 January 1998) and GALICIA-VII (18 February–7 March 1983) were carried out during the winter mixing period, and finally, cruise MORENA-I (10–26 May 1993) was conducted just before the onset of the upwelling season. Data from cruise Bg9815c (26 June–7 July 1998) will also be referred to in order to illustrate the situation when upwelling-favourable winds are predominant so that at the surface the Portugal Coastal Current flows southwards and the pole-ward flow is a subsurface slope undercurrent.
Cruises GALICIA-VI (December 1983) and GALICIA-VII (February–March 1984) were performed dur-ing the same downwelldur-ing season (1983–1984), which allows comparison of the hydrographic changes occurring in the PCCC before and after a winter mixing period in the same year, i.e. without any influence of interannual variability. Notable poleward surface flow occurred during the winter 1983–1984 resulting in conspicuous warming along the north Spanish coast around the New Year (Pingree & Le Cann, 1989). Similarly, cruises MORENA-I (May 1993) and MORENA-II (November–December 1993) were conducted before and after the upwelling-favourable season in 1993, thus allowing comparison of the spring and autumn PCCC within the same year. Although only four stations were occupied during CD110b (January 1998) because of bad weather, data from this cruise have been included because they provide a unique view of conditions during January.
Table 1 summarises the basic information about the cruises. Fig. 1 shows the locations of sampling sites where vertical profiles of the different variables were measured during each of the cruises. No plankton counts were carried out during the 1983–1984 cruises and primary production data are only available for cruises MORENA-I, GALICIA-XII, CD110b and Bg9815c.
Nutrient concentrations were determined by the ‘Instituto de Investigacio´ns Marin˜as-Group of Ocean-ography’ using standard segmented flow analysis techniques (A´ lvarez-Salgado, Fraga, & Pe´rez, 1992;
Fig. 1. Map of the survey area (NW Iberian Peninsula) for the set of seven cruises included in this work: GALICIA-XII (September 1991) (a), VI (November–December 1983) (b), MORENA-II (November 1993) (c), CD110b (January 1998) (d), GALICIA-VII (February–March 1984) (e), MORENA-I (May 1993) (f), and Bg9815c (July 1998) (g). White points show the position of the stations occupied on each cruise. Solid lines represent the cross-shelf sections used in Figs. 6, 7, 9, 10, 13 and 14. The 2° ×2° geostrophic-wind cell centred at 43°N 11°W (⫺11°E) is presented in chart c. The 200 and 1000 m isobaths are also included. AVHRR images correspond to the sampling dates and are the most representative for the SST distribution found during the cruises. Major geographic features are presented in panel c.
Table 1
Relevant information about the cruises referred to in this study, including sampling dates, vessel, gear, measured variables and prevailing oceanographic conditions
Cruise Dates Vessel Sampling Measured variables Oceanographic
gear scenario
q/S Nut Chl Plank PP Prevailing PCCC winds, m conditions s⫺1
GALICIA-VI 1–12 C. de Niskin bott., × × × Southerly, Late
December Saavedra inv. therm. 6.2 autumn
1983
PCCC-favour. cond.
GALICIA-VII 18 C. de Niskin bott., × × × North Late
February– Saavedra inv. therm. easterly, winter
7 March 8.2
PCCC-1984 favour.
cond. GALICIA-XII 10–18 Investigador CTD, rosette× × × × × Westerly, PCCC
September S. sampler 4.5 onset
1991
MORENA-I 10–26 May C. de CTD, rosette× × × × × South PCCC
1993 Saavedra sampler westerly, cessation
6.3
MORENA-II 15 Hakon CTD, rosette× × × × Southerly, Late
November– Mosby sampler 7.0 autumn
2
PCCC-December favour.
1993 cond.
CD110b 6–16 Charles CTD, rosette× × × × × Southerly, Early
January Darwin sampler 15 winter
1998
PCCC-favour. cond.
BG9815Cc 26 June–7 Belgica CTD, rosette× × × × × North PCCC
July 1998 sampler easterly, unfavour.
12 (upwelling-favour.)
Hansen & Grasshoff, 1983; Mourin˜o & Fraga, 1985). Potentiometric pH was measured in the National Bureau of Standards (NBS) scale with the classical 7.413 phosphate buffer in most cruises, following the procedure of Pe´rez and Fraga (1987a). During cruises CD110b and Bg9815c the electrode was calibrated in the Total Hydrogen Ion Concentration Scale with the TRIS and AMP buffers according to Dickson (1993). Total alkalinity (TA) was measured by potentiometric end-point titration according to Pe´rez and Fraga (1987b), except on cruises CD110b and Bg9815c when classical Gran electro-titration was used.
Total inorganic carbon (CT) was calculated from pH and TA using the carbon system equations. CT and
TA have been normalised to salinity 35.0 to produce the corresponding NCTand NTA parameters, which
depend only on the biological and geochemical activity in the water sampled. Finally, dissolved oxygen was measured by the Winkler method using a potentiometric end-point determination. Apparent oxygen utilisation, AOU=O2sat⫺O2, has been calculated using Benson and Krause’s equation (UNESCO, 1986)
for oxygen saturation (O2sat). Chlorophyll a (Chl-a) was estimated fluorometrically by the method of
Yentsch and Menzel (1963).
2.2. Wind-stress and offshore–onshore Ekman transport calculations
The north (south) component of shelf wind-stress (ty) causes upwelling (downwelling) favourable off-shore (onoff-shore) Ekman transport values (⫺QX) along the NW Iberian margin (Wooster et al., 1976), which can be roughly estimated following Bakun’s (1973) method
⫺Qx⫽ ty rSW.f ⫽ ⫺rair.CD.兩V兩.Vy rSW.f , (1)
where rair is the density of air (1.22 kg·m⫺3 at 15 °C), CD an empirical dimensionless drag coefficient
(1.4×10⫺3 according to Hidy, 1972), f the Coriolis parameter (9.946×10⫺5 s⫺1 at 43°latitude),rSWthe
density of seawater (~1025 kg m⫺3) and兩V兩 and Vy are the average daily module and north component of the geostrophic winds in a 2° ×2° cell centred at 43°N 11°W (Fig. 1(c)) assumed representative for the study area. Average daily geostrophic winds were estimated from atmospheric surface pressure charts, provided at 6 h intervals by the ‘Instituto Nacional de Meteorologı´a’. Positive values of ⫺QX (m3 s⫺1 km⫺1) indicate upwelling-favourable offshore Ekman transport. Conversely, negative values of ⫺QX indi-cate downwelling-favourable onshore Ekman transport (see Lavı´n, Dı´az del Rı´o, Cabanas, & Casas, 1991, for further details).
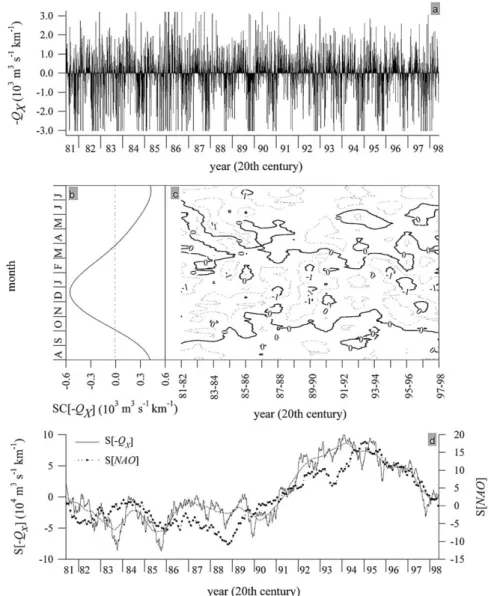
The time series of daily values of⫺QX from August 1981 to July 1998 (n= 6205) has been analysed
(Fig. 2(a)). Values outside the lower extreme bound (LEB = Q1⫺3H =⫺3200 m3
s⫺1 km⫺1) and upper
extreme bound (UEB = Q3 + 3H = 3022 m3 s⫺1 km⫺1) were rejected and the time series was analysed
(Q1 and Q3 are the lower and upper quartiles and H is the interquartile range). The rejected values
rep-resented ~3% of the whole time series. Spectral and harmonic analyses (Poularikas & Seely, 1991), and differencing techniques (Ibanez, Dauvin, & Ettienne, 1993) were applied to characterise the modes of temporal variability of⫺QXfrom short-term to interannual scales.
2.3. Geostrophic flow calculations
Following Frouin et al. (1990), the geopotential anomaly at 10 dbar was computed relative to 350 dbar. Although water displacements at this reference level are significant (Maze´ et al., 1997), they are small compared to the enhanced surface circulation in the area during either the upwelling- or the downwelling-favourable seasons. Therefore, strictly, our geostrophic computations only provide a qualitative, rather than a quantitative, description of the geostrophic circulation patterns. A more appropriate reference level would have been 2500 dbar (Maze´ et al., 1997), but on some of the cruises (GALICIA-XII, MORENA-II and Bg9815c) it was not possible to sample to this depth. Comparison of the geopotential anomalies at 10 dbar
referred to 350 and 2500 dbar for the MORENA-I cruise showed a reasonable correlation (r = +0.79, p
⬍ 0.05). For shelf stations, where the water depth (Z) is shallower than the reference level, the extrapolation method of Reid and Mantyla (1976) was used, which consists of extrapolating the horizontal gradients of the geopotential anomaly computed from the pairs of stations in deeper waters towards the stations with
Z⬍ 350 dbar.
2.4. AVHRR and SeaWIFS images 2.4.1. Sea-surface temperature
Sea-surface temperature was measured using the advanced very high resolution radiometer (AVHRR) series of instruments, flown on the US NOAA series of polar-orbiting satellites. Individual 1-km resolution,
Fig. 2. Offshore Ekman transport values (⫺QX) calculated from the wind field at the 2° ×2°geostrophic cell centred at 43°N 11°W (⫺11°E) for the period August 1981–August 1998. (a) Time series of daily values of⫺QX(in 103m3s⫺1km⫺1). Positive (negative) values indicate upwelling (downwelling) favourable winds. (b) Average 1981–1998 seasonal cycle of⫺QX, SC[⫺QX]. (c) Seasonal and interannual variability of the 30-d running mean of⫺QX. (d) Deseasonalised cumulative sums of⫺QXand the NAO index over the period 1981–1998, S[⫺QX] and S[NAO], respectively. Dashed line, 1-year running mean of S[⫺QX].
raw satellite passes were supplied by the NERC Satellite Receiving Station, Dundee, Scotland and processed following Miller, Groom, McManus, Selley, and Mironnet (1997). Briefly, the thermal infra-red channels were calibrated (Planet, 1988) and SST computed using the split window technique (McClain, Pichel, & Walton, 1985) with appropriate NOAA algorithms for each AVHRR instrument. Clouds were detected and masked using a series of tests on the visible and infra-red channels (Miller et al., 1997) and the images were then remapped onto a Mercator projection using orbital ephemeris and an automated adjustment method to correct for residual navigation errors (Bordes, Brunel, & Marsouin, 1992). To investigate sea-sonal, monthly and interannual variability for the period 1987–1999, monthly composite AVHRR SST data
were obtained from the NASA Pathfinder project (Va´zquez, Hamilton, Van Tran, & Sumagaysay, 1994); these data are mapped onto an equal-angle projection giving a latitudinal and longitudinal resolution of 9.8 and 7.3 km at 42°N.
2.4.2. Ocean colour
Ocean colour data were obtained from the NASA Sea-viewing Wide Field-of-view Sensor (SeaWiFS) launched in August 1997, an operational instrument that has provided daily high resolution ~1.1 km cover-age over the Iberian Peninsula. Individual passes were supplied in level 1 format by the Dundee Satellite Receiving Station and analysed using the SeaWiFS Automated Processing System (SeaAPS: Lavender & Groom, 1999). SeaAPS automatically applies NASA algorithms to perform calibration, navigation images and atmospheric correction (Gordon & Wang, 1994). Images of water leaving radiance are then used to compute chlorophyll concentration with the OC4 algorithm (O’Reilly et al., 1998) or combined to produce near-true colour images that can show scattering and absorption in the 555, 510 and 443 nm bands (Lavender & Groom, 1999). Finally, the SeaWiFS images are remapped to the same Mercator projection as the AVHRR data. SeaWiFS monthly composites on an equal-angle projection with 9.8/7.3 km pixel
size (at 42°N) were obtained from the NASA Goddard Distributed Active Archive Center to investigate
the monthly and interannual characteristics of chlorophyll in the study area.
2.5. Plankton counts and estimation of primary production from P–E curves
Plankton samples were collected from 3 to 8 depths in the upper 100 m and preserved in Lugol’s iodine. The organisms were identified and counted to the species level where possible using an inverted microscope
and composite sedimentation chambers. Small species (⬍20 µm) were counted along single transects at
×250 and ×400 magnification, and a scan of the whole slide at ×100 magnification was used for larger
species. Inverted microscope counts cover the nano- (2–20 µm) and plankton (20–200 µm) size ranges,
but the preservation procedure can result in losses in the nanoplankton fraction, which is mainly composed
of flagellates. The picoplankton fraction (⬍2 µm) has not been included. The count data for
GALICIA-XII and MORENA-I cruises provided information on horizontal distributions of plankton species, and vertical distribution data are available from selected transects (see Fig. 1) sampled during the GALICIA-XII, MORENA-II, CD110b, MORENA-I and Bg9815c cruises.
Photosynthesis–irradiance (P–E) relationships were determined at 3–5 depths in the water column during cruises GALICIA-XII, CD110b, MORENA-I and Bg9815c. Sampling depths were selected on the basis of the Chl-fluorescence profiles obtained with a fluorometer attached to the rosette sampler. Where a deep chlorophyll maximum (DCM) was observed, one sample was taken in the maximum, two samples from the upper and lower tails of the DCM, together with one sample from the surface and one sample from the depth of 1% PAR. The P–E experiments were conducted in linear incubators illuminated at the front by tungsten halogen lamps. Each incubator housed 14 subsamples held in 75 ml tissue culture Corning
flasks, inoculated with 185 kBq (5 µCi) of 14C-labelled bicarbonate. The incubators were cooled with
circulating surface water. The photosynthetic available radiation (EPAR) at the position of each incubation
bottle was measured with a Li-Cor cosine sensor LI-190SA. The flask at the end of the incubator was covered with aluminium foil and used as a measure of dark fixation. After 2–3 h of incubation, samples were filtered through 25 mm glass fibre filters (Whatman GF/F) and were exposed to concentrated HCl fumes for 12 h. Radioactivity was determined using the external standard and the channel ratio methods to correct for quenching. The P–E parameters were estimated by fitting the data to the model of Platt, Gallegos, and Harrison (1980). Water column primary production was integrated to a depth equivalent to 0.1% of surface irradiance using the P–E parameters, the chlorophyll concentration in the water column, the daily incident light and the vertical attenuation coefficient. Incident sea surface photosynthetic active radiation (PAR 400–700 nm) was measured with a Li-Cor cosine sensor (LI-190SA) and light penetration
in the water column was determined using a Li-Cor spherical quantum sensor LI-193SA. Underwater PAR just below the sea surface was calculated by adjusting the PAR profile to the equation of light attenuation with depth. Light transmittance at the air–sea interface was calculated by dividing PAR light just below the sea surface by incident PAR at the sea surface.
3. Results and discussion
3.1. Wind-stress patterns off NW Spain
According to Bakun and Nelson (1991), during fall and winter the wind-stress curl near the NW coast of the Iberian Peninsula is low and irregular in its distribution, but becomes strongly cyclonic during spring and summer. Therefore, it is unlikely to be an important factor in the control of the onset of the PCCC, hence the simple wind-stress calculations in the 2° ×2° geostrophic cell centred at 43°N, 11°W (Fig. 1(c)) are considered sufficient to define the effects of the wind patterns on the seasonal reversals of the Portugal Coastal Current. Haynes and Barton (1990) observed that the weaker the equatorward wind-stress, the stronger the PCCC flow is, whereas a reversal of the PCCC flow only occurs if the equatorward wind-stress is sufficiently strong. Consequently, a quantitative study of the recurrent modes of temporal variation of⫺QXwill provide information on the effects of the expected hydrographic variability on event, seasonal and interannual time-scales. We first focus on seasonal variability (Section 3.1.1), then on interannual variability (Section 3.1.2), and finally on event scale variability (Section 3.1.3). The interannual variability
of ⫺QXwill be matched to AVHRR sea surface temperatures (SST) (January mean).
3.1.1. Seasonal variability: extension and intensity of the downwelling season
Retention of the first (T = 365 d) and second (T = 183 d) harmonics of a Fourier analysis applied to
the complete 1981–1998 time series of ⫺QX values (Fig. 2(a)) produces the average seasonal cycle,
SC[⫺QX] (Fig. 2(b)), and reveals the two well-defined periods previously noted by Wooster et al. (1976). A upwelling-favourable season (equatorward wind-stress) extends from the beginning of April to the end of September and there is a seasonal maximum of⫺QXof 0.4×10³m3s⫺1km⫺1in July. The downwelling-favourable season (poleward wind-stress) extends from the beginning of October to the end of March and there is a seasonal minimum of⫺QXof⫺0.5×10³m3s⫺1 km⫺1 in December. The average duration and
⫺QX values for the 1981–1998 upwelling-favourable seasons were 188 d and 0.27×10³ m3 s⫺1 km⫺1,
respectively. The comparable averages for downwelling-favourable seasons were 177 d and ⫺0.33×10³
m3s⫺1km⫺1, respectively. Therefore, the average SC[⫺Q
X] is slightly biased towards downwelling-favour-able values. However, this parameter only retains 12% of the total variability of the 1981–1998 time series, which indicates that the seasonal signal is of relatively low intensity. The SC[⫺QX] values calculated for
each individual year retain from⬍5% in 1985–1986 to ⬎27% in 1989–1990 of the total annual variability
(Table 2).
The interannual variability of the monthly running mean of⫺QX(Fig. 2(c)) indicates that there is high variation in the timing of the onset and the cessation of the downwelling-favourable season each year, and that downwelling events occur frequently during the upwelling season and vice versa. The onset of the downwelling-favourable season tended to occur regularly between mid-September and mid-October, but the timing of its cessation ranged from early February to late May. The onset of the downwelling-favourable season coincided with the ‘autumn phytoplankton bloom’ and the subsequent period of intense organic matter degradation characteristic of temperate ecosystems (Nogueira, Pe´rez, & Rı´os, 1997). Whereas the timing of the cessation of the downwelling-favourable season overlapped with the period of the ‘spring bloom’ (Figueiras & Niell, 1987; Nogueira et al., 1997). The occurrence/absence of the PCCC at the time of the spring and autumn blooms has key implications for the fate of the fresh organic materials produced
Table 2
Distribution of the temporal variance of⫺QXfor different years throughout the 1981–1998 study period
Year SC[⫺QX] (%EV) Short-term bands Significant harmonics
(August– (%EV⬎5, p ⬍ 0.05) July) T=365 T=183 30ⱖT⬎7 7ⱖTⱖ2 1981–1982 9.6 2.1 30.8 29.4 46 (5.2), 19 (5.8) 1982–1983 3.4 6.5 39.7 29.9 24 (5.2) 1983–1984 7.1 0.4 34.0 33.0 20 (5.0) 1984–1985 12.8 0.2 25.5 34.9 61 (5.1), 52 (5.1) 1985–1986 3.2 1.5 31.5 35.4 30 (7.2) 1986–1987 10.4 0.2 28.9 50.0 – 1987–1988 8.5 3.2 34.0 35.8 – 1988–1989 11.6 1.8 34.9 38.7 – 1989–1990 19.9 7.3 31.2 28.3 – 1990–1991 8.9 1.2 36.9 32.7 16 (5.1) 1991–1992 5.2 4.3 38.5 31.7 17 (5.0), 13 (5.5) 1992–1993 4.3 3.8 27.4 33.0 73 (5.4), 61 (7.9), 30 (5.2) 1993–1994 5.4 × 31.2 43.5 × 1994–1995 13.5 3.7 33.5 33.3 91 (6.4), 24 (8.0) 1995–1996 12.3 5.6 30.4 26.6 91 (8.6), 73 (10.5) 1996–1997 10.0 1.2 31.8 33.2 121 (5.8) 1997–1998 7.7 4.2 42.2 31.4 21 (7.9)
Years are defined from August to July, such that the downwelling-favourable season is at the middle of each period. The percentage of explained variance (%EV) retained by the first (T=365 d) and second (T=183 d) harmonics of the annual period (which defines the seasonal cycle, SC[⫺QX]), and by the short-term bands of T⬍ 30 d are indicated. The last column shows the period (%EV) of some significant harmonics, those with %EV⬎5% and p ⬍ 0.05, each year.
during these events in the coastal zone; i.e. in the balance between off-shelf export and in situ sedimentation. Of particular interest were the results from September 1991 (GALICIA-XII) cruise, when the coastal winds shifted from downwelling- to upwelling-favourable and the May 1993 (MORENA-I) cruise, when there was an isolated downwelling-favourable period lasting about a month.
3.1.2. Decadal change of ⫺QXand its effect on the development of the PCCC
In order to highlight any possible interannual variability in the ⫺QX time series, it was necessary to filter out the seasonal and event (high frequency) components (Fedorov & Ostrovskii, 1986). The seasonal
component was removed by subtracting the average SC[⫺QX] for 1981–1998 (Fig. 2(b)) and the event
component by the cumulative sums method (Ibanez et al., 1993). The corresponding cumulative function
S[⫺QX] (Fig. 2(d)) is
S[⫺QX(t)]⫽ (⫺QX(t)⫺SC[⫺QX]) ⫹ S[⫺QX(t⫺1)], (2)
where t is time in Julian days. The lower S[⫺QX] values indicate preferred wind conditions for PCCC
development off the NW Iberian Peninsula. A negative (positive) trend in S[⫺QX] indicates transition to PCCC-favourable (unfavourable) periods.
S[⫺QX] from Fig. 2(d) appears to indicate a long-term cycle with a periodicity T~10 years; minimum values (PCCC favourable) occurred during the mid-1980s (1984–1986) and maximum values (PCCC
unfavourable) in the mid-1990s (1994–1996). An abrupt S[⫺QX] trough occurred in 1983 when there was
conditions (Fig. 2(c)). This observation is consistent with Pingree and Le Cann (1989), who identified a marked warming along the north Spanish coast in the beginning of 1984. The VI and GALICIA-VII cruises took place in December 1983 and February–March 1984, respectively, allowing us to define the PCCC during a particularly favourable year. Wind-stress patterns in 1985 and 1989 were also exceptionally favourable to the development of PCCC, and this was reflected in the amplitude of the seasonal signal
during the downwelling season 1989–1990, when several ⫺QX minima below ⫺1.0×10³ m3 s⫺1 km⫺1
were observed (Fig. 2(c)). In contrast, the wind patterns during 1990 were particularly unfavourable for
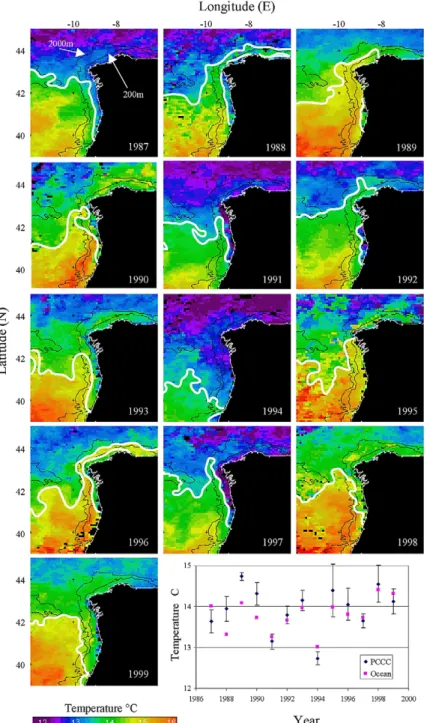
PCCC development, and only a brief trough in S[⫺QX] was observed during the autumn. Pathfinder SST
data for each January between 1987 and 1999 are shown in Fig. 3. The PCCC between 42° and 44°N is
evident as a warming in most years, usually extending well into the Bay of Biscay in particular during 1990 (and 1996), but with notable exceptions in 1991 (and 1994). Hence, the exceptionally warm tempera-ture anomaly (+1.5°C in the ENACW domain) recorded by Pingree (1994) in January 1990 in the southern Bay of Biscay can be attributed at least in part to the warm PCCC observed off Northern Spain in the winter of 1989–1990. Pingree also indicated that there is little evidence for the presence of a marked PCCC in the winter of 1990–1991. A marked (brief) trough on S[⫺QX] was observed in 1995 (1993).
Although S[⫺QX] during the years 1991, 1992 and 1993 was not particularly favourable for the develop-ment of the PCCC, this feature was observed during cruises GALICIA-XII (September 1991), MORENA-I (May 1993) and MORENA-MORENA-IMORENA-I (November–December 1993) (see later). Under these conditions, wind-stress helps to modulate the intensity of the PCCC, which is induced primarily by geostrophic adjustment of the weak eastward oceanic flow driven by the large-scale meridional baroclinic pressure gradient (Frouin et al., 1990). In this sense, Fig. 3 also shows the average SSTs each January for the slope region influenced by the PCCC in an area delineated by 42° and 43°N, and 9.5° and 10°W. The SST variations correlate well with SST data from along the continental slope north of Spain between 4° and 8°W (see the ‘Centre de Meteorologie Spatiale/Centre de Meteorologie Marine’ data presented in Pingree (1994) in his Fig. 2 during 1987–1993). This is not surprising since a strong PCCC warming on the slope west of Spain is also likely to be reflected in warming along the north coast. However, a stronger warming does not necessar-ily mean a stronger PCCC since the PCCC SST correlates well with average SST in an offshore region (42°–43°N; 11°–13°W; Fig. 3) suggesting that either the interannual temperature variations are caused by larger scale forcing or that the poleward flow induced by the pressure gradient affects a much broader region.
Wind patterns changed completely during the second half of the 1990s, when both the intensity and
duration of the downwelling season increased. The abrupt trough on S[⫺QX] during 1997 demonstrates
that conditions were especially favourable for the development of the PCCC, hence the marked warm water flow seen in January 1998, during cruise CD110b. Finally, a close coupling between the long-term compo-nents of a basin-scale index such as the ‘North Atlantic Oscillation’ (S[NAO]) and a meso-scale index (2° ×2°) such as ⫺QX(S[⫺QX]) is clearly observed in Fig. 2(c).
3.1.3. Event scale variability
It must be emphasised that most of the variability in the⫺QX time series is associated with the short-term bands of period ⱕ30 d (Table 2). The contribution of these events to the total variability averaged 66% during 1981–1998, and ranged from a minimum of 57% in 1995–1996, to a maximum of 79% in 1986–1987. A significant amount of this event scale variability (⬎5%, p ⬍ 0.05) occurred as single modes of variation with periods in the range 13–30 d (Table 2). This event scale periodicity is a characteristic feature of the NW Spain upwelling system (A´ lvarez-Salgado, Roso´n, Pe´rez, & Pazos, 1993; Blanton et al., 1987). However, it should also be noted that significant modes of longer period such as 1/6 (61 d), 1/5 (73 d), 1/4 (91 d) and 1/3 (121 d) of the annual period were also apparent in certain years.
Fig. 3. AVHRR pathfinder 9-km resolution sea-surface temperature images for each January from 1987 to 1999 (monthly composite). The 200 and 2000 m depth contours are marked on each image. The white lines represent the boundaries of the PCCC. Bottom right panel: extracted mean SST for a PCCC ‘box’ 42°–43°N; 9.5°–10°W (±SD) and ocean box 42°–43°N; 11°–13°W (SD omitted for clarity).
3.2. A physical framework for the PCCC off NW Spain
Geopotential anomaly, temperature and salinity distributions have been analysed along this section with the aim of setting the framework necessary to appreciate the chemical and biological features generated by the PCCC off NW Spain (42°–43°N) rather than to contribute further to our already profuse knowledge on the physics of this feature. The distributions allow us to examine the geostrophic velocity fields (Section 3.2.1) and the geometry (Section 3.2.2) of the PCCC—defined by the convergence and divergence fronts observed from the satellite images—under the contrasting conditions observed during the seven cruises. In addition, we describe for the first time a marked seasonal cycle in stratification/mixing in the PCCC domain (Section 3.2.3).
3.2.1. Intensity of the PCCC deduced from the geopotential anomaly fields
The September 1991 cruise was carried out at the time of the autumn transition from upwelling- to
downwelling-favourable coastal winds. The monthly running mean of ⫺QX (Fig. 2(c)) indicates that the
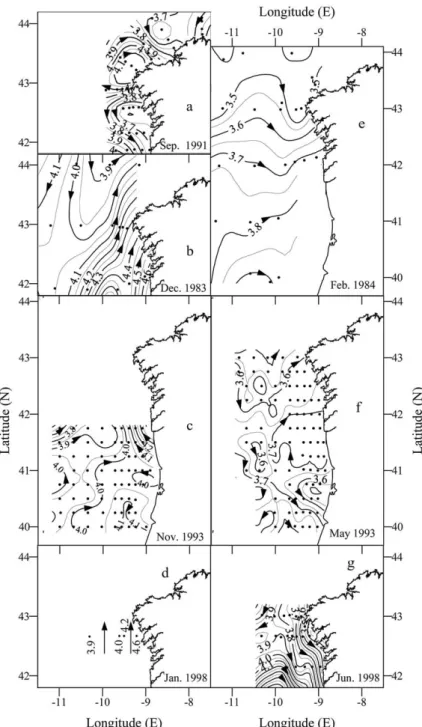
cruise occurred during a low wind-stress period (⫺QX=+90±50 m3 s⫺1km⫺1) after weak downwelling-favourable winds during the previous week. At the start of the cruise, winds (ship measurements) were from the west (stations 11–65; average 4.5 m s⫺1) but by the end of the cruise they had swung round to a northerly direction (stations 71–85; average 5 m s⫺1). As a result of the variable wind pattern, the geopotential anomaly at 10 dbar (Fig. 4(a)) was patchy, varying from poleward flow off the northern coast, to equatorward flow off the western coast, and to off-shelf flow adjacent to the transitional Cape Finisterre transect (43°N). Geostrophic surface flows along a transect (stations 81–85, Fig. 1) were very weak and southerly over the shelf (2 cm s⫺1) but slightly stronger at the slope (4.5 cm s⫺1), which was consistent with hydrographic conditions expected for a transitional wind-calm period at the time of the onset of the PCCC.
PCCC-favourable southerly wind conditions (⫺QX ⬍ 0) prevailed during the late autumn (December
1983 and November–December 1993) and early winter (January 1998) cruises (Fig. 2(c)). The winds (ship measurements) during the December 1983 were from a southerly quarter with average speed of 6.2 m s⫺1. Strong northerly geostrophic surface currents were observed across the southernmost transect from 11°W (⫺11°E) to the coast, with average and maximum velocities of 4 and 10 cm s⫺1, respectively. The PCCC current narrows in the vicinity of Cape Finisterre where it has maximum geostrophic velocities of 10 cm s⫺1 (Fig. 4(b)). In contrast, a weak (average speed, 3 cm s⫺1) southward flowing current (the Portugal current) is observed in the northwestern corner of the domain sampled in December 1983 (stations 7 and
10). Similar values were calculated by Frouin et al. (1990) along 42°N during the MEDPOR/2 cruise
(November 29–December 6, 1983). The winds during the November–December 1993 cruise averaged 7.0
m s⫺1 and so were also PCCC favourable, and a poleward geostrophic current of average speed 6 cm s⫺1
was observed east of 10°W (⫺10°E) along 41°45⬘N (Fig. 4(c)). As observed during the December 1983 cruise, the current narrowed towards the north. It is to be noted that during this cruise the zonal entry of oceanic waters at 41°N marked by the 4.0 m2 s⫺2isoline. Strong southerly winds (average 15 m s⫺1) were experienced during the January 1998 cruise, which restricted sampling to only five stations (Fig. 1). How-ever, these still enabled the identification of a strong poleward geostrophic current of about 13 cm s⫺1 on the shelf (Fig. 4(d)).
As noted above (Section 3.1) the late winter cruise (February–March 1984) coincided with a period of
upwelling-favourable winds during the downwelling season. The average (±SD) monthly running mean of
⫺QX was 185 ± 160 m3 s⫺1 km⫺1, while the mean wind velocity during the cruise was 8.2 m s⫺1, from the northeast. Consequently, weak northeasterly geostrophic currents with maximum velocities of 2.5 cm
s⫺1 dominated the study area (Fig. 4(e)). These conditions can be compared with the monthly running
mean of ⫺QX (190 ± 100 m3 s⫺1 km⫺1; Fig. 2(c)) and the prevailing PCCC-favourable winds
Fig. 4. Horizontal distributions of surface dynamic height (in m2s⫺2) referred to 350 dbar during the GALICIA-XII (September 1991) (a), VI (November–December 1983) (b), MORENA-II (November 1993) (c), CD110b (January 1998) (d), GALICIA-VII (February–March 1984) (e), MORENA-I (May 1993) (f), and Bg9815c (July 1998) (g) cruises. Superimposed on Fig. 5(c) is the conversion of distance among consecutive dynamic height isolines (separated 0.05 m2s⫺2) into geostrophic velocity (cm s⫺1).
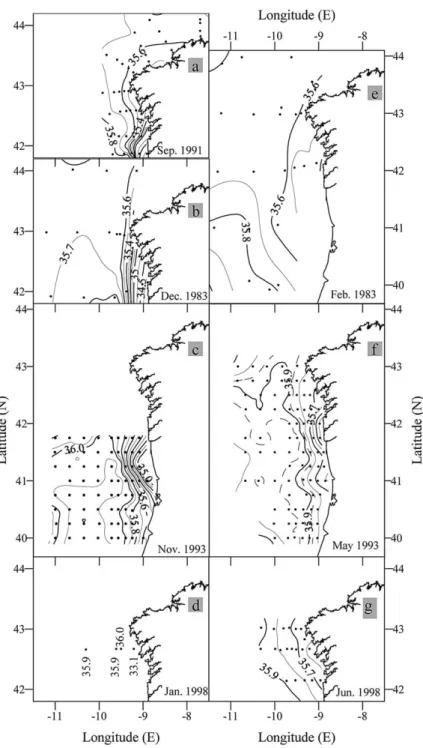
Fig. 5. Horizontal distributions of surface salinity during the GALICIA-XII (September 1991) (a), GALICIA-VI (November– December 1983) (b), MORENA-II (November 1993) (c), CD110b (January 1998) (d), GALICIA-VII (February–March 1984) (e), MORENA-I (May 1993) (f), and Bg9815c (July 1998) (g) cruises.
Fig. 6. Vertical distributions of salinity along the zonal lines indicated in Fig. 1 during the GALICIA-XII (September 1991) (a), GALICIA-VI (November–December 1983) (b), MORENA-II (November 1993) (c), CD110b (January 1998) (d), GALICIA-VII (February–March 1984) (e), MORENA-I (May 1993) (f), and Bg9815c (July 1998) (g) cruises.
geostrophic flow (Fig. 4(f)) clearly shows the zonal entry of the PCCC at 41°N and its northeastward
progression, with a mean velocity of 2.5 cm s⫺1near Cape Finisterre. A weak signal of the Portugal Current is also seen offshore in the northwest corner of the sampling area where there were southward geostrophic
velocities of ~1 cm s⫺1. The PCCC was also observed during April 1982 (McLain, Chao, Atkinson,
Blan-ton, & de Castillejo, 1986), April 1987 (Bode et al., 1990), May 1989 (Maze´ et al., 1997) and May 1993 (Fiu´za et al., 1998). Therefore, the presence of the PCCC off Portugal and NW Spain during the spring appears to be a predominant hydrographic feature.
Fig. 7. Vertical distributions of potential temperature (°C) along the zonal lines indicated in Fig. 1 during the GALICIA-XII (September 1991) (a), GALICIA-VI (November–December 1983) (b), MORENA-II (November 1993) (c), CD110b (January 1998) (d), GALICIA-VII (February–March 1984) (e), MORENA-I (May 1993) (f), and Bg9815c (July 1998) (g) cruises.
As expected, during the summer cruise in June–July 1998, meteorological and hydrographic conditions were very different. The average (±SD) monthly mean of⫺QXwas 390±40 m3s⫺1km⫺1with an average wind velocity during the cruise of 12 m s⫺1 from the northeast, these conditions being typical of steady and strong upwelling. Accordingly, geostrophic flow calculations (Fig. 4(g)) indicated strong southward
geostrophic currents, with an average southward velocity of 5 cm s⫺1 in the study area and maximum
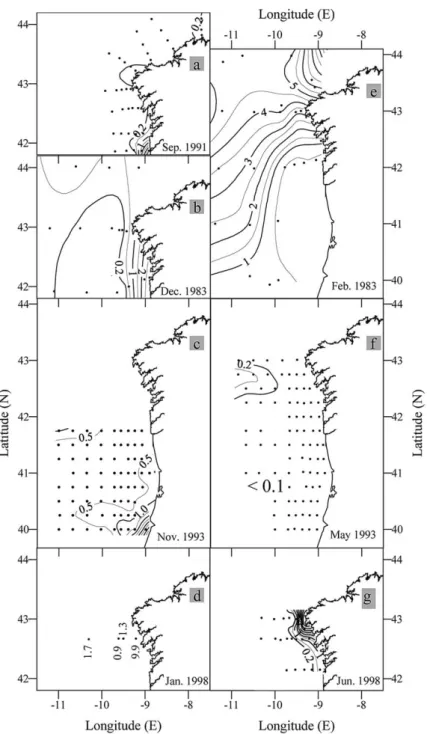
Fig. 8. Horizontal distributions of surface nitrate (µmol kg⫺1) during the GALICIA-XII (September 1991) (a), GALICIA-VI (November–December 1983) (b), MORENA-II (November 1993) (c), CD110b (January 1998) (d), GALICIA-VII (February–March 1984) (e), MORENA-I (May 1993) (f), and Bg9815c (July 1998) (g) cruises.
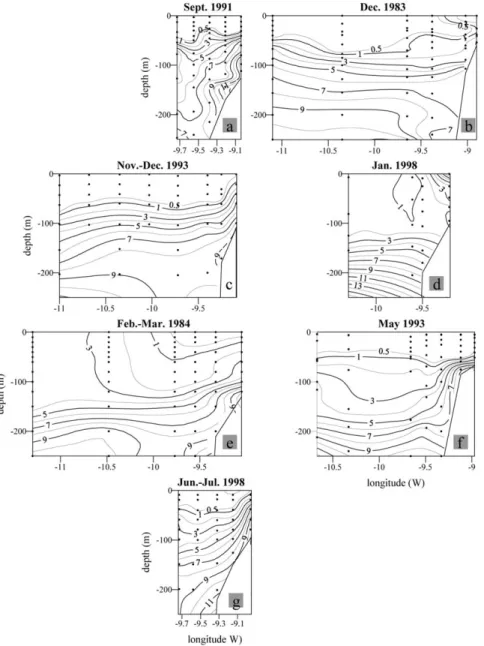
Fig. 9. Vertical distributions of nitrate (µmol kg⫺1) along the zonal lines indicated in Fig. 1 during the GALICIA-XII (September 1991) (a), VI (November–December 1983) (b), MORENA-II (November 1993) (c), CD110b (January 1998) (d), GALICIA-VII (February–March 1984) (e), MORENA-I (May 1993) (f), and Bg9815c (July 1998) (g) cruises.
3.2.2. Oceanic and coastal boundaries of the PCCC
The presence of poleward flowing slope currents along oceanic eastern boundaries is usually accompanied by a clear thermohaline signal resulting from the transport of anomalously warm and salty waters (Mooers,
1989). In our case, the PCCC was conveying surface and central waters of subtropical origin (s0 ⬍
27.0 kg m⫺3) into the study region. In both the AVHRR images (Fig. 1) and the horizontal distributions of surface salinities (Fig. 5) the PCCC shows up as an elongated core of high temperature and high salinity water in the CTZ off the NW Iberian Peninsula.
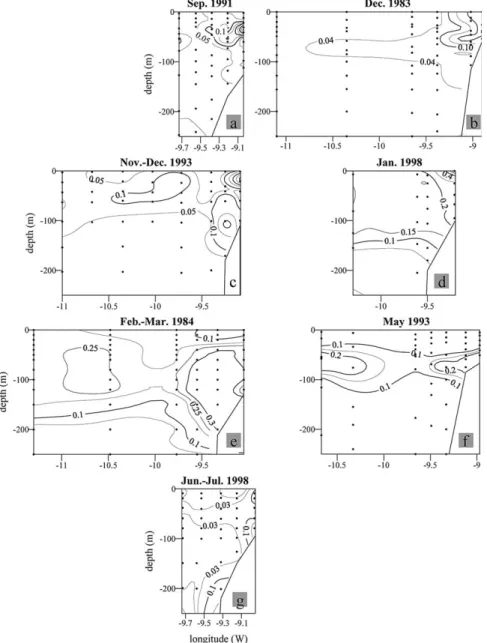
Fig. 10. Vertical distributions of nitrite (µmol kg⫺1) along the zonal lines indicated in Fig. 1 during the GALICIA-XII (September 1991) (a), VI (November–December 1983) (b), MORENA-II (November 1993) (c), CD110b (January 1998) (d), GALICIA-VII (February–March 1984) (e), MORENA-I (May 1993) (f), and Bg9815c (July 1998) (g) cruises.
Satellite imagery (Fig. 3) indicates that there were thermal fronts at the coastal and oceanic boundaries of the PCCC. A band, or patches, of cool water adjacent to the west coast was separated from the warmer PCCC waters over the continental slope by a clear convergence front. There is, however, interannual variability and clearly defined fronts that occurred only in 1987, 1990, 1991, 1996, and 1997. In other years there were either only small patches of cool water, as in 1992, or there was a complete absence of cool surface water, as in 1989 at 42°N. The front accumulates low salinity and cool waters on the shelf originating from the discharge from the Rı´as Baixas, which are four large coastal inlets of NW Spain that
receive continental waters from a 7 × 10³ km2 drainage basin (Fig. 1). In 1987–1996 average seasonal
cycle of continental runoff to the Rı´as Baixas increased from 35 l s⫺1km⫺2in September to 70 l s⫺1km⫺2
in November followed by a decrease to 63 l s⫺1 km⫺2 in January and 40 l s⫺1 km⫺2 in May (Nogueira
et al., 1997). In agreement with the seasonal pattern of riverine discharge, the salinity gradient is especially pronounced during late autumn and early winter (Fig. 5(d)). During the early autumn (September 1991; Fig. 5(a)) and spring (May 1993; Fig. 5(f)), the inshore salinity gradient had become less pronounced and the front then appeared along the shelf break, apparently strongly related to the bottom topography (Bode et al., 1990; Fiu´za et al., 1998; Haynes & Barton, 1990). The coastal band of cool water (Fig. 1) develops in late autumn, when the whole water column begins to cool as a result of net heat loss from the surface (Fiu´za, 1984; Pe´rez et al., 1998). The coastward penetration of the PCCC depends on the relative intensity of shelf winds and intensity of the local continental runoff that activates the residual circulation pattern of the Rı´as Baixas. A recent study by A´ lvarez-Salgado, Gago, Miguez, Gilcoto, and Pe´rez (2000) demonstrates that penetration of PCCC waters into the Rı´as Baixas occurs when QX/ Rⱖ7(±2), with QXin units of m3 s⫺1 km⫺1 and R (continental runoff) in units of m3 s⫺1.
The oceanwards boundary of the PCCC is characterised by a more diffuse divergence front that separates the subtropical water associated with the PCCC from the fresher and cooler open ocean water coming from the north. This outer front is apparent in the AVHRR SST images (Fig. 1) and in the horizontal distributions of salinity in the NW corner of the survey box for the December 1983, February–March 1984, May 1993 and November–December 1993 cruises (Fig. 5(b), (c), (e) and (f)).
Comparison of Fig. 5(b) (December 1983) and Fig. 5(e) (February–March 1984) indicates that the
pole-ward flow was stronger and better-defined in December (SSS ⬎ 35.7 at 42°–43°N) than in February
(SSS⬍ 35.7). This anomaly is probably related to the stratification and the dominance of strong southerly winds in December 1983 whereas in February–March 1984 the stratification had overturned and winter mixed conditions and weak northerly winds prevailed, as reflected in the geopotential anomaly fields (Fig. 5(b) and (e)). There were also differences in the poleward flows between May 1993 (Fig. 5(f)) and Nov-ember–December 1993 (Fig. 5(c)). The high salinity core of the PCCC had penetrated from offshore near 41°N during the late spring cruise, but during the late autumn cruise there were two branches of the PCCC: a northeastward flowing branch, which was also observed during the spring cruise (at 41°N), and a north-ward flowing branch on the southern side of the study area (at 40°N). This double structure is consistent with the calculated geostrophic flows (Fig. 4(c) and (f)) and is indicative of a southward displacement of the origin of the PCCC as the year progresses (A´ lvarez-Salgado et al., 1993).
3.2.3. Vertical structure of the PCCC: a seasonal cycle of stratification/mixing
A subsurface high salinity (⬎35.9) core centred around a depth of 50–100 m was observed at the slope stations during the early autumn (September 1991; Fig. 6(a)), late autumn (December 1983 and November– December 1993; Fig. 6(b) and (c)), late spring (May 1993; Fig. 6(f)) and summer (June–July 1998; Fig. 6(g)). A corresponding V-shape of the isotherms occurs in the vicinity of the high salinity core during the periods of the onset (Fig. 7(a)) and cessation (Fig. 7(f)) of the PCCC. The presence of the core during the early autumn is a consequence of the transitional upwelling/downwelling-favourable conditions recurrently observed at these particular times and indicates the presence of previously upwelled ENACW over the shelf, where it is confined by the PCCC. During the downwelling-favourable late autumn and early winter cruises (Fig. 7(b), (c) and (d)) the isotherms slope downwards in the onshore direction, intercepting the bottom at the shelf break. The same structure is retained during the slightly upwelling-favourable late winter cruise (Fig. 7(e)) and reflects at depth the corresponding convergence front between coastal and PCCC waters observed in the surface layer. During the summer cruise, the isotherms sloped upwards in the inshore direction (Fig. 7(g)), indicating vigorous upwelling of ENACW with the high salinity core (Fig. 6(g)) tracing the northward displacement of the summer Portugal Coastal Undercurrent (Batteen, Martinez, Bryan, & Buch, 2000).
The subsurface salinity maximum develops in late spring, when a very shallow thermocline overlies the deeper remnants of the saltier mixed layer of ENACW from the previous winter (Fiu´za et al., 1998). At this time, the salinity difference between the surface and the high salinity core is ⬍0.1 (Fig. 6(f)). The high salinity core is maintained beneath the seasonal thermocline during the summer (Fig. 6(g)) and early autumn (Fig. 6(a)) and surfaces from late autumn to late winter in the PCCC domain (Fig. 7(c), (d) and (e)), in tandem with the increased mixing conditions in the surface layer. Thus, the upper mixed layer depth in the PCCC domain progressively increases from 20 m in early autumn (with maximum surface
temperatures ⬎20 °C), to 60 m in late autumn (SST ⬎ 15.5 °C), to 125 m in early winter (SST ⬍ 15
°C) and to 150 m in late winter (SST ⬍ 14 °C). The situation in December 1983 (Figs. 6(b) and 7(b))
was exceptional, with temperatures⬎17 °C over the upper mixed layer and a marked subsurface salinity
maximum, in sharp contrast with the observation of a temperature of 15 °C over the 60 m thick mixed
layer in November 1993. As indicated in Section 3.1, the wind field in 1983–1984 was especially favourable for the development of the PCCC, while it was unfavourable in 1993–1994 (Fig. 2(d)).
3.3. New insights on the effects of the PCCC on the distributions of chemical parameters
Horizontal and vertical distributions of selected chemical tracers show the imprint of the PCCC in the coastal, transitional and oceanic waters off NW Spain. The domain of the PCCC is characterised by low surface nutrient concentrations relative to the surrounding coastal and oceanic waters. Relatively high car-bon and nutrients and low oxygen concentrations were observed in the ENACW domain as a consequence of oceanic mineralisation (Section 3.3.1) and nitrite is revealed as a tracer of stratification/mixing conditions and associated trophic status of the PCCC (Section 3.3.2).
The convergence front between the PCCC and coastal waters results in a reduction of the off-shelf export of primary production, and so enhances in situ sedimentation and pelagic/benthic mineralisation processes on the shelf which, in turn, affects carbon, nutrient and oxygen distributions. In contrast, the local upwelling along the divergent front between the PCCC and the surrounding oceanic water enhances vertical fluxes of nutrients to the nitrogen-exhausted surface layer. Nutrient enrichment of shelf bottom waters has been discussed by A´ lvarez-Salgado et al. (1997), A´lvarez-Salgado et al. (1993), and Prego and Bao (1997), hence here we only illustrate the vertical distributions of NO3⫺(Fig. 9) to indicate the substantial nutrient
enrichment in shelf bottom waters relative to ENACW of the same temperature in the surrounding ocean. This contrast was especially intense during the onset (Fig. 9(a)) of the PCCC, when there was an increase in nitrate concentrations in 13–13.5°C water from⬍7µmol kg⫺1in the ocean domain to⬎11µmol kg⫺1 over the shelf. Nutrient enrichment in bottom shelf waters was also marked during the late autumn cruise (November–December 1993; Fig. 9(c)), the late winter cruise (February–March 1984; Fig. 9(e)) and during the cessation of the PCCC (May 1993; Fig. 9(f)). In contrast, nutrient-poor PCCC waters occupied the bottom inner shelf during January 1998 (Fig. 9(d)). During June–July 1998 the parallel configuration between temperature (Fig. 7(g)) and NO3⫺ profiles (Fig. 9(g)) indicates that there was a reduction in the
nutrient enrichment during strong upwelling event.
Horizontal distributions of NO3⫺ (Fig. 8) show relatively high nutrient concentrations in the surface
layer of the coastal domain during the late autumn (December 1983) and early winter (January 1998) cruises as a result of the accumulation of the nutrient-rich, low salinity (Figs. 5 and 6) continental waters then being discharged from the Rı´as Baixas (Pe´rez, A´ lvarez-Salgado, Roso´n, & Rı´os, 1992). Surface
nutri-ents in the coastal domain were very low (⬍0.2 µmol kg⫺1 NO3⫺) during both the onset (September
1991; Fig. 8(a)) and cessation phases (May 1993; Fig. 8(f)) of the PCCC. Whereas the enhanced nutrient concentrations observed on the southern side of the coastal domain during the November–December 1993 cruise (Fig. 8(c)) resulted from intense vertical mixing and entrainment of nutrient-rich deeper waters rather than from land runoff, as indicated by the high salinity of the surface waters (Fig. 5(c)) and the homo-geneous vertical profiles of the thermohaline and of the chemical tracers at stations 72 and 73 (not shown).
High surface nutrient concentrations observed during the summer cruise (June–July 1998), mainly in the Cape Finisterre area (⬎6 µmol kg⫺1 NO3⫺), were a result of upwelling, as indicated by the low SST in
the coastal domain (Fig. 1). The vertical NO3⫺ profiles (Fig. 9) support this conclusion. It is remarkable
also that the weak salinity stratification of coastal waters observed during the February–March 1984 cruise
(Fig. 6(e)) kept NO3⫺ concentrations below those recorded in the vigorously mixed PCCC and oceanic
waters (Fig. 9(e)).
3.3.1. Chemistry of surface and central waters transported by the PCCC
The principal attribute of the subtropical surface waters transported by the PCCC to the Eastern North Atlantic temperate/subpolar transition area is their lower nutrient concentrations relative to both the adjacent coastal and oceanic waters. This is clearly shown in the surface (Fig. 8) and vertical (Fig. 9) distributions of NO3⫺. The effect on nutrient distributions of the divergent front in juxtaposition to the oceanic waters
is clearly evident in the relatively high surface nutrients in the NW corner of the November–December 1993 (Fig. 8(c)) and May 1993 (Fig. 8(f)) cruises. In the PCCC domain, surface NO3⫺concentrations were
usually⬍0.5µmol kg⫺1, except during the period when winter mixing deepened the mixed layer to 125– 150 m when concentrations rose to 1.5–2.0µmol kg⫺1. For comparison, surface NO3⫺concentrations were
⬎4 µmol kg⫺1 in the oceanic domain west of the PCCC flow. These low NO3⫺ values in the surface
waters of the PCCC have important implications for the extension of the spring bloom. Assuming a
Chl-a production to NO3⫺ consumption ratio of 1:1 (the theoretical maximum for phytoplankton of Redfield
composition; Anderson, 1995), Chl-a levels at the time of the spring bloom will never exceed 2 mg m⫺3
in the PCCC domain. Evidence supporting this comes from the SeaWiFS monthly composites for 1998, 1999 and 2000 (not shown): in the region influenced by the PCCC (40.5°–41.5°N, 9.5°–11°W) the spring
chlorophyll maximum is ~1 mg m⫺3. Since HPO4
2⫺and SiO
4H4 excesses of 0.03–0.04 and 0.5–1.5 µmol
kg⫺1, respectively, were maintained in waters with NO3⫺ ⬍0.1 µmol kg⫺1 (not shown), it seems that
nitrogen is the limiting nutrient for primary production in surface PCCC waters.
AOU can be used as an indicator of the balance of physical (net exchange across the air–sea interface) and biogeochemical (production/mineralisation) processes operating in surface PCCC waters. Primary pro-duction is the dominant process contributing to AOU during the onset of the PCCC (September 1991
cruise), inducing average AOU values of ⫺10 µmol kg⫺1 (not shown), whereas in the coastal domain
AOU was of the order of⫺40µmol kg⫺1. These numbers agree with the primary production rates recorded during the September 1991 cruise, which were 4–6 times higher in the coastal than in the PCCC domain
(Section 3.4.3). Oxygen concentrations in PCCC waters were in equilibrium with the atmosphere (⫺1.0
⬍ AOU ⬍ 2.0µmol kg⫺1) during the late autumn and early winter cruises, most probably because of the low primary production (Section 3.4.3) and enhanced air-sea exchange (intense coastal winds, Section 2.2). At this time, slight regeneration was observed in the coastal domain, where the average AOU was+8µmol
kg⫺1. During the late winter cruise, weak mineralisation dominated in the PCCC domain (average AOU,
+4µmol kg⫺1) but intense primary production occurred in the coastal domain (average AOU, ⫺30µmol kg⫺1), suggesting that the onset of the spring bloom had taken place in coastal waters off NW Spain by
that time. Variable AOU values, ranging from⫺5 to ⫺20 µmol kg⫺1, were observed both in the PCCC
and in the coastal domains during the late spring cruise.
In our analysis of the chemical features of ENACW transported by the PCCC, seawater samples between
the shallow ENACWst salinity maximum at 26.6–26.8 s0 (50–100 m depth) and the deep ENACWsp
salinity minimum at 27.2s0 (450–500 m depth) have been selected from the set of sampling stations in
the area defined by latitudes 42° and 43°N, and longitudes 11°W (⫺11°E) and the 1000 m isobath. Data from the sampling stations inshore of the 1000 m isobath have been rejected owing to the effect of shelf mineralisation processes on the nutrient–temperature relationships of ENACW. A total of 395 samples have been considered.
tempera-ture and salinity (r=+0.94 Table 3), with ENACW temperatures ranging from 10.5 to 15°C. The standard error of the salinity (±0.05) and temperature (±0.4°C) estimates from the q/S regression are of the order of magnitude of the variability observed for ENACW by Pe´rez et al. (1995). These authors found a decadal
cycle of salinity/temperature changes of ENACW in parallel to the decadal changes of ⫺QX(Fig. 2(d)).
Accordingly, a clear salinity excess of+0.05 and/or temperature deficit of⫺0.4°C were/was observed at the time of GALICIAXII (1991), and MORENAI and II (1993) compared with the GALICIAVI and -VII (1983–1984) and the CD110b and Bg9815c (1998).
The chemical characteristics of ENACW transported by the PCCC have been studied by regression analysis of selected samples. CT, nitrate and phosphate show a significant negative correlation with
tempera-ture throughout the ENACW domain (r⬍ ⫺0.89; Table 3). CThas been normalised to salinity 35.0 and
corrected for calcium carbonate precipitation-dissolution (NCTcor) by subtracting⫺0.5 ×(NTA + NO3),
according to Broecker and Peng (1982). We find that a quadratic regression model provides a better expla-nation for the silicate–temperature relationship (r = ⫺0.94), indicating that ENACWsp is silicate-richer than ENACWst. This maybe expected from the relatively higher silica fluxes in subpolar than in subtropical waters (Nelson, Treguer, Brzezinski, Leynaert, & Queguiner, 1995). The regression was lower in the case
of the AOU of ENACW transported by the PCCC (r=⫺0.82). A´lvarez-Salgado et al. (2002) have recently
pointed out that the nutrient anomalies of the regressions with temperature (⌬NO3⫺, HPO42⫺and⌬SiO4H4)
are not significantly correlated with the corresponding salinity anomalies (⌬S; r ⬍ 0.20), suggesting that nutrient anomalies are the result of the observed decadal changes in the thermohaline properties of ENACW.
Our study confirms a similar observation for the AOU and NCTcor anomalies (⌬AOU and ⌬NCTcor).
Assuming that temperature removes the effect of ENACW mixing, then the ⌬AOU, ⌬NCTcor, ⌬NO3⫺,
⌬HPO4
2⫺and⌬SiO
4H4variabilities must result from differences in biogeochemical processes. Thus, carbon
and nutrient anomalies were well correlated, with a C/N/P molar ratio of 108 ± 12 / 16.7 ±0.6 / 1 (Table 3), indicating that the anomalies were the result of rapid mineralisation of sinking organic particles of Redfield composition (Anderson & Sarmiento, 1994). Silicate and nitrate anomalies were also well corre-lated (r=+0.79), with an N/Si molar ratio of 2.4±0.1. Following the Redfield ratios observed in carbon
and nutrient anomalies, an ⌬AOU/⌬NO3⫺ ratio of 9–10 molO2 molN⫺1 would be expected. However,
despite the relatively high correlation between AOU and nitrate anomalies (r = +0.92), the O2/N molar
ratio was only 6.8±0.2; that is about 70% of the expected Redfield value. This would seem to result from the study area being within the North Atlantic ventilated thermocline where the ENACWsp forms (Castro, Pe´rez, Holey, & Rı´os, 1998). As a consequence, AOU levels in the cold and nutrient-rich ENACWsp
Table 3
Equations, correlation coefficients (r) and number of data points (n) used in AOU (µmol kg⫺1), NC
T(µmol kg⫺1), nutrient (µmol kg⫺1) and salinity temperature (°C) regressions and their anomalies for the selected ENACW samples
Regression equation r n S(±0.05)=35.792(±0.003)+0.121(±0.002)×[q⫺13] +0.94 395 AOU(±8.8)=21.9(±0.5)⫺12.0(±0.4)×[q⫺13] ⫺0.82 390 NCTcor(±8.6)=917(±1)⫺19.5(±0.4)×[q⫺13] ⫺0.92 382 NO⫺3(±1.3)=6.1(±0.1)⫺3.43(±0.07)×[q⫺13] ⫺0.94 382 HPO2⫺4 (±0.08)=0.38(±0.01)⫺0.180(±0.004)×[q⫺13] ⫺0.92 375 SiO4H4(±0.5)=1.89(±0.04)⫺[1.04(±0.03)⫺0.26(±0.02)×(q⫺13)]×[q⫺13] ⫺0.94 379 ⌬AOU(±4.8)=6.8(±0.2)×⌬NO⫺3 +0.84 359 ⌬NCTcor(±6.9)=6.5(±0.5)×⌬NO⫺3 +0.57 359 ⌬NO⫺ 3(±0.7)=16.7(±0.6)×⌬HPO2⫺4 +0.83 359 ⌬NO⫺ 3(±0.8)=2.4(±0.1)×⌬SiO4H4 +0.79 359