MACHINE LEARNING FOR DISEASE OUTBREAK DETECTION USING PROBABILISTIC MODELS
NASTARAN JAFARPOUR KHAMENEH
DÉPARTEMENT DE GÉNIE INFORMATIQUE ET GÉNIE LOGICIEL ÉCOLE POLYTECHNIQUE DE MONTRÉAL
THÈSE PRÉSENTÉE EN VUE DE L’OBTENTION DU DIPLÔME DE PHILOSOPHIÆ DOCTOR
(GÉNIE INFORMATIQUE) DÉCEMBRE 2014
c
ÉCOLE POLYTECHNIQUE DE MONTRÉAL
Cette thèse intitulée :
MACHINE LEARNING FOR DISEASE OUTBREAK DETECTION USING PROBABILISTIC MODELS
présentée par : JAFARPOUR KHAMENEH Nastaran en vue de l’obtention du diplôme de : Philosophiæ Doctor a été dûment acceptée par le jury d’examen constitué de :
M. GALINIER Philippe, Doctorat, président
M. DESMARAIS Michel C., Ph.D., membre et directeur de recherche Mme PRECUP Doina, Ph.D., membre et codirectrice de recherche M. PAL Christopher J., Ph.D., membre
ACKNOWLEDGEMENTS
I would like to express my deepest gratitude to my advisor Doina Precup who has provided constant guidance and encouragement throughout my research at McGill University. I deeply thank my advisor Michel Desmarais for his time and support during my studies at Ecole Polytechnique de Montreal. I do not know where my research would go without their patience and efforts.
I am sincerely grateful to David L. Buckeridge for his invaluable guidance and also funding this research. Also, I would like to express my special appreciation and thanks to Masoumeh Izadi for her great support and time in progressing the research.
I am using this opportunity to express my gratitude to Anya Okhmatovskaia and Aman Verma for providing the simulated data used in this research and their constant help in addressing related issues. I also thank Rolina van Gaalen for co-working in Cost analysis.
I thank the former and current members of the Reasoning and Learning Lab in the School of Com-puter Science at McGill. I consider myself fortunate to benefit tremendously from such a creative and smart group of people. I am sincerely thankful to my labmates in Department of Computer Engineering at Ecole Polytechnique de Montreal and members of Surveillance Lab in the Clinical and Health Informatics Research Group at McGill University.
I would like to thank administrative staff and system administrators in the School of Computer Science and Surveillance Lab at McGill, and Department of Computer Engineering at Ecole Poly-technique de Montreal for their incredible helps.
At the end, words cannot express how grateful I am to my family who never stopped supporting me even from distance. A special thanks to my friends who always inspire me to strive towards my goals.
RÉSUMÉ
L’expansion de maladies connues et l’émergence de nouvelles maladies ont affecté la vie de nombreuses personnes et ont eu des conséquences économiques importantes. L’Ébola n’est que le dernier des exemples récents. La détection précoce d’infections épidémiologiques s’avère donc un enjeu de taille. Dans le secteur de la surveillance syndromique, nous avons assisté récemment à une prolifération d’algorithmes de détection d’épidémies. Leur performance peut varier entre eux et selon différents paramètres de configuration, de sorte que l’efficacité d’un système de surveillance épidémiologique s’en trouve d’autant affecté. Pourtant, on ne possède que peu d’évaluations fiables de la performance de ces algorithmes sous différentes conditions et pour différents types d’épi-démie. Les évaluations existantes sont basées sur des cas uniques et les données ne sont pas du domaine public. Il est donc difficile de comparer ces algorithmes entre eux et difficile de juger de la généralisation des résultats. Par conséquent, nous ne sommes pas en mesure de déterminer quel d’algorithme devrait être appliqué dans quelles circonstances.
Cette thèse poursuit trois objectifs généraux : (1) établir la relation entre la performance des algorithmes de détection d’épidémies et le type et la sévérité de ces épidémies, (2) améliorer les prédictions d’épidémies par la combinaison d’algorithmes et (3) fournir une méthode d’analyse des épidémies qui englobe une perspective de coûts afin de minimiser l’impact économique des erreurs du type faux positifs et faux négatifs.
L’approche générale de notre étude repose sur l’utilisation de données de simulation d’épidémies dont le vecteur de transmission est un réseau d’aqueducs. Les données sont obtenues de la plate-forme de simulation SnAP du Department of Epidemiology and Biostatistics Surveillance Lab de l’université McGill. Cette approche nous permet de créer les différentes conditions de types et d’in-tensités d’épidémiologie nécessaires à l’analyse de la performance des algorithmes de détection.
Le premier objectif porte sur l’influence des différents types et différentes intensités d’épidémio-logie sur la performance des algorithmes. Elle est modélisée à l’aide d’un modèle basé sur un réseau bayésien. Ce modèle prédit avec succès la variation de performance observée dans les données. De plus, l’utilisation d’un réseau bayésien permet de quantifier l’influence de chaque variable et relève aussi le rôle que jouent d’autres paramètres qui étaient jusqu’ici ignorés dans les travaux antérieurs, à savoir le seuil de détection et l’importance de tenir compte de récurrences hebdomadaires.
Le second objectif vise à exploiter les résultats autour du premier objectif et de combiner les algorithmes pour optimiser la performance en fonction des facteurs d’influence. Les résultats des algorithmes sont combinés à l’aide de la méthode de Mixture hiérarchique d’expert (Hierarchical Mixture of Experts—HME). Le modèle HME est entraîné à pondérer la contribution de chaque algorithme en fonction des données. Les résultats de cette combinaison des résultats d’algorithmes sont comparables avec les meilleurs résultats des algorithmes individuels, et s’avèrent plus robustes à travers différentes variations. Le niveau de contamination n’influence pas la performance relative du modèle HME.
Finalement, nous avons tenté d’optimiser des méthodes de détection d’épidémies en fonction des coûts et bénéfices escomptés des prédictions correctes et incorrects. Les résultats des algorithmes de détection sont évalués en fonction des décisions possibles qui en découlent et en tenant compte de données réelles sur les coûts totaux d’utilisation des ressources du système de santé. Dans un premier temps, une régression polynomiale permet d’estimer le coût d’une épidémie selon le délai de détection. Puis, nous avons développé un modèle d’apprentissage d’arbre de décision qui tient compte du coût et qui prédit les détections à partir des algorithmes connus. Les résultats expérimen-taux démontrent que ce modèle permet de réduire le coût total des épidémies, tout en maintenant le niveau de détection des épidémies comparables à ceux d’autres méthodes.
ABSTRACT
The past decade has seen the emergence of new diseases or expansion of old ones (such as Ebola) causing high human and financial costs. Hence, early detection of disease outbreaks is crucial. In the field of syndromic surveillance, there has recently been a proliferation of outbreak detection algorithms. The choice of outbreak detection algorithm and its configuration can result in important variations in the performance of public health surveillance systems. But performance evaluations have not kept pace with algorithm development. These evaluations are usually based on a single data set which is not publicly available, so the evaluations are difficult to generalize or replicate. Furthermore, the performance of different algorithms is influenced by the nature of the disease outbreak. As a result of the lack of thorough performance evaluations, one cannot determine which algorithm should be applied under what circumstances.
Briefly, this research has three general objectives: (1) characterize the dependence of the perfor-mance of detection algorithms on the type and severity of outbreak, (2) aggregate the predictions of several outbreak detection algorithms, (3) analyze outbreak detection methods from a cost-benefit point of view and develop a detection method which minimizes the total cost of missing outbreaks and false alarms.
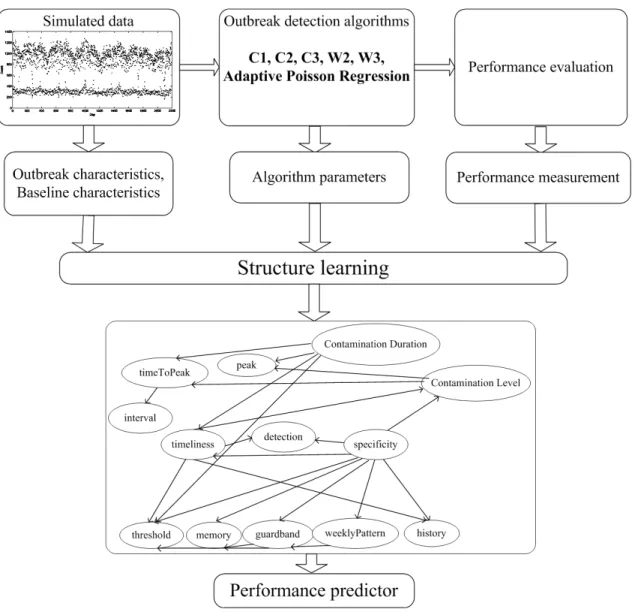
To achieve the first objective, we propose a Bayesian network model learned from simulated outbreak data overlaid on real healthcare utilization data which predicts detection performance as a function of outbreak characteristics and surveillance system parameters. This model predicts the performance of outbreak detection methods with high accuracy. The model can also quantify the influence of different outbreak characteristics and detection methods on detection performance in a variety of practically relevant surveillance scenarios. In addition to identifying outbreak character-istics expected to have a strong influence on detection performance, the learned model suggests a role for other algorithm features, such as alerting threshold and taking weekly patterns into account, which was previously not the focus of attention in the literature.
To achieve the second objective, we use Hierarchical Mixture of Experts (HME) to combine the responses of multiple experts (i.e., predictors) which are outbreak detection methods. The contribution of each predictor in forming the final output is learned and depends on the input data. The developed HME algorithm is competitive with the best detection algorithm in the experimental evaluation, and is more robust under different circumstances. The level of contamination of the surveillance time series does not influence the relative performance of the HME.
The optimization of outbreak detection methods also relies on the estimation of future benefits of true alarms and the cost of false alarms. In the third part of the thesis, we analyze some commonly used outbreak detection methods in terms of the cost of missing outbreaks and false alarms, using simulated outbreak data overlaid on real healthcare utilization data. We estimate the total cost of missing outbreaks and false alarms, in addition to the accuracy of outbreak detection and we fit a polynomial regression function to estimate the cost of an outbreak based on the delay until it is detected. Then, we develop a cost-sensitive decision tree learner, which predicts outbreaks by looking at the prediction of commonly used detection methods. Experimental results show that using the developed cost-sensitive decision tree decreases the total cost of the outbreak, while the accuracy of outbreak detection remains competitive with commonly used methods.
TABLE OF CONTENTS DEDICATION . . . iii ACKNOWLEDGEMENTS . . . iv RÉSUMÉ . . . v ABSTRACT . . . vii TABLE OF CONTENTS . . . ix
LIST OF TABLES . . . xii
LIST OF FIGURES . . . xiii
LIST OF ABBREVIATIONS . . . xiv
CHAPTER 1 INTRODUCTION . . . 1
1.1 Problem Definition and Challenges . . . 1
1.2 Research Questions . . . 3
1.3 General Objectives . . . 4
1.4 Hypotheses . . . 4
1.5 Main Contributions . . . 4
1.6 Publications . . . 6
1.7 Organization Of the Thesis . . . 6
CHAPTER 2 LITERATURE REVIEW . . . 7
2.1 Basic Description of Surveillance Data . . . 7
2.2 Outbreak Detection Algorithms . . . 9
2.2.1 C-algorithms . . . 10
2.2.2 Non-adaptive Log-linear Regression Algorithm . . . 12
2.2.3 Adaptive Log-linear Regression Algorithm . . . 13
2.2.4 Adaptive Poisson Regression Algorithm . . . 14
2.2.5 Generalized Likelihood Ratio Test . . . 17
2.3 Evaluation of Outbreak Detection Algorithms . . . 17
2.3.2 Evaluation Metrics . . . 19
2.4 Evaluation of Learned Hypotheses . . . 21
CHAPTER 3 BAYESIAN NETWORK FOR PREDICTING DETECTION PERFORMANCE 23 3.1 Background . . . 23
3.2 Bayesian Networks . . . 24
3.3 Reduced Error Pruning Tree . . . 29
3.4 Predicting Detection Performance using REP Trees . . . 29
3.5 Predicting Detection Performance using Bayesian Networks . . . 34
3.6 What-if scenarios . . . 43
3.7 Discussion and Conclusion . . . 46
CHAPTER 4 HIERARCHICAL MIXTURE OF EXPERTS FOR OUTBREAK DETECTION 49 4.1 Machine Learning Combining Methods . . . 49
4.1.1 Majority Voting . . . 49
4.1.2 Hierarchical Mixture of Experts . . . 49
4.2 HME for Outbreak Detection . . . 50
4.3 HME for Different Scales of Contamination . . . 53
4.4 HME with Baseline Characteristics . . . 61
4.5 Discussion and Conclusion . . . 62
CHAPTER 5 COST ANALYSIS OF OUTBREAK DETECTION METHODS . . . 64
5.1 Background . . . 64 5.1.1 Cost-sensitive Classification . . . 64 5.1.2 Decision Trees . . . 66 5.1.3 Outbreak Costs . . . 68 5.1.4 Cost Analysis . . . 68 5.2 Experimental Results . . . 70
5.2.1 Simulated Surveillance Data . . . 70
5.2.2 Linear Approximation of Cost Based on Time of Advisory . . . 70
5.2.3 Feature Selection for Outbreak Detection . . . 72
5.2.4 Developing a Decision Tree . . . 73
5.3 Discussion and Conclusion . . . 75
CHAPTER 6 CONCLUSION AND FUTURE WORK . . . 78
6.1 Contributions . . . 78
LIST OF TABLES
Table 2.1 Example of accuracy of detection algorithms . . . 20
Table 3.1 Values of data features used to train and test REP Tree models . . . 31
Table 3.2 Accuracy of predicting sensitivity using REP Tree models . . . 32
Table 3.3 Accuracy of predicting specificity using REP Tree models . . . 33
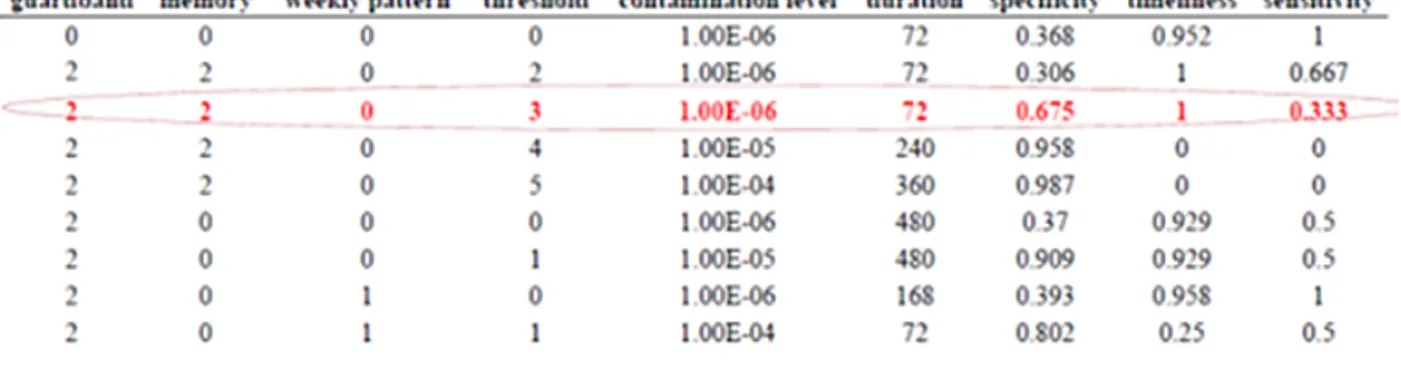
Table 3.4 Values of data features in training data . . . 35
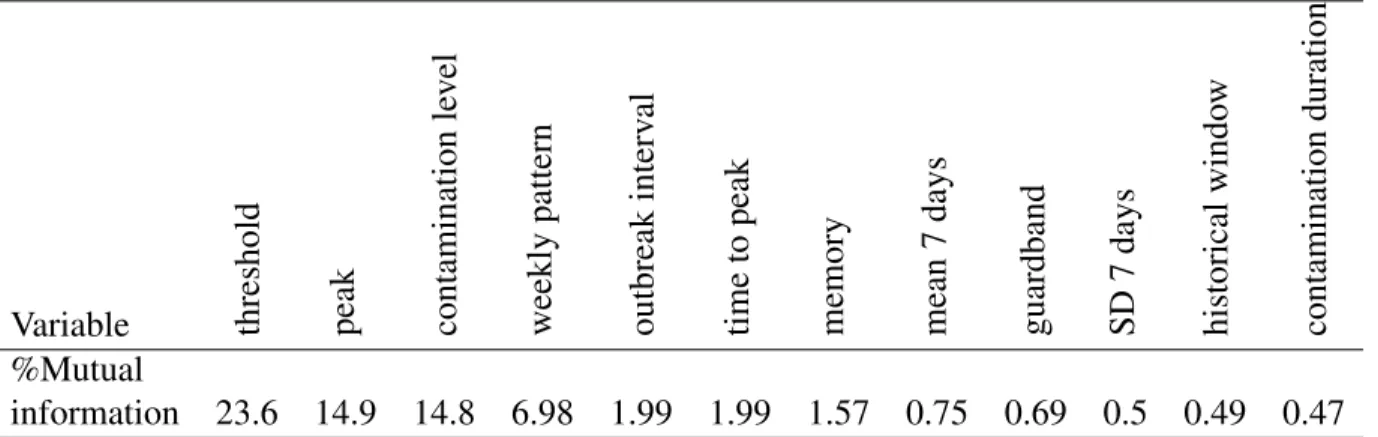
Table 3.5 Mutual information of the sensitivity and variables . . . 38
Table 3.6 Predictions of Bayesian network for different outbreak scenarios . . . 45
Table 4.1 Confusion matrix for binary classification . . . 52
Table 4.2 Detection performance of HME vs. detection algorithms . . . 54
Table 4.3 Timeliness of detection algorithms . . . 61
Table 4.4 Accuracy of HME models . . . 63
Table 5.1 Cost matrix for binary classification . . . 65
Table 5.2 Cost function approximators . . . 72
Table 5.3 The goodness of fit for cost function approximators . . . 72
Table 5.4 Accuracy of outbreak detection by different feature sets . . . 74
Table 5.5 Performance evaluation of outbreak detection algorithms . . . 76
LIST OF FIGURES
Figure 2.1 Seasonal trends and day-of-week effects in surveillance time series . . . . 8
Figure 3.1 Workflow of learning bayesian networks . . . 25
Figure 3.2 Graphical representation of a Bayesian network with three nodes . . . 26
Figure 3.3 Part of training data to learn REP tree models . . . 30
Figure 3.4 REP Tree for predicting sensitivity of detection . . . 31
Figure 3.5 REP Tree for predicting specificity of detection . . . 33
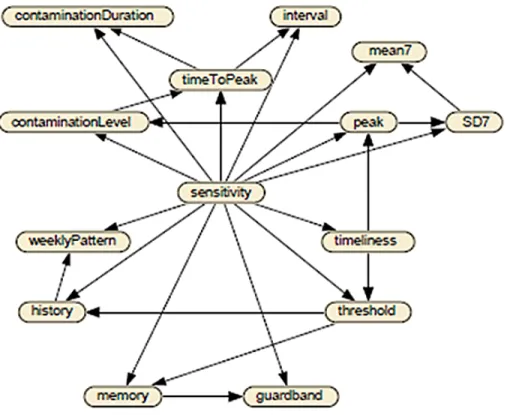
Figure 3.6 Structure of BN for predicting the sensitivity . . . 37
Figure 3.7 ROC curve of prediction of the sensitivity . . . 37
Figure 3.8 Belief bars of BN assuming the specificity of [0.85, 0.9) . . . 40
Figure 3.9 Belief bars of BN assuming the specificity of [0.9, 0.95) . . . 40
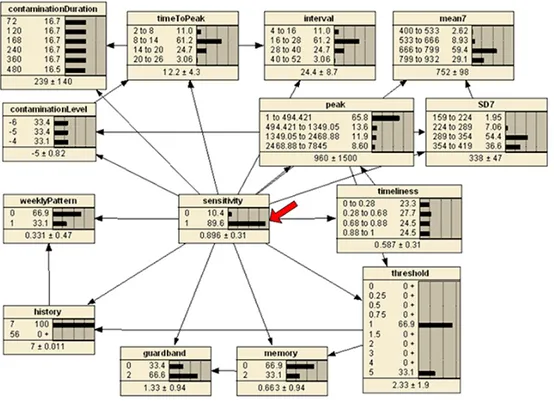
Figure 3.10 Belief bars of BN assuming the specificity of [0.95, 1) . . . 41
Figure 3.11 Belief bars of BN assuming the highest detection performance . . . 42
Figure 3.12 Structure of BN for predicting the sensitivity based on observable variables 42 Figure 3.13 ROC curve of accuracy of the second developed BN in predicting sensitivity 43 Figure 3.14 Belief bars of BN with observable variables . . . 44
Figure 4.1 A two-level hierarchical mixture of experts . . . 51
Figure 4.2 ROC curve of HME structures vs. W2 and W3 . . . 55
Figure 4.3 Workflow of learning combining methods for outbreak prediction . . . 56
Figure 4.4 ROC curve on surveillance time series with low contamination . . . 58
Figure 4.5 ROC curve on surveillance time series with high contamination . . . 59
Figure 4.6 ROC curve on surveillance time series with different scales of contamination 60 Figure 5.1 A decision tree model to issue a boil-water advisory . . . 69
Figure 5.2 Illustration of cost function approximators . . . 71
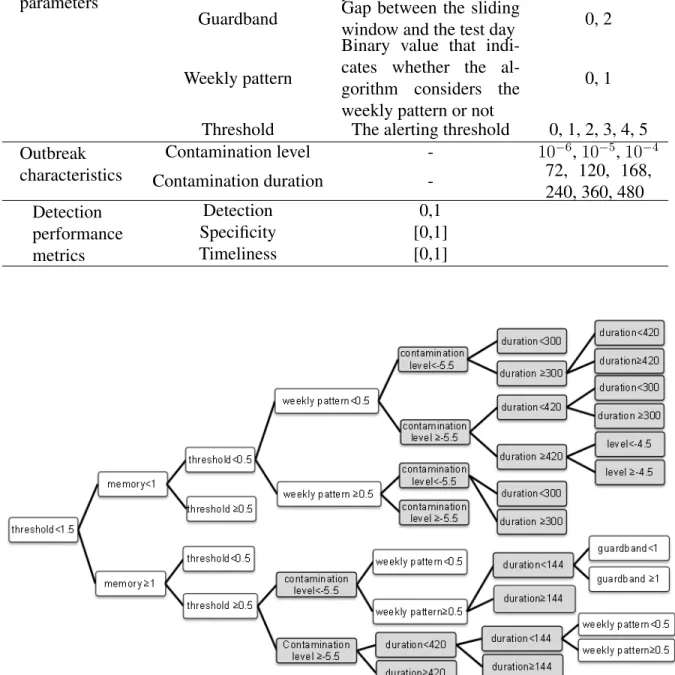
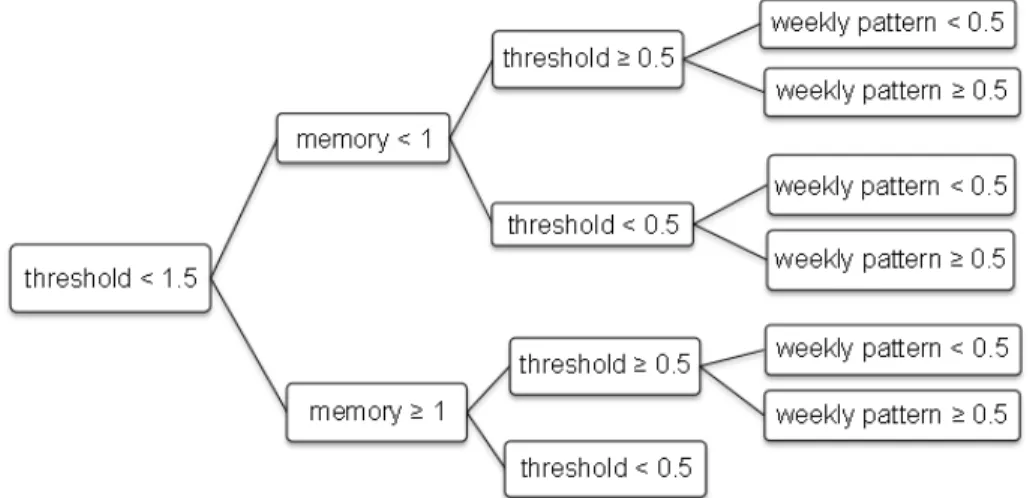
Figure 5.3 Part of regular decision tree . . . 74
LIST OF ABBREVIATIONS
AUC Area Under Curve
BN Bayesian Networks
CPD Conditional Probability Distribution CUSUM Cumulative Sum Control Chart ED Emergency Department
EM Expectation-Maximization
EWMA Exponentially Weighted Moving Average GLRT Generalized Likelihood Ratio Test
HME Hierarchical Mixture of Experts REP Tree Reduced Error Pruning Tree ROC Receiver Operating Characteristic SnAP Simulation Analysis Platform
CHAPTER 1
INTRODUCTION
1.1 Problem Definition and Challenges
Infectious disease outbreaks results in high human and financial costs. The past decade has seen the emergence of diseases caused by previously unrecognized threats or the sudden appearance of known diseases in the environment. For instance, the Centre of Disease Control and Prevention in USA (CDC) estimated that between 43 million and 89 million cases of the new influenza A (H1N1) epidemic occurred between April 2009 and April 2010. Also between 8,880 and 18,300 H1N1-related deaths occurred in the same time frame1. Since the probability of major infectious disease outbreaks is very high, their early detection is a crucial task in order to prevent or reduce the large spread of diseases. Preparing against the risk of future outbreaks may help in managing the delivery of medical care and reduce the huge costs associated with it.
One of the most challenging aspects of public health surveillance is the early recognition of infectious disease outbreaks which have the potential of high morbidity and mortality. Due to the volume of data collected in public health agencies, all data cannot be reviewed manually by surveillance analysts. Modern electronic data collection methods make it necessary to automate outbreak detection processes (Lombardo and Buckeridge, 2007).
Automated surveillance systems can monitor clinical data drawn from multiple sources, with the goal of detecting potential disease outbreaks rapidly and accurately. The role of outbreak detection processing is to screen large volumes of data and issue alerts to draw an epidemiologist’s attention to anomalies (Buckeridge et al., 2008a). Automated health surveillance systems apply statistical algorithms to detect anomalies. When an outbreak occurs, the care-seeking infected population adds a signal to the background data. Detecting these changes in the number of people infected is the basis of calling an outbreak.
Examples of surveillance time series are the daily number of visits to a clinic or hospital, the daily number of over-the-counter sales of specific medicines, school and work absenteeism rates, and others. Some epidemiological investigations use spatial location in surveillance data because a group of patients in a same location who become ill at the same time may indicate a cluster of cases caused by a common exposure. These methods apply different algorithms to detect cases separately for different spatial regions (Lombardo and Buckeridge, 2007). Our work is focused on
time series without special treatment of space.
The detection process of a possible outbreak consists of two phases: the prediction of expected data values, and the determination of anomalies. Using the available data history, also called base-line time series, the prediction phase estimates the quantity of interest for a time interval. An anomaly is determined by calculating the difference between the estimated value and the actual ob-served value and applying statistical methods to decide if the difference is unusual. In addition to prediction-based methods, other anomaly detection approaches, such as searching for unexplained patterns are also possible (Tokars et al., 2009a). However,we will focus on prediction-based algo-rithms, as they are more wide-spread in practice.
An important aspect of a detection algorithm is the computation of the baseline data. The sim-plest approach is to average the number of observed cases over some period of time. However, this approach cannot account for systematic data patterns and may generate irrelevant alarms. For example, visit counts of a clinic which is closed on Sundays and holidays may have a sharp rise on Mondays and after holidays. Frequent statistical alerts will lead to the system being ignored, which in turn will result in a loss of sensitivity to true events and undermine the utility and credibility of the system. Modelling the day-of-week effects, long-term trends, and other known systematic pat-terns will increase the sensitivity of the detection algorithm over repeated cycles of data (Lombardo and Buckeridge, 2007).
Some practical outbreak detection algorithms were derived from probability-based process con-trol charts which are widely used in monitoring industrial processes. These methods help the early recognition of unusual changes in the data under control. For example, outbreak detection methods like the C-family algorithms and adaptive Exponentially Weighted Moving Average (EWMA) were inspired by Cumulative Sum Control Chart (CUSUM) and EWMA control charts. Some detector algorithms adapt regression modelling for syndromic surveillance data. Also, several modifications of these algorithms, like stratification of the data by weekdays versus weekend days and using data ratios instead of absolute data values, have been proposed.
In the field of syndromic surveillance, there has recently been a proliferation of outbreak de-tection algorithms. The choice of outbreak dede-tection algorithm and its configuration can result in important variations in the performance of public health surveillance systems. The performance of these algorithms is evaluated in terms of sensitivity and specificity of detection and time to de-tection. They can also be evaluated in terms of outcomes, such as infections averted. Sensitivity is the probability that a public health event of interest will be detected in the data given that the event really occurred. Specificity is the probability that no health event will be detected when no
such event has in fact occurred (Lombardo and Buckeridge, 2007). Time to detection is the time duration from the beginning of the outbreak to the first day on which the outbreak is detected.
However, evaluations of these new algorithms remain highly circumscribed. These evaluations are usually based on a single data set which is not publicly available, so the evaluations are difficult to generalize or replicate. Furthermore, the performance of different algorithms is influenced by the nature of the disease outbreak. As a result of the lack of thorough performance evaluations, one cannot determine which algorithm should be applied under what circumstances.
The work in this thesis used data provided through simulations from the Surveillance Lab of the Department of Epidemiology and Biostatistics at McGill University. The Simulation Analysis Platform (SnAP), developed by that group is a software infrastructure for the automatic deployment and analysis of multiple runs of a simulation model. Simulation models in this context consist of simulated syndromic data and different types of outbreak scenarios. This platform can efficiently explore the influence of parameter adjustments (Buckeridge et al., 2011). The simulated data will be described in section 2.3.1.
Although using real disease outbreak data seems to be the best option for the evaluation of algo-rithms, it has several drawbacks. First, it is often difficult to precisely determine the starting time and the size of the outbreak. Second, few historical data containing verified real disease outbreaks are available. For this reason, the detection performance is usually evaluated by simulating disease outbreaks. Performance evaluation via simulation can be repeated with variations of outbreak char-acteristics as much as desired and provides ground truth that is not usually available in real data (Lombardo and Buckeridge, 2007).
1.2 Research Questions
In this thesis, we used machine learning methods to explore three questions of great practical importance.
• In the field of syndromic surveillance, how does the performance of outbreak detection algo-rithms depend on the type and severity of outbreaks?
• Can the performance of outbreak detection algorithms, in terms of time to detection, the number of false alerts and true alerts, be improved by combining the prediction of several detection algorithms?
1.3 General Objectives
This research has three general objectives. The first objective is to characterize the dependence of the performance of detection algorithms on the type and severity of outbreak, to develop and evaluate a probabilistic model for discovering determinants of outbreak detection and quantifying the effect of determinants on detection performance, and to predict the performance of outbreak detection algorithms under different circumstances. Having good predictors will guide the method selection and algorithm configuration in surveillance systems.
The second research objective is to study how one can aggregate the predictions of several out-break detection algorithms and investigate whether this can enhance performance, compared to using single methods.
The third objective is to analyze existing outbreak detection methods from a cost-benefit point of view and to develop a detection method whose goal is not only predicting the outbreaks accurately, but also minimizing the total cost of missing outbreaks and false alarms.
1.4 Hypotheses
The research in this thesis tests the following hypotheses:
Hypothesis 1: The performance of detection algorithms depends on the type and severity of outbreaks. Specifically, different algorithms are best for different types of outbreaks.
Hypothesis 2: Aggregating the predictions of different detectors based on performance char-acteristics will improve the performance and the robustness of outbreak detection in syndromic surveillance.
Hypothesis 3: Different detection algorithms are optimal depending on the relative cost of false alarms vs. delays in detection.
1.5 Main Contributions
The main contributions of this thesis can be summarized as follow:
• Our work aimed to characterize the dependence of the performance of detection algorithms on the type and severity of outbreak. For example, if the magnitude of an outbreak is very large, like the SARS exposure, most of the detection methods can pick it up. So, the capability of early recognition of non-obvious outbreaks is the discriminative feature of detectors. We learned a Bayesian network model from simulated outbreak data overlaid on real healthcare utilization
data to predict detection performances as a function of outbreak characteristics and surveillance system parameters. This model can predict the performance metrics of commonly used outbreak detection methods with high accuracy. The model can also quantify the influence of different outbreak characteristics and detection methods on detection performance in a variety of practi-cally relevant surveillance scenarios. In addition to identifying characteristics expected to have a strong influence on detection performance, the learned model suggests a role for other algorithm features which was previously not the focus of attention in the literature. This contribution is discussed in detail in Chapter 3.
• We investigated how outbreak detection methods can be combined in order to improve the over-all detection performance. We used Hierarchical Mixture of Experts (HME), a probabilistic model for combining classification methods which has been well-studied in computer science and statistics. This algorithm uses the divide-and-conquer strategy to combine the responses of multiple experts (i.e., predictors) and form a single response. The contribution of each predictor in forming the final output is adjustable based on the input data. We used simulated surveillance data to train an HME in order to aggregate predictions from several outbreak detection meth-ods. The developed HME algorithm was competitive with the best detection algorithm in the experimental evaluation. The developed detection algorithm based on HME was more robust under different circumstances and the level of contamination of surveillance time series did not influence the relative performance of the HME. This contribution is presented in Chapter 4. • The optimization of outbreak detection methods also relies on the estimation of future benefits
of true alarms and the cost of false alarms. For example, in the case of an anthrax attack, delays of hours in detection and taking the decision to intervene can lead to hundreds of lives lost and millions of additional expenses (Izadi and Buckeridge, 2007). On the contrary, if the system generates many false alarms, the alarms will be ignored by public health personnel and the cred-ibility of the system decreases. So cost is an important determinant in selecting optimal outbreak detection methods. We analyzed some commonly used outbreak detection methods in terms of the cost of missing outbreaks and false alarms, using simulated outbreak data overlaid on real healthcare utilization data. We estimated the total cost of missing outbreaks and false alarms, in addition to the accuracy of outbreak detection. We fitted a polynomial regression function to estimate the cost of an outbreak based on the delay until it is detected. Then, we devel-oped a cost-sensitive decision tree learner, which predicts outbreaks by looking at the prediction of commonly used detection methods. Experimental results showed that using the developed cost-sensitive decision tree decreased the total cost of outbreak, while the accuracy of outbreak detection remained competitive with commonly used methods. The cost- benefit analysis and proposed algorithm are discussed in Chapter 5.
This research mainly focuses on temporal outbreak detection algorithms; however many of these concepts and techniques will be applicable in the spatio-temporal setting too.
1.6 Publications
1. N. Jafarpour, D. Precup, M. Izadi, D. L. Buckeridge, “Cost Analysis of Outbreak Detection Methods”, Submitted in Journal of Artificial Intelligence in Medicine.
2. N. Jafarpour, D. Precup, “Cost Analysis of Outbreak Detection Methods”, Poster in Women in Machine Learning Workshop (WiML 2014), Co-located with NIPS, December 2014, Mon-treal, CANADA.
3. N. Jafarpour, M. Izadi, D. Precup, D. L. Buckeridge, “Quantifying the Determinants of Outbreak Detection Performance through Simulation and Machine Learning”, Journal of Biomedical Informatics, November 2014.
4. N. Jafarpour, D. Precup, M. Izadi, D. L. Buckeridge, “Using Hierarchical Mixture of Ex-perts Model for Fusion of Outbreak Detection Methods”, American Medical Informatics Association Annual Symposium (AMIA 2013), November 2013, Washington D.C., US. 5. N. Jafarpour, D. Precup, D. L. Buckeridge, “Determinants of Outbreak Detection
Perfor-mance”, International Society for Disease Surveillance (ISDS 2012), December 2012, San Diego, US.
1.7 Organization Of the Thesis
We review some of related literature on outbreak detection algorithms and performance mea-surements in Chapter 2. The main contributions of the research are explained in details in Chapter 3, 4, and 5 as summarized above. Finally, we conclude and outline future work in Chapter 6.
CHAPTER 2
LITERATURE REVIEW
According to Fricker (2011, p. 403), "Biosurveillance is the process of actively gathering and analyzing data related to human health and disease in order to obtain early warning of human disease events, and overall awareness of disease activities in the population." Outbreak detection algorithms play a central role in automated biosurveillance, analyzing large volumes of clinical data in real-time and detecting the potential of a disease outbreak.
In this chapter, we review the basics of surveillance data and its behaviour and some of the existing outbreak detection algorithms.We discuss the evaluation process of outbreak detection al-gorithms and introduce the main evaluation measures. Next, we review basic concepts of evaluating learned hypotheses. Details of the learning algorithms that we build on will be reviewed as needed in the later chapters.
2.1 Basic Description of Surveillance Data
The most common sources of data for syndromic surveillance are patient visits in hospital emer-gency departments and clinics, over the counter medication sales in pharmacies, calls to emeremer-gency centres, and school absenteeism. These data are called surveillance data. Surveillance data are gathered in the form of time series. In the absence of an outbreak event, surveillance data is called background data. Whenever an outbreak event occurs, the care-seeking infected population adds an outbreak signal to the surveillance data. The automated biosurveillance system analyzes the surveillance data to find outbreak patterns.
Background data collected over several years of monitoring is useful to observe long-term trends, i.e., general changes that are not repeated over the range of data during analysis. The most common long-term trend in surveillance data is due to the increase or decrease in the size of the population under monitoring. Long-term trends usually add a linear component over the time series. For example, every year the population may increase by 1000 people, or by 15%1.
In addition to long-term trends, there exist cyclic patterns in surveillance data which are repeated in time intervals. These patterns are called seasonal trends. An example of seasonal pattern is the increase in the number of clinical visits for influenza-like illnesses during autumn and winter. This
change is not a long-term trend, because after the cold season of the year, the number of visits decreases, and it is cyclic because every year the pattern is repeated.
Another pattern that might be observed in surveillance data is called day-of-week effect. For example, if the visit counts are monitored in a clinic that is closed on holidays and weekends, there is a sharp increase in the number of visits on Monday and after holidays, but this increase should not be considered as an outbreak (Lombardo and Buckeridge, 2007). As an example, Figure 2.1 shows seasonal and day-of-week effects in two biosurveillance time series. This time series consists of daily counts of respiratory visits in a large area over 3 years of surveillance. While seasonal trends are obvious in the upper plot, the lower plot magnifies the reduced visits on holidays and weekends (Lombardo and Buckeridge, 2007).
Figure 2.1 Seasonal trends and day-of-week effects in surveillance time series (Lombardo and Buckeridge, 2007)
The day-of-week effects, seasonal trends, and long-term trends caused by natural variations can be interpreted as expected background patterns. They are expected because the required informa-tion for modelling these patterns is available. However, the interpretainforma-tion as background noise is variable: an event that is significant in one context may be irrelevant in another. For example, the onset of seasonal flu is an outbreak signal in a system with the goal of general public health surveillance, but it is noise to a system concerned with the detection of anthrax attacks (Lombardo and Buckeridge, 2007).
One external influence on surveillance data is the variation in the care-seeking population. In analyzing surveillance data, it is best to estimate the proportion of infected people rather than using the number of infected people, as the latter is influenced by the size of the population. For example, a sudden increase in the number of flu cases in a military treatment facility after a large recruitment is not a sign of a flu outbreak. Conversely, a sudden drop in the size of the population might mask a real outbreak, if it is simultaneous with a real outbreak. Hence, epidemiologists usually estimate rates across time periods, as the number of infected people in a population at a given time divided by population size at that time (Lombardo and Buckeridge, 2007).
Ignoring the influence of the systematic patterns and variations of the population in modelling background data reduces the performance of outbreak detection algorithms, so the analysis of back-ground data is necessary before applying outbreak detection algorithms. We will now discuss out-break detection algorithms.
2.2 Outbreak Detection Algorithms
Early detection of disease outbreaks can reduce the disease impact and save lives, but this type of investigation is costly and excessive false alarms weaken the credibility of the alerting system. So, biosurveillance system developers look for outbreak detection algorithms with high sensitivity and few false alarms.
An outbreak detection algorithm looks for significant differences between the expected value and the observed value of the surveillance time series at a time t. If this difference exceeds a predefined threshold, the algorithm triggers an alert and warns of an outbreak event. The time interval over which the difference is computed is called test interval. Most detection algorithms work based on daily test intervals. The portion of the surveillance time series used to calculate the expected value is called baseline interval. For example, in an outbreak detection algorithm that uses the average number of visits to a clinic for a specific disease in last seven days, the length of the baseline interval is 7.
If the parameters and thresholds of outbreak detection algorithms are adjusted according to re-cent data, the algorithms are called adaptive. In non-adaptive algorithms, the entire historical surveillance data is used as a baseline interval, while the baseline interval of adaptive algorithms is a sliding window in the time series.
2.2.1 C-algorithms
The C-family of outbreak detection algorithms was developed in the Early Aberration Report-ing System (EARS) and is widely used by the Centre of Disease Control and Prevention, USA (CDC) and other public health departments. The C-family algorithms, C1, C2, and C3, are adap-tive algorithms developed based on the process control chart concept used for controlling industrial processes (Hutwagner et al., 2003). These algorithms take advantage of the Central Limit Theo-rem, which states that a series of means approaches a Gaussian distribution as the size of series increases (Lombardo and Buckeridge, 2007). So, the expected value of the time series for time t is simply the mean of the values observed during the baseline interval. Generally, C-algorithms measure the variation of the observed value from the mean of the baseline interval. If this variation is much bigger than the standard deviation of the data from the baseline interval (e.g., three times above standard deviation), an unusual event is flagged and the possibility of a disease outbreak is signalled.
The C1 and C2 algorithms use Equation (2.1) for deriving the test statistic from the baseline interval.
testStatistict =
observedt− meanbaseline
standardDeviationbaseline
(2.1) An alert is issued if testStatistict > 3. The threshold 3 used in the EARS system was derived
empirically. Since the baseline interval is a sliding window and moves forward each day, the parameters of the C-algorithms (i.e. the mean and standard deviation of the baseline) change every day, so the C-algorithms are adaptive.
The difference between the different C algorithms is in the configuration of two parameters, as we will now describe. The length of the baseline interval for all C algorithms is 7 days. The C1 algorithm uses the baseline interval from day t− 7 to t − 1 for computing the test statistic used on day t. Generally, gradually increasing outbreaks can bias the test statistic upward, so the detection algorithm will fail to flag the outbreak. To avoid this situation, the solution is to use a gap between the baseline interval and the test interval. This gap is called guardband or buffer interval. The C2 algorithm uses a 2-day guardband interval, so its baseline interval is from day t−9 to t−2. The use of the guardband in C2 improves the sensitivity of outbreak detection compared with C1, because outbreaks spread over several days are not missed.
The C3 algorithm also uses a 2-day guardband and the baseline interval is from day t− 9 to day t − 2. But, C3 evaluates the variation of the test statistic over 3 recent days, t, t − 1, and t − 2 instead of just day t. An alert is issued if testStatistict+ testStatistict−1+ testStatistict−2 > 3.
C3 has better sensitivity because small changes in the time series are cumulated, enabling earlier detection. If the C2 algorithm produces an alert, C3 will alert too. However, C3 is also more prone to generate false alarms. To summarize, C1 is the least sensitive because of the lack of a guardband, C2 has moderate sensitivity, and C3 is the most sensitive algorithm, using guardband and the average of the three recent observations. Recalling the systematic patterns of surveillance time series introduced in section 2.1, the C-algorithms take seasonal trends into account, because the mean and standard deviation are calculated in generally speaking the same season (cycle) as the test interval (Hutwagner et al., 2005).
The simplicity of the C-algorithms has made them popular and widely used among public health departments, and several modifications of these algorithms have been adopted by local users. How-ever, the C-algorithms have several drawbacks. First, the short baseline of 7 days makes them volatile, since the threshold (3×standardDeviationbaseline) fluctuates noticeably day-to-day.
Sec-ond, the assumption of the Central Limit Theorem is a Gaussian distribution for the average of input time series. Most surveillance time series have a negative binomial or Poisson distribution. These distributions have longer tails than the Gaussian distribution, so the number of false alarms in-creases. In practice, statistical and heuristic measures are applied to reduce the number of false alarms (Lombardo and Buckeridge, 2007). These led to a lot of work on modifications of the C-algorithms, especially C2, because of its moderate sensitivity. Here, we describe the most important modifications.
As we discussed earlier, there might be weekly patterns in the surveillance time series, which the C-algorithms do not take into account. Tokars et al. (2009b) proposed a simple method to adjust the C-algorithms for time series with weekly patterns. This method stratifies the baseline data to two baselines, one for weekdays and one for weekend days. The mean and standard deviation of each baseline are calculated separately. This variation of the C-algorithms is called the W2 algorithm if two days immediately before the test day are excluded from the baseline. The W3 algorithm is similar to W2 but also uses two days of guardband and pools three test-statistics, in the spirit of C3. Experiments showed that stratifying baseline days into weekdays versus weekends increases the sensitivity of detection in the data set which has a strong day-of-week effect, but mostly decreases sensitivity in data sets without weekly patterns (Tokars et al., 2009b).
The short 7-day baseline interval of C2 produces volatile parameters, so that the triggering alert threshold might vary widely over a short period of time. To decrease the volatility of the algorithm, Tokars et al. (2009a) proposed to lengthen the baseline interval because a 7-day baseline interval does not provide sufficient data for an accurate and stable calculation of mean and standard devia-tion. They tested baselines intervals of 7, 14, and 28 days. The result was that the longer baselines
improved the sensitivity of the detection algorithm, by producing more accurate and stable standard deviation estimates, but had no effect on the accuracy of the expected value calculation.
The C2 algorithm also does not account for the population at risk, which may vary during a crisis situation. Tokars et al. (2009a) adjusted C2 to consider the rate of daily visits to a medical centre. In the rate-based C2 algorithm, the observed value at time t is replaced by:
Observedt×
∑L
i=1syndromicV isitsi
∑L
i=1totalV isitsi
, (2.2)
where L is the length of the baseline interval, syndromicV isitst is the number of visits for a
specific syndrome on day t, and totalV isitst is the number of total visits on day t. It means that
for calculating the expected number of clinical visits for a given syndrome on day t, the number of visits for that syndrome is summed over 7 recent days (or a longer baseline); the total visits to the medical centre is also summed over the same period of time; the proportion of these two values is calculated and multiplied by the number of visits for that syndrome on day t (i.e. the observed value). Then, the variation of expected value from the observed value is evaluated, in number of standard deviations (Xing et al., 2011). The standard deviation is computed as:
standardDeviationt=
∑L
i=1|syndromicV isitsi−
totalV isitsi× ∑L j=1syndromicV isitsj ∑L j=1totalV isitsj | L (2.3) Although the number of total visits is not an ideal denominator for calculating rates, in general it is better than not having denominator (Tokars et al., 2009a). Accounting for the total visits of medical centre improved the accuracy of calculation of expected value and the sensitivity of the rate-based C2 was better, compared to simple count-based C2, at the same alert rate (Tokars et al., 2009a).
2.2.2 Non-adaptive Log-linear Regression Algorithm
The global non-adaptive regression model of surveillance data assumes that the chosen covari-ates, such as long-term trends, seasonal trends, and day-of-week, are sufficient to capture the sys-tematic background behaviour of the time series. The expected value at t is computed as a linear combination of these covariates. If the observed value at time t is outside a certain range, the algorithm flags an outbreak event (Burkom et al., 2007).
This algorithm uses several years of historical data as the baseline interval, in order to extract the systematic patterns and estimate the algorithm parameters. Afterwards, parameters will not be
adjusted to changes, so the model is not adaptive to recent data.
In the non-adaptive log-linear regression algorithm proposed by Brillman et al. (2005), the origi-nal value at time t is transformed into log scale, because the time series values differ on a percentage scale rather than by fixed amounts. This model assumes that the difference between the expected value and the observed value has a Gaussian distribution. Ordinary least square is used for param-eter estimation. The expected value at time t is estimated as:
log(Expectedt) = [ 7
∑
i=1
ci∗ dowi(t)] + [c8+ c9∗ t] + [c10∗ cos(2πt/365.25) + c11∗ sin(2πt/365.25)]
(2.4) where t is the day of the year. The term [∑7i=1ci ∗ dowi(t)] captures the day-of-week effect. The
coefficients, c1− c7are trained from the baseline data and
∑7
i=1ci = 0. The indicator of the day of
week, dowi(t) is 1 for the i-th day of week and zero for the others.
The term [c8+ c9 ∗ t] captures the long-term trends, like changes in the size of population, with
the assumption that the long-term trend is a linear component over the surveillance time series. This term might mask gradually increasing outbreaks (Lombardo and Buckeridge, 2007).
The last term [c10∗ cos(2πt/365.25) + c11∗ sin(2πt/365.25)] captures the seasonal trend, where
365.25 is the average number of days in a year and 2π/365.25 gives a 1-year sinusoidal cyclic behaviour. The coefficients of each trend can be set to zero if the corresponding pattern is not observed in the data.
All parameters are estimated using a long baseline, and are not adapted to recent changes in data. This algorithm is suitable only if training data over several years, without large year-to-year changes, is available.
2.2.3 Adaptive Log-linear Regression Algorithm
A modified version of log-linear regression uses a shorter sliding baseline interval of 56 days (Burkom, 2003). Hence, the logarithm of the expected value at time t is computed similarly to the non-adaptive algorithm as:
log(Expectedt) = [ 7
∑
i=1
ci ∗ dowi(t)] + [c8+ c9∗ t] + [c10∗ holidayt] (2.5)
As in the non-adaptive regression model, the term [∑7i=1ci ∗ dowi(t)] models the day-of-week
series (e.g., the number of clinical visits) in post-holiday day may increase after it. The term [c10∗ holidayt] captures this effect. The holiday indicator holidayt is 1 if day t is a holiday. Note
that this effect is not noticeable for a very long baseline, but could be significant for a 56-day baseline.
Comparing with non-adaptive regression algorithm, the sinusoidal term for capturing seasonal trends over a year was removed because the baseline is short. Instead, the term [c8+ c9∗ t] captures
recent seasonal and long-term trends. A 2-day guardband interval is used to avoid the contamination of the baseline interval and test interval.
Lombardo and Buckeridge (2007) showed that the adaptive log-linear regression algorithm pre-dicted more accurately than non-adaptive algorithm, because the model of time series in the adap-tive algorithm reflects the recent behaviour of data.
Regression algorithms developed for one time series cannot be transferred easily to other time series. The performance comparison between C-algorithms and the regression algorithm will be discussed in section 2.2.4.
2.2.4 Adaptive Poisson Regression Algorithm
To adopt a broader perspective on adaptive log-linear regression algorithm discussed in section 2.2.3, we can see the computation of the expected value as a linear combination of the data values:
Expectedt= f ([ n
∑
i=1
ci ∗ xi(t)] + ε) (2.6)
where xi(t) are values based on the time series and ε is the error term. The class of models
de-scribed by Equation (2.6) is called generalized linear models (GLM) (Nelder and Wedderburn, 1972). The GLMs are general category of models for a random variable from an exponential fam-ily distribution. This famfam-ily is very rich and includes Gaussian, binomial, multinomial, Poisson, and other distributions. A GLM assumes that the input variable comes into the model via a linear combination CTx and the output is represented as a function of this linear combination f (CTx). The function f is known as an activation function in the machine learning literature, whereas its inverse, f−1, is called a link function in the statistics literature. The activation function provides the relationship between the linear combination and the mean of the distribution. The choice of exponential family distribution and the choice of the activation function provide the specification of a GLM. The choice of exponential family distribution is constrained by the nature of the data. The constraints reflecting the conditional expectation of the model are imposed on the activation
function. For example, for a Bernoulli distribution the conditional expectation must lie between 0 and 1, so an activation function with the range of (0, 1) should be selected.
From this perspective, the link function of adaptive log-linear regression is a logarithmic function of the surveillance data and the error term is assumed to have a Gaussian distribution.
As discussed in section 2.2.1, the assumption of a Poisson distribution is more realistic for surveillance time series than the Gaussian assumption. For this reason, the Poisson regression algorithm uses a generalized linear model for outbreak detection and assumes that the distribution of the error is Poisson. Poisson regression does not require constant variance and can be more robust than other generalized linear models. Xing et al. (2011) developed a Poisson regression algorithm with a baseline interval of 56 days. Empirical studies did not show any improvement by using longer baseline intervals. Also, this algorithm captures the seasonal trends in cycles of 14 days. A 2-day guardband was used to avoid the contamination of the baseline interval and test interval. The Poisson regression algorithm with logarithmic link function estimates the expected value at time t as:
log(Expectedt) = c0+ [c1∗ dowbaseline(t)] + [c2∗ 14daybaseline(t)] (2.7)
where c0 is a constant intercept, the term [c1 ∗ dowbaseline] captures the day-of-week effect, and
the term [c2 ∗ 14daybaseline] represents the current seasonal behaviour. The indicator variable
14daybaseline has a fixed value for each day during the in-day interval. The Poisson regression
algorithm is adaptive to recent changes in the data and the algorithm parameters and threshold for alerting are estimated based on a sliding window of 56 days.
The Poisson regression algorithm described above can be modified in order to consider the pro-portion of infected population. For this purpose, two variations of Poisson regression were devel-oped by Xing et al. (2011). In the first modified Poisson regression, the number of total clinical visits during the most recent 56 days was presented as an additive covariate, so the expected value of time t is estimated as:
log(Expectedt) = c0+ [c1∗dowbaseline(t)] + [c2∗14daybaseline(t)] + [c3∗totalV isitsbaseline] (2.8)
where totalV isitsbaseline is the total number of clinical visits during 56 days of baseline and the
day t.
In the second modified Poisson regression algorithm, the log of total clinical visits was used as an offset log(totalV isitsbaseline) in the computation of expected value at time t. This algorithm
uses the ratio of syndromic and total visits rather than modelling syndromic counts with total visits as a covariate, as in the former version.
Now, we briefly describe the threshold calculation method used by Xing et al. (2011). Generally, the surveillance time series are not time-independent and do not fit a single probability distribution. Therefore, using a single probability distribution function to derive an alerting threshold is not appropriate. Xing et al. (2011) used historical baseline data and the concept of recurrence interval to derive the threshold. The recurrence interval is the number of the days for which the expected number of threshold crossing events is 1, so the empirical daily probability of crossing the threshold is 1/N. Since an alert rate of 1 in almost 3 months is practical for public health surveillance, they chose a recurrence interval of 100 days. They calculated the z-score of the time series as:
z− scoret=
Observedt− Expectedt
standrardDeviationt
(2.9) Then, they selected the 99th percentile cutoff value of all z-scores from the time series as the alerting threshold. Thus, the daily alert rate for each time series is the same, 1% (Xing et al., 2011). Xing et al. (2011) used real data from US CDC BioSense surveillance system of emergency department with artificially-added increases in syndrome counts for evaluating the performance of detection algorithms. The performance evaluation of the Poisson regression algorithm and its modifications showed that including the total number of visits improved the accuracy of prediction and the sensitivity of the detection algorithm, because considering the total number of clinical visits helps in modelling the unexpected and hard-to-model effects (e.g., unscheduled closure of clinics). Specifically, the second approach (i.e. using the log of total visits as an offset) outperformed the first modified version (Xing et al., 2011).
Furthermore, Xing et al. (2011) also compared the performance of outbreak detection of Poisson regression algorithms, linear regression, and modified versions of the C-algorithms (specifically, rate-based C2 and C2 with longer baseline intervals). Generally, the Poisson regression performed better than the linear regression algorithm, because Poisson regression does not require constant variance and is more robust than linear regression. The regression algorithms outperformed mod-ified C-algorithms in both accuracy of prediction and sensitivity of outbreak detection. However, for sparse time series in which the number of clinical visits is low, regression algorithms can over-fit the data. Finally, accounting for the total size of population always resulted in more accurate predictions and higher sensitivity of detection for all algorithms.
2.2.5 Generalized Likelihood Ratio Test
The Generalized Likelihood Ratio Test (GLRT) is based on the maximum of a function of the observed and expected number of cases within a fixed-width window. GLRT is used for retrospec-tive evaluations of disease incidence over time, however Wallenstein and Naus (2004) simulated GLRT for prospective temporal surveillance. This method has the advantage of using a window with constant width over the test period without cancelling seasonal and day-of-week patterns. This method sounds an alarm if the following testStatistictis larger than a threshold.
testStatistict(w) = Observedt(w) log(
Observedt(w)
Expectedt(w)
)− (Observedt(w)− Expectedt(w))
(2.10) where Expectedt(w) is the expected number of cases in a window of w days ending at time t.
Expectedt(w) is calculated based on historical average seasonality. It is the average of
observa-tions in the same window of time over last year(s) of surveillance. Different approaches are used to implement this procedure, depending on the type of available baseline data. An alternative surveil-lance method, called P-scan, scans p-values. It is based on approximations thus can overstate or understate the probabilities. Wallenstein and Naus (2004) shows the P-scan and GLRT statistics with fixed-width windows are highly correlated and can be applied where quick detection of large peaks is vital. However, methods that monitor CUSUM statistics are superior for gradual increases. 2.3 Evaluation of Outbreak Detection Algorithms
In this section, first we examine the data which is used for evaluation of outbreak detection algorithms. Then, we review the formal definitions of performance measures of outbreak detection algorithms.
2.3.1 Evaluation Data
One important challenge of evaluating outbreak detection algorithms is obtaining surveillance data with sufficiently large number of outbreaks. Ideally, the evaluation data must contain outbreaks with known characteristics. Important outbreak characteristics are the magnitude of the outbreak signal, the shape of the signal, and the timing of the outbreak. The magnitude of the outbreak signal is the increment above the background signal due to the incidence of an outbreak. The shape of the signal expresses how this increase occurs; quickly over time or slowly over several days. The timing of the outbreak states the overall duration of the outbreak and the time between the onset of the outbreak and the peak day. Outbreak characteristics may influence the performance of outbreak detection algorithms (Buckeridge, 2007).
There are three common approaches to provide data for evaluation. Although using surveillance data collected from real outbreaks may initially seem to have the greatest validity for performance evaluation, it has several drawbacks. First, the characteristics of the outbreak signal (e.g the onset of the signal) cannot be derived without error. The reliance on an external review or imperfect stan-dard to define those characteristics limit the accuracy and usefulness of real data. Moreover, there are few available time series containing verified outbreaks, even fewer associated with emerging infectious diseases or bio-terrorism (Lombardo and Buckeridge, 2007).
In the semisynthetic approach, simulated disease outbreaks are injected into real background data. The signal characteristics (e.g., the onset, magnitude, and shape of the signal) are known with certainty and random variations in outbreak signals and the onset time can be simulated. The main drawback of this approach is that the background data may contain undocumented outbreaks. Also, the simulated outbreaks are noise-free and the expected noise of real data is underestimated. This issue may result in overestimation of an algorithm’s sensitivity and timeliness (Wagner and Wallstrom, 2006).
In the third approach of providing evaluation data, simulated outbreaks are injected into simu-lated background data. In this approach, the characteristics of outbreaks and background data are known with certainty and can be completely controlled to produce a wide variety of evaluation data, however, it is difficult to model background data.
While fully authentic outbreaks tend to be used in qualitative evaluation, the simulated outbreaks are useful in quantitative evaluation of outbreak detection algorithms. The semisyntethic and fully syntethic data are usually used for comparing a detection algorithm against other algorithms, test whether the algorithm is working, and check if its performance can be improved (Wagner and Wallstrom, 2006).
There are several methods for simulating the outbreaks. One is using mathematical functions (like step or linear) or probability functions (like exponential or lognormal) to generate different outbreak signals over time. Another method is using empirical density functions that are computed from observed real outbreaks. In the mechanistic simulation model, the mechanism underlying an outbreak, including disease, infection, and health care utilization are described. People are modelled in either network-based framework to extend communicable diseases or as independent stochastic processes in noncommunicable diseases. Mechanistic simulation models have many parameters and the parameter value selection influences on the result (Lombardo and Buckeridge, 2007).
The evaluation data that we used in this study is semisynthetic data generated by a mechanistic approach. The simulated surveillance data were generated using the Simulation Analysis Platform (SnAP) (Buckeridge et al., 2011) with a validated model for simulating waterborne outbreaks of cryptosporidiosis (Okhmatovskaia et al., 2010). In this simulation scenario, waterborne outbreaks were due to the failure of a water treatment plant. The simulation model includes components to represent water distribution, human mobility, exposure to drinking water, infection, disease pro-gression, healthcare utilization, laboratory testing, and reporting to public health. We used this model with the SnAP to conduct many simulations of surveillance data that would result from a waterborne outbreak due to the failure of a water treatment plant in an urban area. This model creates a synthetic population from census data, and then uses 30 parameters to define the progres-sion of individuals through the model. In the simulation scenarios for generating our data, two parameters were varied systematically: the duration of water contamination, which was varied over 6 values (72, 120, 168, 240, 360 and 480 hours), and the cryptosporidium concentration, which was varied over 3 levels (10−6, 10−5, 10−4). The possible combinations of these values define 18 different scenarios. Each of these 18 scenarios was run 1000 times using Latin Hypercube Sam-pling to randomly select values from hyper-distributions for the other parameters in the model. The outbreak signals were superimposed on baseline data, which were daily counts of people visiting emergency departments in Montreal for gastro-intestinal diseases, over 6 years. The onset of the outbreak was selected randomly, relative to the baseline.
2.3.2 Evaluation Metrics
The goal of outbreak detection algorithms is rapid detection of outbreaks with few false alerts. To assess the accuracy of detection algorithms three quantities are measured: specificity, sensitivity, and timeliness. Specificity is the probability of no alarm when there is no outbreak:
specif icity = P (alarm = 0|outbreak = 0) = n(alarm = 0, outbreak = 0)
n(outbreak = 0) (2.11)
where n(alarm = 0, outbreak = 0) is the number of non-outbreak days in which the algorithm does not raise an alarm and n(outbreak = 0) is the number of non-outbreak days in an analysis interval.
Sensitivity is the probability of raising an alarm given that an outbreak really occurred:
sensitivity = P (alarm = 1|outbreak = 1) = n(alarm = 1, outbreak = 1)
where n(alarm = 1, outbreak = 1) is the number of alerts in outbreak days and n(outbreak = 1) is the number of outbreak days. There exists two interpretation of the sensitivity of a detection algo-rithm. One might count the outbreak days in which the algorithm raises an alarm in the numerator of Equation (2.12) and the total number of outbreak days in the denominator. This is the probabil-ity of correctly classifying outbreak days and is called sensitivprobabil-ity per day. Alternatively, one can only measure the number of detected outbreaks in the numerator, no matter how many alarms have been raised within an outbreak, and count the number of outbreak intervals in denominator which differs from the number of outbreak days if an outbreak lasts for several days. In epidemiological context, the second interpretation of sensitivity, called sensitivity per outbreak, makes more sense because excessive alerts within a single outbreak are trivial. Table 2.1 illustrates a simple example of measuring the accuracy of detection algorithms.
The quantity of false alarm rate is the probability that an algorithm classifies a non outbreak day incorrectly and raises the alarm in the absence of outbreak:
f alseAlarmRate = P (alarm = 1|outbreak = 0) = n(alarm = 1, outbreak = 0)
n(outbreak = 0) (2.13) False alarm rate and specificity are sum to one and can be used in evaluations interchangeably (Wagner et al., 2006).
When sensitivity and specificity are calculated over a range of parameter settings for an algo-rithm, their values can be plotted to determine the receiver operating characteristic (ROC) curve. The ROC curve is a means of comparing sensitivity and specificity visually over a range of algo-rithm thresholds. In practice, the ROC curve is plotted based on sensitivity and false alarm rate (i.e. 1-specificity) and points near to the left with higher sensitivity and specificity are more de-sirable. An ideal detection algorithm that classifies all outbreak and non-outbreak days correctly corresponds to point (0,1) in an ROC curve. A classifier that guesses at random corresponds to a diagonal ROC curve. However, when the sensitivity is calculated per outbreak and specificity is calculated per analysis interval, the random line is not necessarily diagonal because they are not
Table 2.1 Example of accuracy of detection algorithms outbreak non-outbreak
alarm 7 5
no alarm 3 95
total 10 100
calculated in the same scale (Lombardo and Buckeridge, 2007).
The area under an ROC curve (AUC) is a summary of measure of the classification accuracy. Since the AUC is a portion of the area of the unit square, its value is always between 0 and 1.0. Assume that a detection algorithm is a classifier of outbreak and non-outbreak days and raises an alarm if the test value of a questioned day is higher than the threshold. The AUC has a statistical interpretation: the AUC of a classifier is equivalent to the probability that the classifier will rank a randomly chosen outbreak day higher than a randomly chosen non-outbreak day (Fawcett, 2004). An ideal classifier has an AUC of 1.0 and classifier that guesses at random (i.e. diagonal ROC curve) has an AUC of 0.5 (Wagner et al., 2006).
While sensitivity and specificity summarize the overall ability of an algorithm to detect out-breaks, they do not evaluate the timeliness of detection. Timeliness is the time between the start of an outbreak and the detection of the outbreak by an algorithm if it is detected. Timeliness is defined as the proportion of time saved by detection relative to the onset of an outbreak. If an outbreak is detected, timeliness is:
timeliness = 1− tdetection− tonset
outbreakDuration (2.14)
where outbreakDuration is the number of days for which outbreak cases occur. The tdetection is
the index of the day within the time series when the outbreak is detected and tonset is the index
of the day on which the outbreak starts. The proportion of delay is subtracted from 1, so higher values of the timeliness denote an earlier detection of the outbreak. Timeliness is 1 if the outbreak is detected in the first day of occurrence and 0 when the outbreak is not detected (Lombardo and Buckeridge, 2007). Surveillance systems require outbreak detection algorithms that avoid false alarms as much as possible while improving the timeliness of detection.
2.4 Evaluation of Learned Hypotheses
In this section, we shortly discuss how to estimate the quality of learned hypotheses. In machine learning, the learning process and the evaluation of algorithms are only based on a limited amount of data. However, it is important to understand the accuracy of algorithms on new data that the algorithms have not seen before. A learning algorithm is usually trained using a training set. If data is plentiful, then one can use some of the available data to train a range of hypotheses and then compare them on independent data, called a validation set, and select the hypothesis which has the best predictive performance. During the learning process, as the model is developed using a limited size of data and the complexity of the model grows, the prediction error on training set decreases, but the prediction error on validation set first decreases and then increases. This occurs because the model is being tuned to fit the training set that is not representative of the general distribution
of data. This is called the problem of over-fitting to data. So this predictive performance is not a good indicator for choosing the best learned hypothesis. It is necessary to keep aside a third test set which is completely untouched during training and validating a model and finally evaluate the performance of a selected model on it (Bishop, 2006).
However, in practice, the supply of data for training and testing is limited. One solution to estimate the predictive performance is to use cross-validation. In cross-validation, the n available instances of data are partitioned into k disjoint subsets of size n/k. Then the cross-validation procedure is run k times, each time using a different one of these subsets as the validation set. Other subsets are combined and used to train a set of models which will be evaluated on the subset that was left out (Bishop, 2006).


![Figure 3.10 The belief bars of BN for the sensitivity, timeliness and other variables assuming the specificity of [0.95, 1]](https://thumb-eu.123doks.com/thumbv2/123doknet/2333517.32224/55.918.199.720.107.487/figure-belief-bars-sensitivity-timeliness-variables-assuming-specificity.webp)
